

Deep Learning Glioma Grading with the Tumor Microenvironment Analysis Protocol for Comprehensive Learning, Discovering, and Quantifying Microenvironmental Features
- PMID: 38413460
- PMCID: PMC11573951
- DOI: 10.1007/s10278-024-01008-x
Deep Learning Glioma Grading with the Tumor Microenvironment Analysis Protocol for Comprehensive Learning, Discovering, and Quantifying Microenvironmental Features
Erratum in
-
Correction to: Deep Learning Glioma Grading with the Tumor Microenvironment Analysis Protocol for Comprehensive Learning, Discovering, and Quantifying Microenvironmental Features.J Imaging Inform Med. 2025 Feb;38(1):660. doi: 10.1007/s10278-024-01160-4. J Imaging Inform Med. 2025. PMID: 38864948 Free PMC article. No abstract available.
Abstract
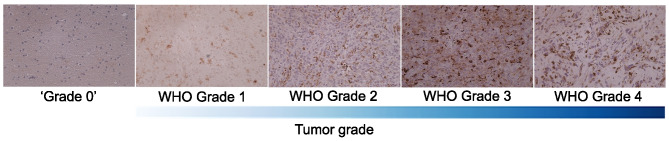
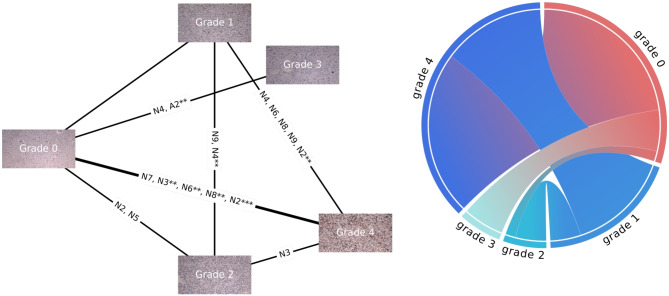
Gliomas are primary brain tumors that arise from neural stem cells, or glial precursors. Diagnosis of glioma is based on histological evaluation of pathological cell features and molecular markers. Gliomas are infiltrated by myeloid cells that accumulate preferentially in malignant tumors, and their abundance inversely correlates with survival, which is of interest for cancer immunotherapies. To avoid time-consuming and laborious manual examination of images, a deep learning approach for automatic multiclass classification of tumor grades was proposed. As an alternative way of investigating characteristics of brain tumor grades, we implemented a protocol for learning, discovering, and quantifying tumor microenvironment elements on our glioma dataset. Using only single-stained biopsies we derived characteristic differentiating tumor microenvironment phenotypic neighborhoods. The study was complicated by the small size of the available human leukocyte antigen stained on glioma tissue microarray dataset - 206 images of 5 classes - as well as imbalanced data distribution. This challenge was addressed by image augmentation for underrepresented classes. In practice, we considered two scenarios, a whole slide supervised learning classification, and an unsupervised cell-to-cell analysis looking for patterns of the microenvironment. In the supervised learning investigation, we evaluated 6 distinct model architectures. Experiments revealed that a DenseNet121 architecture surpasses the baseline's accuracy by a significant margin of 9% for the test set, achieving a score of 69%, increasing accuracy in discerning challenging WHO grade 2 and 3 cases. All experiments have been carried out in a cross-validation manner. The tumor microenvironment analysis suggested an important role for myeloid cells and their accumulation in the context of characterizing glioma grades. Those promising approaches can be used as an additional diagnostic tool to improve assessment during intraoperative examination or subtyping tissues for treatment selection, potentially easing the workflow of pathologists and oncologists.
Keywords: Automated glioma grading; Deep learning; Human leukocyte antigen; Quantification of tumor microenvironment elements; Tissue microarrays.
© 2024. The Author(s).
Conflict of interest statement
The authors declare no competing interests.
Figures


Similar articles
-
Voxel-based clustered imaging by multiparameter diffusion tensor images for glioma grading.Neuroimage Clin. 2014 Aug 7;5:396-407. doi: 10.1016/j.nicl.2014.08.001. eCollection 2014. Neuroimage Clin. 2014. PMID: 25180159 Free PMC article.
-
Computer-aided diagnosis system for grading brain tumor using histopathology images based on color and texture features.BMC Med Imaging. 2024 Jul 19;24(1):177. doi: 10.1186/s12880-024-01355-9. BMC Med Imaging. 2024. PMID: 39030508 Free PMC article.
-
Glioma grading using a machine-learning framework based on optimized features obtained from T1 perfusion MRI and volumes of tumor components.J Magn Reson Imaging. 2019 Oct;50(4):1295-1306. doi: 10.1002/jmri.26704. Epub 2019 Mar 20. J Magn Reson Imaging. 2019. PMID: 30895704
-
Applications of radiomics and machine learning for radiotherapy of malignant brain tumors.Strahlenther Onkol. 2020 Oct;196(10):856-867. doi: 10.1007/s00066-020-01626-8. Epub 2020 May 11. Strahlenther Onkol. 2020. PMID: 32394100 Free PMC article. Review.
-
Meta-transfer Learning for Brain Tumor Segmentation: Within and Beyond Glioma.Adv Exp Med Biol. 2024;1462:221-230. doi: 10.1007/978-3-031-64892-2_13. Adv Exp Med Biol. 2024. PMID: 39523268 Review.
Cited by
-
Applications of artificial intelligence in the analysis of histopathology images of gliomas: a review.Npj Imaging. 2024 Jul 1;2(1):16. doi: 10.1038/s44303-024-00020-8. Npj Imaging. 2024. PMID: 40603567 Free PMC article. Review.
-
The utility of splicing factor SRSF1 in gliomas grading: A meta-analysis.Tunis Med. 2024 Sep 5;102(9):513-520. doi: 10.62438/tunismed.v102i9.4954. Tunis Med. 2024. PMID: 39287342 Free PMC article. French.
References
-
- T. Komori et al. Pathology and Genetics of Gliomas. Progress in Neurological Surgery, 31:1–37, 2018. - PubMed
MeSH terms
Grants and funding
LinkOut - more resources
Full Text Sources
Medical
Research Materials