. 2024 Feb 27;14(1):124.
doi: 10.1038/s41398-024-02827-w.

Convergent and divergent genes expression profiles associated with brain-wide functional connectome dysfunction in deficit and non-deficit schizophrenia

Affiliations

Convergent and divergent genes expression profiles associated with brain-wide functional connectome dysfunction in deficit and non-deficit schizophrenia

Chao Zhou et al. Transl Psychiatry. .

Abstract

Deficit schizophrenia (DS) is a subtype of schizophrenia characterized by the primary and persistent negative symptoms. Previous studies have identified differences in brain functions between DS and non-deficit schizophrenia (NDS) patients. However, the genetic regulation features underlying these abnormal changes are still unknown. This study aimed to detect the altered patterns of functional connectivity (FC) in DS and NDS and investigate the gene expression profiles underlying these abnormal FC. The study recruited 82 DS patients, 96 NDS patients, and 124 healthy controls (CN). Voxel-based unbiased brain-wide association study was performed to reveal altered patterns of FC in DS and NDS patients. Machine learning techniques were used to access the utility of altered FC for diseases diagnosis. Weighted gene co-expression network analysis (WGCNA) was employed to explore the associations between altered FC and gene expression of 6 donated brains. Enrichment analysis was conducted to identify the genetic profiles, and the spatio-temporal expression patterns of the key genes were further explored. Comparing to CN, 23 and 20 brain regions with altered FC were identified in DS and NDS patients. The altered FC among these regions showed significant correlations with the SDS scores and exhibited high efficiency in disease classification. WGCNA revealed associations between DS/NDS-related gene expression and altered FC. Additionally, 22 overlapped genes, including 12 positive regulation genes and 10 negative regulation genes, were found between NDS and DS. Enrichment analyses demonstrated relationships between identified genes and significant pathways related to cellular response, neuro regulation, receptor binding, and channel activity. Spatial and temporal gene expression profiles of SCN1B showed the lowest expression at the initiation of embryonic development, while DPYSL3 exhibited rapid increased in the fetal. The present study revealed different altered patterns of FC in DS and NDS patients and highlighted the potential value of FC in disease classification. The associations between gene expression and neuroimaging provided insights into specific and common genetic regulation underlying these brain functional changes in DS and NDS, suggesting a potential genetic-imaging pathogenesis of schizophrenia.


Conflict of interest statement

The authors declare no competing interests.

Figures
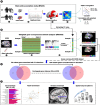
Fig. 1
Fig. 1. Schematic of data analysis pipeline.
A We performed a voxel-based unbiased brain-wide association study (BWAS) method on resting-state fMRI data to identify pathology as revealed by the significantly altered functional connectivity in DS and NDS patients compared to CN after controlling for age, sex, education, intracranial volume, and framewise displacement. To further test the clinical relevance of the main identified functional links as diagnostic features of DS and NDS, we applied a pattern classification approach using the alterations in the ROI as a biomarker to test how well this could distinguish patients with DS and NDS from the CN. To further assess the clinical significance of identified altered functional links in DS and NDS, we used linear regression model to quantify the dependency between differences in functional connectivity and deficit symptom severity as assessed by the SDS scale. B We used a WGCNA approach to identify the transcription-neuroimaging association between BWAS FC differences in DS and NDS and gene expression from the AHBA. C We calculated the overlapped genes between DS-related and NDS-related genes and schizophrenia-related genes in SZDB dataset. D GO, KEEG, and disease enrichment analysis was applied for these overlapped and non- overlapped genes between DS and NDS. Furthermore, we showed spatio-temporal expression patterns of the identified key genes. DS deficit schizophrenia, NDS non-deficit schizophrenia, CN healthy controls, ROI region of interest, FC functional connectivity, SDS schedule for deficit syndrome, AHBA Allen Human Brain Atlas, SZDB A Database for Schizophrenia Genetic Research (http://www.szdb.org/), GO Gene Ontology, BP biological process, CC cellular component, MF molecular function, KEGG Kyoto Encyclopedia of Genes and Genomes.
Fig. 2
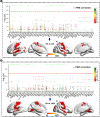
Fig. 2. The results of voxel-based unbiased brain-wide association study in DS and NDS groups.
Anatomical location of consistently altered functional connectivity in DS (A) and NDS (B) obtained from voxel-based BWAS. Manhattan plot of voxel-based unbiased brain-wide association study results indicating that DS showed significantly altered functional links compared to CN. Each dot represents a functional connectivity link between two voxels. Note there are a total of 23,178 × 23,178/2 links, and we only plot a significant dot if Cluster defining threshold (z-value) > 7. The red dotted line is the whole-brain FWE correction threshold p = 7.22 × 10−48. The regions indicate the AAL3 atlas regions in which the voxels were located, with the numbers for each region specified in Table S1. The glass brains indicated the anatomical location of the voxels showing significantly altered functional connectivity with other voxels (FWE < 0.05). The color bar indicates the measure of association (MA, see text) given by the number of significantly affected links relating to each voxel. We presented clusters voxels containing more than 100 significant voxels (MA > 40). DS deficit schizophrenia, NDS non-deficit schizophrenia, CN healthy controls.
Fig. 3
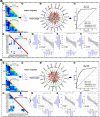
Fig. 3. Pattern classification power of identified altered functional links in DS and NDS from CN and its clinical significance.
A-a, B-a Functional connectivity matrix (i.e., features) were extracted from the ROI-wise functional connectivity (23 × 22/2 = 253 correlation coefficients for DS vs. CN; 20 × 19/2 = 190 correlation coefficients for NDS vs. CN) from results of voxel-based BWAS. A-b, B-b Indicating the schematic diagram of pattern recognition. A-c, B-c Circle diagram showed the contribution of all features in MRI-based “classifier” for distinguishing DS and NDS from CN. Red links indicate negative weight and black links Indicate positive weight. The thickness of links indicates the weight value. A-d, B-d ROC curve shows the classification power in MRI-based “classifier” for discriminating DS and NDS from CN. A-e, B-e Indicating the significant correlations between FC differences and deficit symptom severity in DS. A-f, h, g; B-f, h, g Indicating relationships between FC differences and SDS score (i.e. deficit symptom severity) in DS in the top three significant correlations. DS deficit schizophrenia, NDS non-deficit schizophrenia, CN healthy controls, FC functional connectivity, BWAS brain-wide association study, ACC accuracy, AUC area under the ROC curve, Opt optimum, ROC receiver operating characteristic, SDS Schedule for deficit syndrome. The anatomical abbreviations are for the areas in the AAL3 atlas, with abbreviations shown in Table S1.
Fig. 4
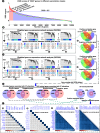
Fig. 4. Transcription-neuroimaging association between BWAS FC differences in DS and NDS and gene expression from the AHBA (six left hemispheres).
A The distribution of the DSS scores of the 10027 genes in different parcellation masks: parcellation 1000 (500 regions for each hemisphere), parcellation 500 (250 regions for each hemisphere), parcellation 300 (150 regions for each hemisphere), and parcellation 180 (HCP 180 regions for each hemisphere), respectively. B, C WGCNA dendrogram showing consensus modules based on the topological co-expression of genes with DSS >0.5. The heatmap shows spatial correlations (positive and negative correlations) between MEs of gene modules and FC alterations in parcellation 180 (BWAS180), parcellation 300 (BWAS300), parcellation 500 (BWAS500), parcellation 1000 (BWAS1000) in DS and NDS. Venn diagram shows gene numbers derived from different parcellation masks and their overlaps. Different colors indicate the numbers of genes derived from different parcellation masks. Note, we show positive and negative correlations, separately. D Venn diagram shows the overlaps between DS-related and NDS-related genes and schizophrenia-related genes in SZDB dataset, and shows gene numbers derived from DS and NDS and their overlaps. E The heatmap shows correlation matrix of gene expression of overlapping genes (E-a, b) and non-overlapped genes (E-c, d) between DS and NDS. Note, the full names of all gene abbreviations are shown in Table S4. DS deficit schizophrenia, NDS non-deficit schizophrenia, DSS differential stability score, WGCNA weighted gene co-expression network analysis, AHBA Allen Human Brain Atlas, SZDB A Database for Schizophrenia Genetic Research (http://www.szdb.org/).
Fig. 5
Fig. 5. Enrichment of overlapped genes between DS and NDS and spatio-temproal patterns of identified key genes.
A Indicating GO enrichment of positive and negative overlapped genes between DS and NDS (a, c), and indicating the relationships between identified genes and top five significant pathways (b, d). B Indicating KEEG enrichment and the relationships between identified genes and significant pathways. C Indicating genes expression differences and spatio-temporal expression patterns of the identified key genes. Each changing curve represents the change in gene expression throughout the lifespan. The box plot represents differences in gene expression of these two key genes in schizophrenia patients compared with healthy controls (Note: the box plot is from SZDB, http://www.szdb.org/). p < 0.001. DS deficit schizophrenia, NDS non-deficit schizophrenia, DSS differential stability score, WGCNA weighted gene co-expression network analysis, AHBA Allen Human Brain Atlas, SZDB A Database for Schizophrenia Genetic Research (http://www.szdb.org/), BP biological processes, CC cellular components, MF molecular function, OFC orbital prefrontal cortex, DFC dorsolateral prefrontal cortex, VFC ventrolateral prefrontal cortex, MFC medial prefrontal cortex, M1C primary motor (M1) cortex, S1C primary somatosensory (S1) cortex, IPC posterior inferior parietal cortex, A1C primary auditory (A1) cortex, STC superior temporal cortex, ITC inferior temporal cortex, V1C primary visual (V1) cortex. Note: all results show only results of significant enrichment.
Fig. 6
Fig. 6. Enrichment of non-overlapped genes between DS and NDS and spatio-temproal patterns of identified key genes.
A-a, c Indicating GO enrichment of positive and negative non-overlapped genes between DS and NDS. A-b, d Indicating the relationships between identified genes and top five significant pathways. B Indicating KEEG enrichment and the relationships between identified genes and significant pathways. C Indicating disease-related genes enrichment and the relationships between identified genes and significant pathways. D Indicating genes expression differences and spatio-temporal expression patterns of the identified key genes. Each changing curve represents the change in gene expression throughout the lifespan. The box plot represents differences in gene expression of these two key genes in schizophrenia patients compared with healthy controls (note: the box plot is from SZDB, http://www.szdb.org/). p < 0.001. DS deficit schizophrenia, NDS non-deficit schizophrenia, DSS differential stability score, WGCNA weighted gene co-expression network analysis, AHBA Allen Human Brain Atlas, SZDB A Database for Schizophrenia Genetic Research (http://www.szdb.org/), OFC orbital prefrontal cortex, DFC dorsolateral prefrontal cortex, VFC ventrolateral prefrontal cortex, MFC medial prefrontal cortex, M1C primary motor (M1) cortex, S1C primary somatosensory (S1) cortex, IPC posterior inferior parietal cortex, A1C primary auditory (A1) cortex, STC superior temporal cortex, ITC inferior temporal cortex, V1C primary visual (V1) cortex. Note: all results show only results of significant enrichment.

Similar articles

Cited by

References

    1. Whiteford HA, Degenhardt L, Rehm J, Baxter AJ, Ferrari AJ, Erskine HE, et al. Global burden of disease attributable to mental and substance use disorders: findings from the Global Burden of Disease Study 2010. Lancet. 2013;382:1575–86. - PubMed
    1. Tandon R, Nasrallah HA, Keshavan MS. Schizophrenia, “just the facts” 5. Treatment and prevention. Past, present, and future. Schizophr Res. 2010;122:1–23. - PubMed
    1. Harvey PD, Strassnig M. Predicting the severity of everyday functional disability in people with schizophrenia: cognitive deficits, functional capacity, symptoms, and health status. World Psychiatry. 2012;11:73–9. - PMC - PubMed
    1. Mucci A, Merlotti E, Ucok A, Aleman A, Galderisi S. Primary and persistent negative symptoms: concepts, assessments and neurobiological bases. Schizophr Res. 2017;186:19–28. - PubMed
    1. Carpenter WT, Jr, Heinrichs DW, Wagman AM. Deficit and nondeficit forms of schizophrenia: the concept. Am J Psychiatry. 1988;145:578–83. - PubMed