. 2024 Feb 27;15(1):1530.
doi: 10.1038/s41467-024-45579-3.

Bicarbonate signalling via G protein-coupled receptor regulates ischaemia-reperfusion injury

Affiliations

Bicarbonate signalling via G protein-coupled receptor regulates ischaemia-reperfusion injury

Airi Jo-Watanabe et al. Nat Commun. .

Abstract

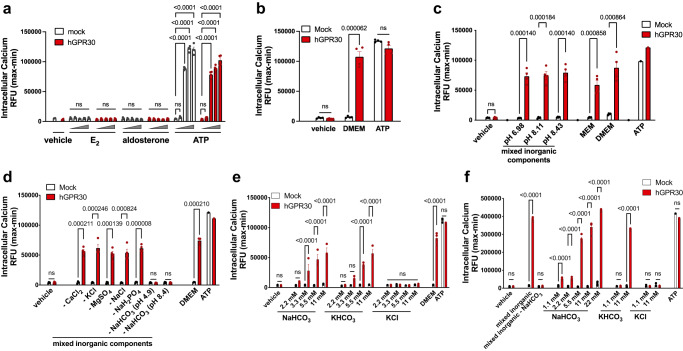
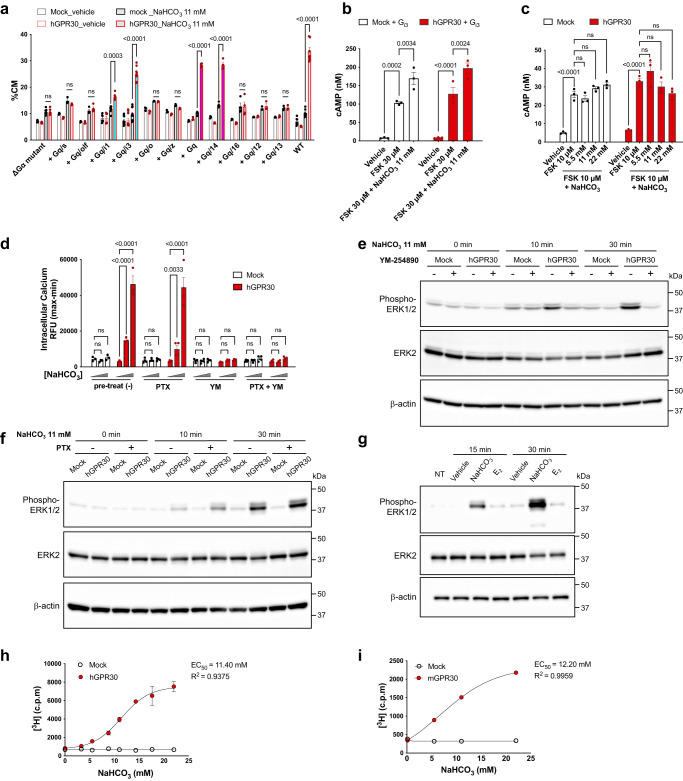
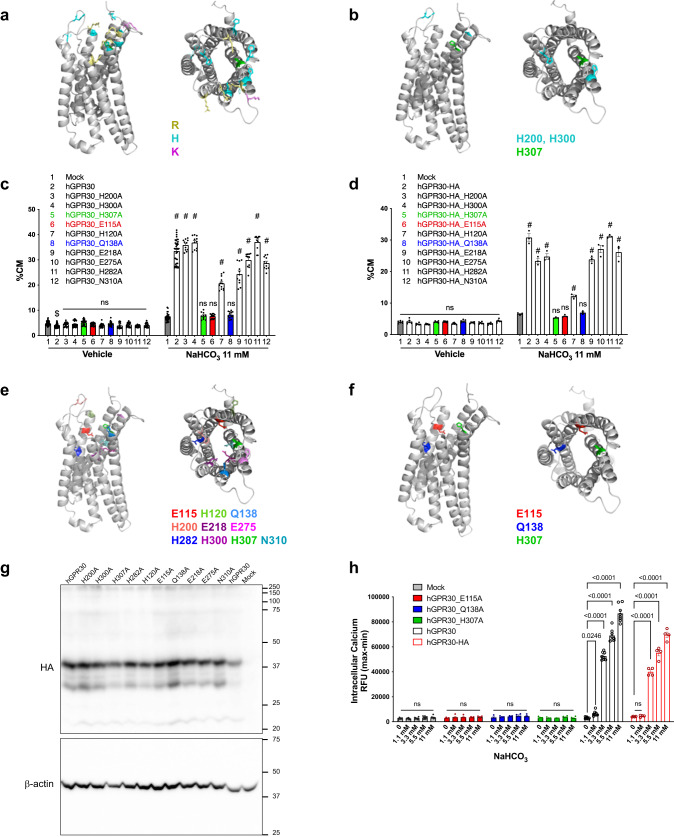
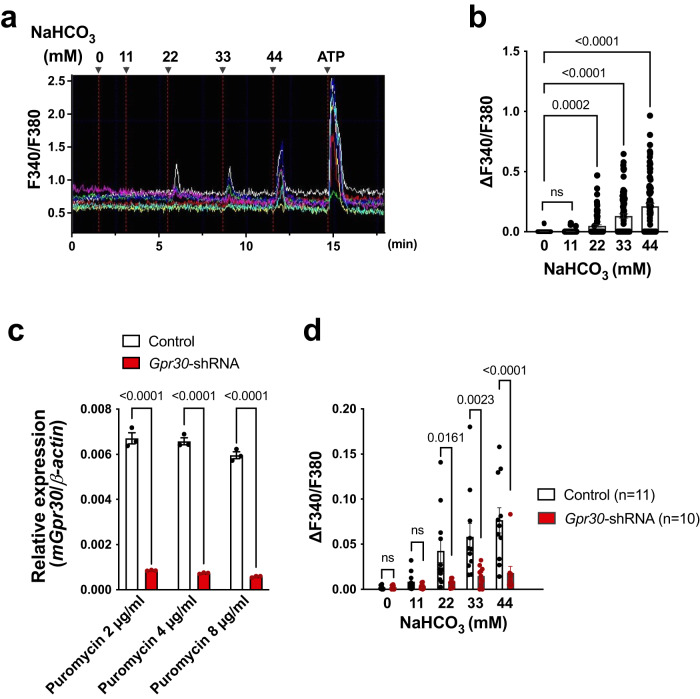
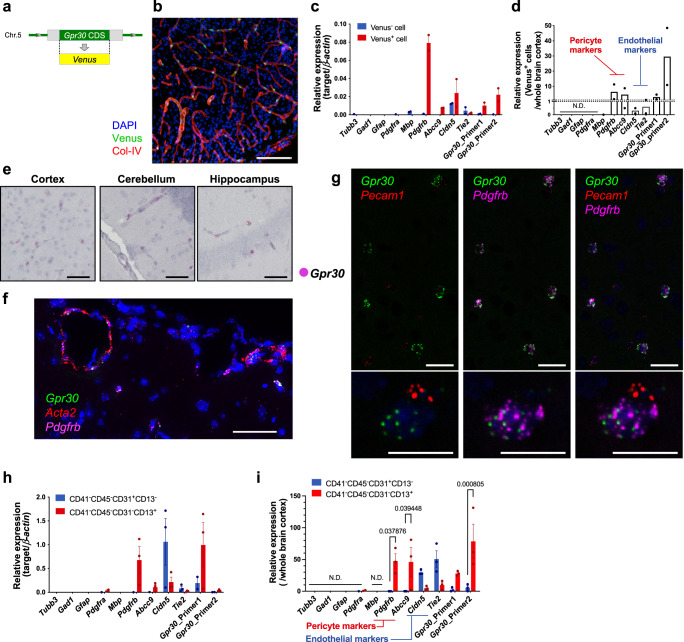
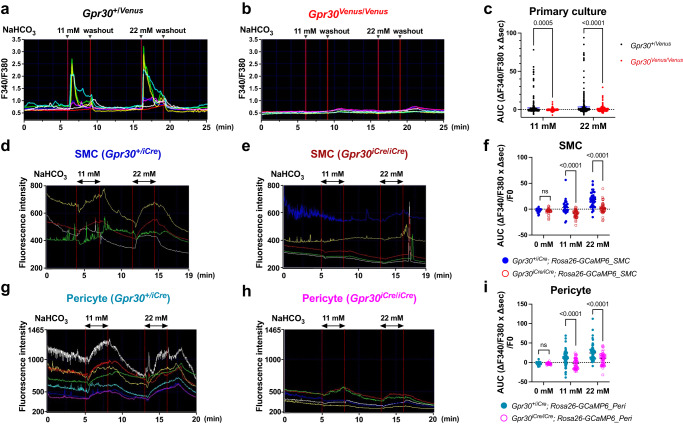
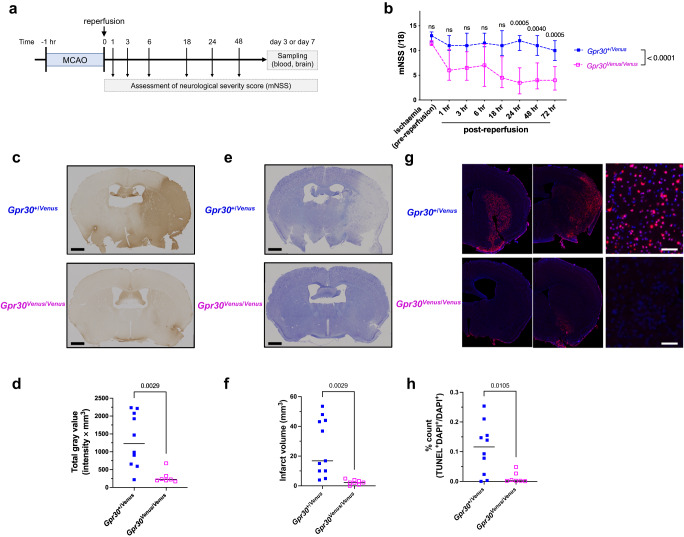
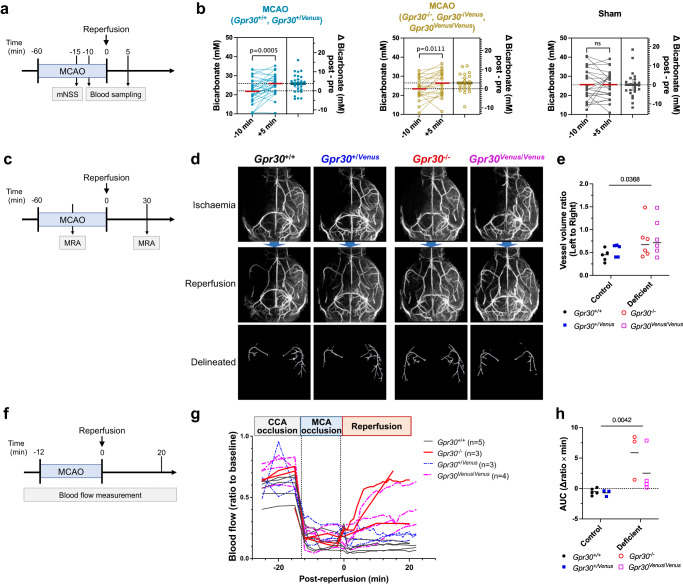
Homoeostatic regulation of the acid-base balance is essential for cellular functional integrity. However, little is known about the molecular mechanism through which the acid-base balance regulates cellular responses. Here, we report that bicarbonate ions activate a G protein-coupled receptor (GPCR), i.e., GPR30, which leads to Gq-coupled calcium responses. Gpr30-Venus knock-in mice reveal predominant expression of GPR30 in brain mural cells. Primary culture and fresh isolation of brain mural cells demonstrate bicarbonate-induced, GPR30-dependent calcium responses. GPR30-deficient male mice are protected against ischemia-reperfusion injury by a rapid blood flow recovery. Collectively, we identify a bicarbonate-sensing GPCR in brain mural cells that regulates blood flow and ischemia-reperfusion injury. Our results provide a perspective on the modulation of GPR30 signalling in the development of innovative therapies for ischaemic stroke. Moreover, our findings provide perspectives on acid/base sensing GPCRs, concomitantly modulating cellular responses depending on fluctuating ion concentrations under the acid-base homoeostasis.


Conflict of interest statement

The authors declare no competing interests.

Figures

Fig. 1
Fig. 1. Physiological concentration of bicarbonate ions activate GPR30 in vitro.
a–f Calcium mobilisation assay in Fluo-8-loaded MCF-7 (MCF-GPR30, a–e) and HEK293 (HEK-GPR30, f) cells stably expressing human GPR30 (hGPR30). The increase in the intracellular calcium level was evaluated by maximum relative fluorescence units (RFU) minus minimum RFU (max − min). ATP activates endogenous purinergic receptors and serves as a positive control. a Cells treated with vehicle, oestradiol (E2, 10−11–10−7 M), aldosterone (10−11–10−7 M), and ATP (10−8–10−4 M). b Cells treated with vehicle, Dulbecco’s modified Eagle’s medium (DMEM), and ATP (25 µM). c MCF-GPR30 cells were treated with the mixed inorganic solution at various pH values, Minimum Essential Medium (MEM), and DMEM. d The depletion of sodium bicarbonate from the mixed inorganic solution abolished the increase in intracellular calcium levels in MCF-GPR30 cells. e, f Sodium bicarbonate and potassium bicarbonate, but not potassium chloride, increased intracellular calcium levels in MCF-GPR30 (e) and HEK-GPR30 (f) cells in a dose-dependent manner. Statistical analysis: two-tailed unpaired t-test with Dunnett’s correction (a) or Bonferroni’s correction (e and f) after two-way ANOVA. Two-tailed unpaired t-test with Holm-Šídák’s correction (bd). Data are presented as mean values ± SEM. P values are shown if significant. ns indicates no significant difference. Source data are provided as a Source Data file.
Fig. 2
Fig. 2. Bicarbonate ions activate GPR30 signalling through the Gq family of G proteins.
a TGFα shedding assay using HEK293 cells devoid of Gαq/11/12/13 and transfected with the indicated subtypes of Gα proteins. Blue and magenta bars indicate Gαi and Gαq family candidates, respectively. b, c cAMP assay using HEK293 cells transiently (b) and stably (c) expressing hGPR30. Sodium bicarbonate did not inhibit forskolin (FSK)-dependent cAMP production in either cell line. d Calcium mobilisation assay using Fluo-8-loaded HEK-GPR30. The cells were treated with vehicle, 3.3 mM, and 11 mM NaHCO3. Bicarbonate-induced intracellular calcium increase was completely abolished by the Gαq/11/14 inhibitor YM-254890 (YM, 1 µM, 45 min) but not by pertussis toxin (PTX, 100 ng/ml, 16 h). e, f HEK293 cells transiently expressing hGPR30 were pretreated with YM-254890 (e) or PTX (f) and then treated with 11 mM NaHCO3 for the indicated periods. β-actin served as the loading control. g GPR30-dependent phosphorylation of ERK1/2 was evaluated using western blotting. HEK293 cells transiently expressing hGPR30 were treated with vehicle, 11 mM NaHCO3, or 100 nM E2 and harvested at 15 and 30 min after stimulation. β-actin serves as a loading control. h, i GPR30-dependent accumulation of inositol phosphates. HEK293 cells transiently expressing hGPR30 (h) and MCF-mGPR30 cells (i) were treated with indicated sodium bicarbonate concentrations. Nonlinear regression (four parameters) was performed. The EC50 values of sodium bicarbonate were 11.40 mM (h) and 12.20 mM (i). Statistical analysis: two-tailed unpaired t-test with Bonferroni’s correction after two-way ANOVA (ad). Data are presented as mean values ± SEM. P values are shown if significant. ns indicates no significant difference. Source data are provided as a Source Data file.
Fig. 3
Fig. 3. Identification of amino acid residues essential for GPR30 activation by bicarbonate.
a, b The predicted model of human GRP30 was generated based on the active conformation of CC chemokine receptor 5 (PDB:707 F, https://www.rcsb.org/structure/7O7F) in combination with other similar coordinates obtained from GPCRdb (https://gpcrdb.org/). The candidate residues for bicarbonate coordination were selected based on their side chain properties (e.g. positively charged residues: Arg (R), His (H), and Lys (K)) (a) and their conservation across animals (b) and mapped on the model structure. c, d TGFα shedding assay using HEK293 cells transfected with hGPR30 (c) or HA-tagged hGPR30 (d). The mutants H307A, E115A, and Q138A are highlighted in green, red, and blue, respectively. e The candidate residues analysed in our study were mapped on the model structure. f Three residues identified as important for bicarbonate-dependent activation were mapped on the model structure. g Western blotting analysis for HA-tagged hGPR30 mutants (upper panel) and β-actin control (lower panel). h Calcium mobilisation assay using HEK293 cells stably expressing three mutants (E115A, Q139A, and H307A) of hGPR30. Statistical analysis: $p < 0.05, #p < 0.0001 compared to mock cells using two-tailed unpaired t-test with Bonferroni’s correction after two-way ANOVA (c, d). Two-tailed unpaired t-test with Bonferroni’s correction after two-way ANOVA (h). Data are presented as mean values ± SEM. P values are shown if significant. ns indicates no significant difference. Source data are provided as a Source Data file.
Fig. 4
Fig. 4. Endogenous GPR30 is activated by bicarbonate ions.
Calcium mobilisation by sodium bicarbonate in Fura-2-loaded mouse myoblast C2C12 endogenously expressing GPR30. a, b C2C12 cells (n = 89 cells in one experiment) were stimulated with the indicated concentrations of sodium bicarbonate and 100 µM ATP. Representative image (a) and quantification (b). c Knockdown efficiency (87–90%) of Gpr30 in puromycin (2–8 µg/ml)-resistant stable C2C12 cells was assessed using quantitative RT-PCR. d Puromycin (4 µg/ml)-resistant C2C12 cells stably expressing the control or Gpr30-shRNA were stimulated with the indicated concentrations of sodium bicarbonate. Statistical analysis: two-tailed paired t-test with Bonferroni’s correction after repeated measures one-way ANOVA (b) or two-tailed unpaired t-test with Bonferroni’s correction after two-way ANOVA (c, d). Data are presented as mean values ± SEM. P values are shown if significant. ns indicates no significant difference. Source data are provided as a Source Data file.
Fig. 5
Fig. 5. GPR30 is expressed in brain mural cells.
a Design of the Gpr30-Venus-KI construct. The coding sequence of Gpr30 was replaced in frame with that of Venus. b Confocal microscopy image of a heterozygous Gpr30-Venus-KI (Gpr30+/Venus) mouse brain. Slices (50 µm) of the brains were stained with an antibody for collagen type IV (Col-IV) and DAPI. Scale bars, 100 µm. c, d Quantitative RT-PCR analyses of marker genes for neurons, astrocytes, oligodendrocytes, oligodendrocyte progenitor cells, pericytes, and endothelial cells. Relative expression levels of the genes in Venus+ cells compared with those in the whole brain cortex are shown in (d). e In situ hybridisation analyses of brain sections from wild-type (Gpr30+/+) mice. Gpr30 mRNA is visualised as magenta dots. Scale bars, 50 µm. f Visualisation of Gpr30 (green), the vascular smooth muscle cell (SMC) marker Acta2 (red), and the mural cell marker Pdgfrb (magenta) using multiple in situ hybridisation. Scale bar, 50 µm. g Visualisation of Gpr30 (green), endothelial marker Pecam1 (red), and pericyte marker Pdgfrb (magenta) using multiple in situ hybridisation. Scale bars, 10 µm. h, i Quantitative RT-PCR analyses of the marker genes for neurons, astrocytes, oligodendrocytes, oligodendrocyte progenitor cells, pericytes, and endothelial cells. CD41CD45CD31+CD13 and CD41CD45CD31CD13+ microvascular cells were isolated from the brain cortex of Gpr30+/+ mice. Relative expression levels of the genes compared with those in the whole brain cortex are shown in (i). Statistical analysis: two-tailed unpaired t-test with Holm-Šídák’s correction (i). Data are presented as mean values ± SEM. P values are shown if significant. N.D. indicates not detected. Source data are provided as a Source Data file.
Fig. 6
Fig. 6. GPR30 expressed in brain mural cells is activated by bicarbonate.
ac Calcium mobilisation assay for endogenous GPR30 in primary culture. The primary culture of Venus-positive cells harvested from the brain cortex of Gpr30-heterozygous (a, Gpr30+/Venus) and Gpr30-null (b, Gpr30Venus/Venus) mice were subjected to calcium imaging. c Quantification of a) and b) as area under the curve. d–i Calcium mobilisation assay for freshly isolated SMCs (df) and pericytes (g–i). Freshly isolated mCherry-positive cells harvested from the cerebral arteries (d, e) and cortex (g, h) of Gpr30-heterozygous (d, g, Gpr30+/iCre; Rosa26-GCaMP6) and Gpr30-null (e, h, Gpr30iCre/iCre; Rosa26-GCaMP6) mice were subjected to calcium imaging. f, i Quantification of d and e, g and h, as area under the curve, respectively. Statistical analysis: two-tailed unpaired t-test with Bonferroni’s correction after two-way ANOVA (c, f, i). Data are presented as mean values ± SEM. P values are shown if significant. ns indicates no significant difference. Source data are provided as a Source Data file.
Fig. 7
Fig. 7. GPR30 deficiency protects against ischaemia-reperfusion injury after transient middle cerebral artery occlusion.
a Experimental design of a transient middle cerebral artery occlusion (MCAO) model. b Modified Neurological Severity Score (mNSS) evaluated over time after MCAO. c, d Evaluation of the blood–brain barrier disruption. Representative images (c) and quantification (d) of IgG staining of whole brain sections 3 days after MCAO. Scale bars, 1 mm. e, f Evaluation of infarct volume. Representative images (e) and quantification (f) of cresyl violet staining of whole brain sections 3 days after MCAO. Scale bars, 1 mm. g, h Evaluation of apoptosis using TUNEL staining of whole brain sections 3 days after MCAO. Representative images (g) and quantification (h) of hemibrain sections 3 days after MCAO. The ratio of TUNEL-positive nuclei to total nuclei was calculated on hemibrain sections. TUNEL-positive apoptotic cells were scarcely detectable in GPR30-deficient (Gpr30Venus/Venus) mice. Scale bars, 50 µm. Statistical analysis: b two-tailed mixed-effects analysis with Bonferroni’s multiple comparison correction. Data are presented as the median ± interquartile range. d, f, h two-tailed unpaired t-test. Data are presented as dot plots with the median. P values are shown if significant. ns indicates no significant difference. Source data are provided as a Source Data file.
Fig. 8
Fig. 8. Rapid recovery of cerebral blood flow in the MCA region upon reperfusion in Gpr30-deficient mice.
a, b Measurement of serum concentration of bicarbonate ions during ischaemia and reperfusion. a Experimental design. The modified Neurological Severity Score (mNSS) was evaluated at 45 min of MCAO, and blood was collected before (−10 min) and after ( + 5 min) reperfusion. b Changes in serum bicarbonate levels in Gpr30+/+ and Gpr30+/Venus (left), Gpr30−/−, Gpr30−/Venus, and Gpr30Venus/Venus (middle), and sham-operated (right) mice. A set of data collected at pre- and post-reperfusion from the same mouse are connected with a line (left box). The difference in serum bicarbonate concentration (Δbicarbonate (mM) post − pre) presented as dot plots with mean (right box). ce Magnetic resonance angiography (MRA) analysis before and after reperfusion. c Experimental design. d Maximal intensity projection images before (top) and after (middle) reperfusion. Delineated MCA and branches after reperfusion are shown (bottom). e Vessel volume of the left MCA and its branches (reperfusion side) as a ratio to that of the right (control side). fh Measurement of cerebral blood flow using laser Doppler flowmetry. f Experimental design. g Normalised blood flow as a ratio to the basal blood flow. h Area under the curve of the blood flow from 0 to 20 min during the reperfusion phase. Statistical analysis: b two-tailed paired t-test. e, h the main effect in two-way ANOVA. Data are presented as dot plots with median. P values are shown if significant. ns indicates no significant difference. Source data are provided as a Source Data file.

References

    1. Brinkman, J. E. & Sharma, S. Physiology, metabolic alkalosis. (StatPearls Publishing, 2022). - PubMed
    1. Behrendorff N, Floetenmeyer M, Schwiening C, Thorn P. Protons released during pancreatic acinar cell secretion acidify the lumen and contribute to pancreatitis in mice. Gastroenterology. 2010;139:1711–1720. doi: 10.1053/j.gastro.2010.07.051. - DOI - PubMed
    1. Funato Y, et al. The oncogenic PRL protein causes acid addiction of cells by stimulating lysosomal exocytosis. Dev. Cell. 2020;55:387–397. doi: 10.1016/j.devcel.2020.08.009. - DOI - PubMed
    1. Inserte J, et al. High-fat diet improves tolerance to myocardial ischemia by delaying normalization of intracellular PH at reperfusion. J. Mol. Cell. Cardiol. 2019;133:164–173. doi: 10.1016/j.yjmcc.2019.06.001. - DOI - PubMed
    1. Kelmanson IV, et al. In vivo dynamics of acidosis and oxidative stress in the acute phase of an ischemic stroke in a rodent model. Redox Biol. 2021;48:102178. doi: 10.1016/j.redox.2021.102178. - DOI - PMC - PubMed