. 2024 Feb 27;15(1):1758.
doi: 10.1038/s41467-024-45933-5.

SNUPN deficiency causes a recessive muscular dystrophy due to RNA mis-splicing and ECM dysregulation

Marwan Nashabat #  1 Nasrinsadat Nabavizadeh #  1 Hilal Pırıl Saraçoğlu #  1 Burak Sarıbaş  1 Şahin Avcı  2 Esra Börklü  2 Emmanuel Beillard  3 Elanur Yılmaz  1 Seyide Ecesu Uygur  1 Cavit Kerem Kayhan  4   5 Luca Bosco  6   7 Zeynep Bengi Eren  1 Katharina Steindl  8 Manuela Friederike Richter  9 Guney Bademci  10 Anita Rauch  8   11   12 Zohreh Fattahi  13   14 Maria Lucia Valentino  15   16 Anne M Connolly  17 Angela Bahr  8 Laura Viola  18 Anke Katharina Bergmann  19 Maria Eugenia Rocha  20 LeShon Peart  10 Derly Liseth Castro-Rojas  21 Eva Bültmann  22 Suliman Khan  20 Miriam Liliana Giarrana  23 Raluca Ioana Teleanu  24   25 Joanna Michelle Gonzalez  10 Antonella Pini  26 Ines Sophie Schädlich  27 Katharina Vill  28   29 Melanie Brugger  29 Stephan Zuchner  10   30 Andreia Pinto  20 Sandra Donkervoort  31 Stephanie Ann Bivona  10 Anca Riza  32   33 Undiagnosed Diseases NetworkIoana Streata  32   33 Dieter Gläser  34 Carolina Baquero-Montoya  35 Natalia Garcia-Restrepo  36 Urania Kotzaeridou  37 Theresa Brunet  28   29 Diana Anamaria Epure  24 Aida Bertoli-Avella  20 Ariana Kariminejad  14 Mustafa Tekin  10   30 Sandra von Hardenberg  19 Carsten G Bönnemann  31 Georg M Stettner  38 Ginevra Zanni  6 Hülya Kayserili  2   39 Zehra Piraye Oflazer  40 Nathalie Escande-Beillard  41   42
Collaborators, Affiliations

SNUPN deficiency causes a recessive muscular dystrophy due to RNA mis-splicing and ECM dysregulation

Marwan Nashabat et al. Nat Commun. .

Abstract

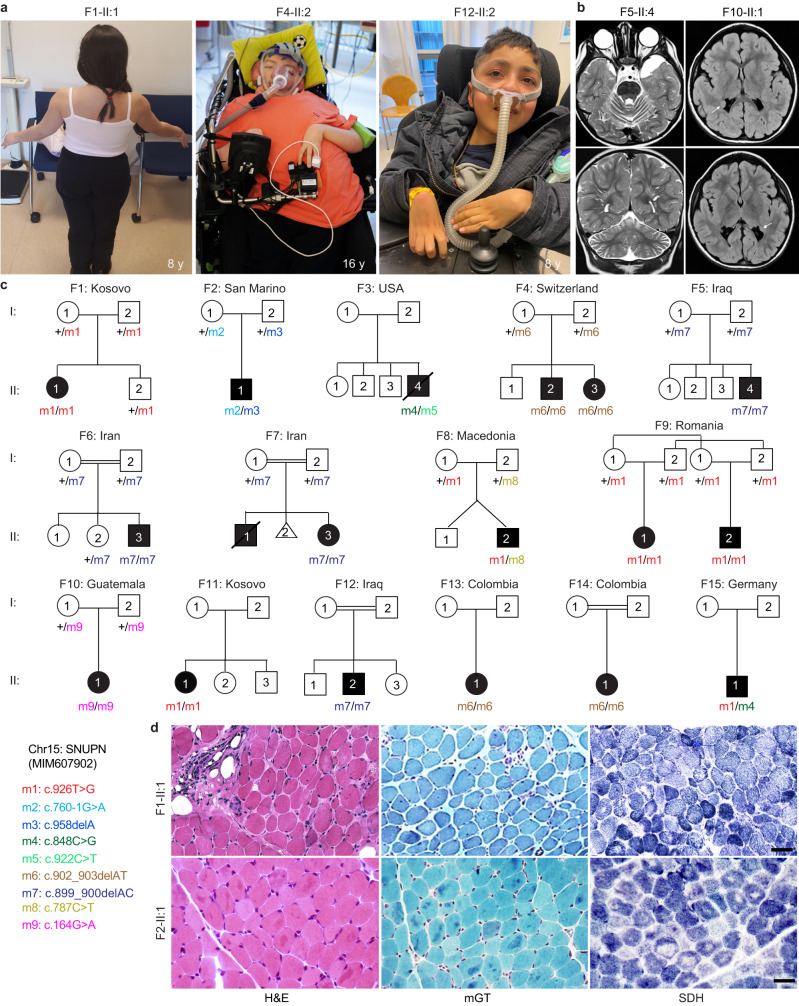
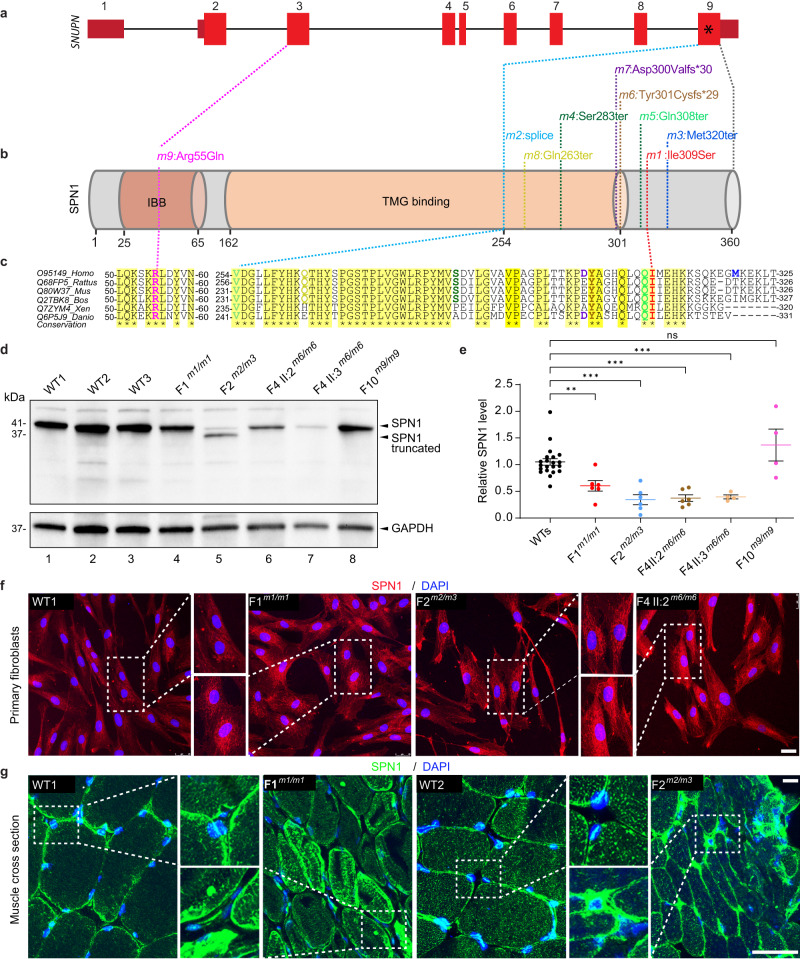
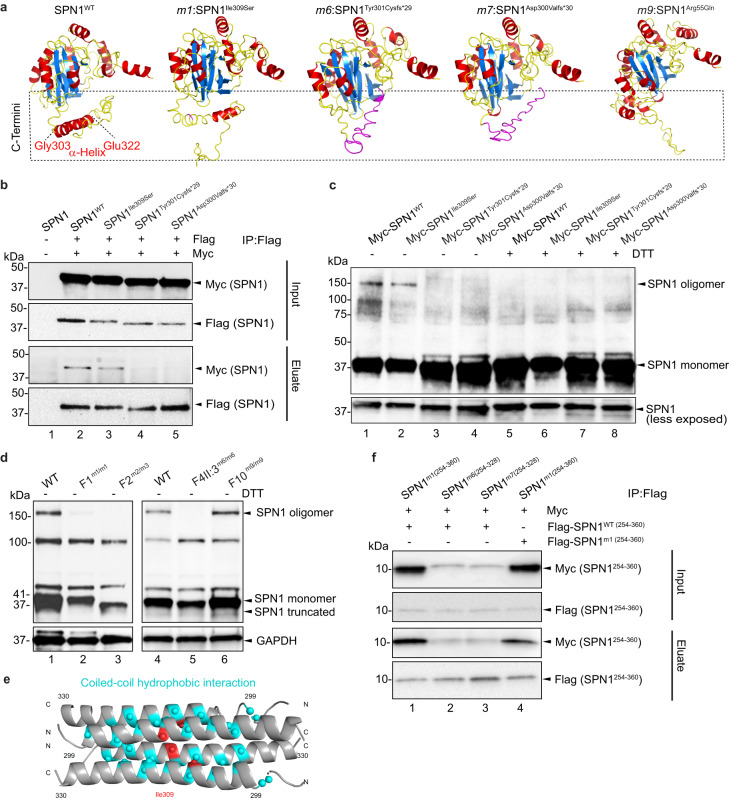
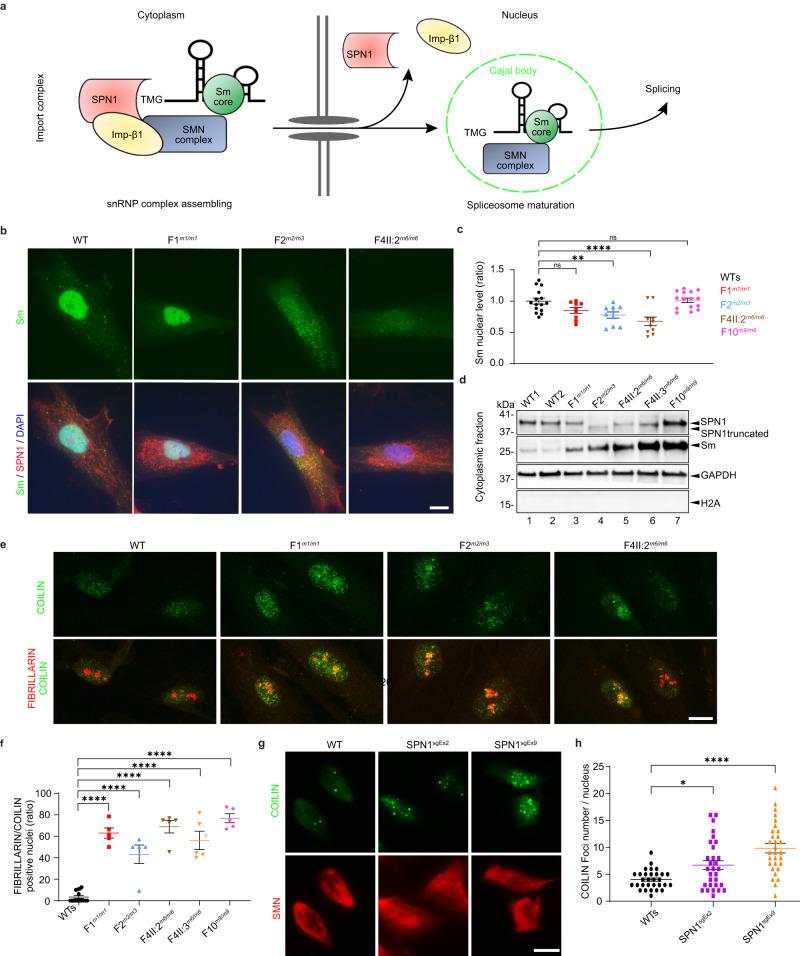
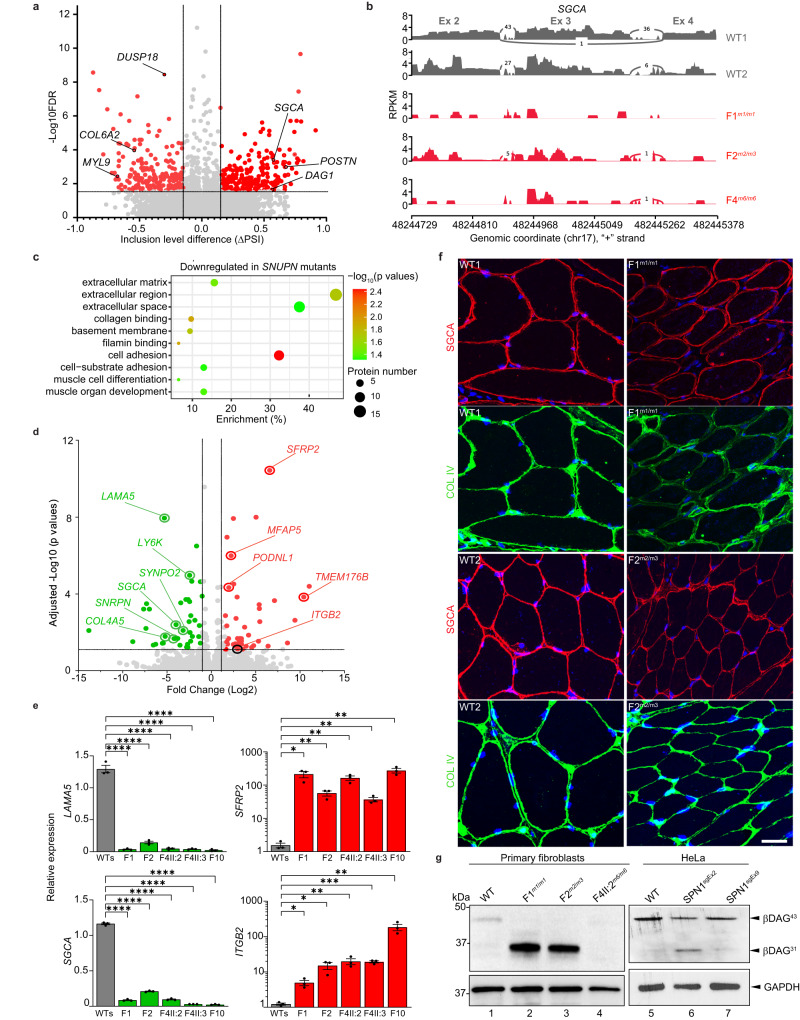
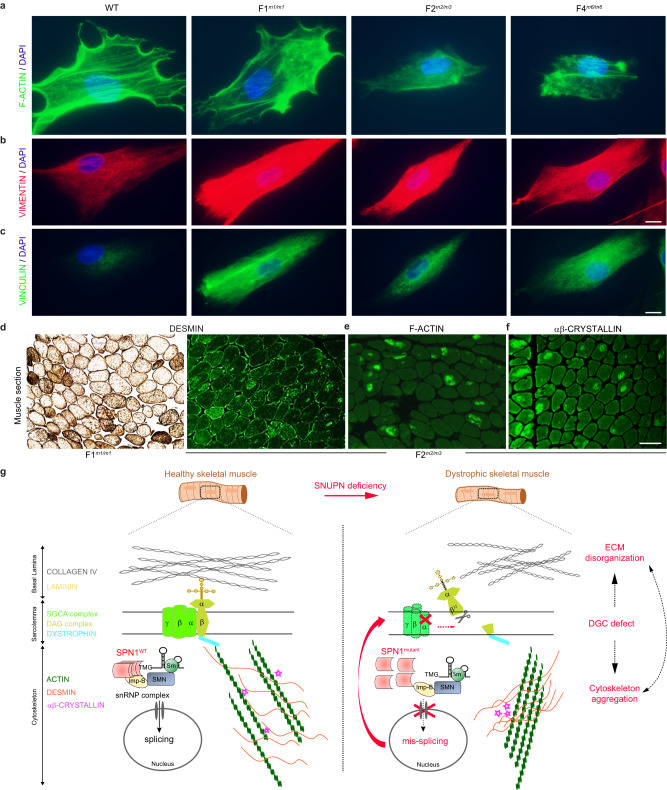
SNURPORTIN-1, encoded by SNUPN, plays a central role in the nuclear import of spliceosomal small nuclear ribonucleoproteins. However, its physiological function remains unexplored. In this study, we investigate 18 children from 15 unrelated families who present with atypical muscular dystrophy and neurological defects. Nine hypomorphic SNUPN biallelic variants, predominantly clustered in the last coding exon, are ascertained to segregate with the disease. We demonstrate that mutant SPN1 failed to oligomerize leading to cytoplasmic aggregation in patients' primary fibroblasts and CRISPR/Cas9-mediated mutant cell lines. Additionally, mutant nuclei exhibit defective spliceosomal maturation and breakdown of Cajal bodies. Transcriptome analyses reveal splicing and mRNA expression dysregulation, particularly in sarcolemmal components, causing disruption of cytoskeletal organization in mutant cells and patient muscle tissues. Our findings establish SNUPN deficiency as the genetic etiology of a previously unrecognized subtype of muscular dystrophy and provide robust evidence of the role of SPN1 for muscle homeostasis.


Conflict of interest statement

M.E.R., S.K., A.P. and A.B.A. are employed by and receive a salary from Centogene AG. The remaining authors declare no competing interests.

Figures

Fig. 1
Fig. 1. Identification of 18 patients diagnosed with muscular dystrophy carrying biallelic SNUPN variants.
a Pictures of affected individuals: An 8-year-old affected girl from family F1 (F1-II:1) displaying an abnormal posture with left dissymmetry and difficulties in raising her arms. Affected sibling from family 4 (F4-II:2; 16-year-old) and family 12 (F12-II:2; 8-year-old) are permanently bound to wheelchair and artificial respiratory devices exhibiting severe disability. b Brain magnetic resonance imaging (MRI) of affected individuals from family 5 (F5-II:4; 22-month-old) and family 10 (F10-II:1, 3-year-old) revealed cerebellar atrophy and white matter hyperintensities (white arrows), respectively. c Pedigree of fifteen families segregating autosomal recessive muscular dystrophy. Double lines indicate a consanguineous marriage. Filled black symbols and crossed symbols indicate affected and deceased individuals, respectively while triangle indicates miscarriage. Compound heterozygous variants are presented based on their parental origin and SNUPN variant coordinates are provided. d Immunohistochemistry of skeletal muscle from patient F1-II:1 and F2-II:1: Hematoxylin and eosin (H&E) and modified Gomori Trichrome (mGT) images revealed muscle fibers with an atrophic appearance, displaying heterogeneity in size and shape. Additionally, some fibers exhibited a centralized nucleus and intense cytoplasmic staining. Succinate dehydrogenase (SDH) staining demonstrated a reduction in oxidative enzymatic activity, as indicated by reduced staining, in numerous muscle fibers in both patients. Scale bar, 100 μm. The images shown are representative of stainings on single muscle biopsy in each indicated patient. No independent replicates were performed.
Fig. 2
Fig. 2. The C-terminus of SPN1 is essential for cellular localization.
a Schematic diagram depicting the genomic structure of SNUPN in humans which consists of nine exons. b SPN1 protein contains two conserved domains: Importin β binding domain (IBB) (dark brown) and trimethylguanosine (m3G)-cap-binding domain (TMG binding) (light brown). Position of the nine pathogenic germline variants is indicated in both SNUPN DNA and SPN1 protein. Nearly all pathogenic variants (m1-m8) are clustered in the C-terminus region between residues 254–320 and only the m9 pathogenic variant is located in the N-terminus. c Multiple sequence alignment of SPN1 protein from different species. Yellow shading indicates fully conserved regions where the pathogenic variants are located. d Immunoblot analysis showing significant decrease of endogenous SPN1 in patients F1m1/m1, F2m2/m3, F4-II:2m6/m6, and F4-II:3m6/m6 compared to WTs (n = 3) fibroblasts. Note that the germline compound heterozygous pathogenic variants F2m2/m3 created two truncated forms of SPN1. F10m9/m9 shows a mild but not significant increase of SPN1. GAPDH served as loading control. e Scatter plot showing quantification analysis of SPN1 protein level in five patients compared to three WTs fibroblasts lines using independent immunoblots. n = 18 (WTs), 6 (F1m1/m1, F2m2/m3, F4-II:2m6/m6), 4 (F4-II:3m6/m6, F10m9/m9) immunoblots. Each dot represents one quantification. Fold change relative to WTs is plotted as mean ± SEM. ns nonsignificant; **P = 0.0076; ***P = 0.0007 (Ordinary one-way ANOVA and two-tailed unpaired t-test). Source data are provided as a Source Data file. f Images of immunofluorescence showing endogenous SPN1 (red) accumulation around the nucleus in three patients’ fibroblast lines (F1m1/m1, F2m2/m3, and F4-II:2m6/m6) compared to WT. Nuclei were labeled with DAPI (blue). n = 3 independent stainings. Scale bar, 10 µm. g Images of immunofluorescence on muscle sections showing aggregation of SPN1 along the sarcolemma and within the sarcoplasm in mutant muscle sections (F1m1/m1 and F2m2/m3) compared to healthy WTs. n = 2 independent stainings. Scale bar, 50 µm.
Fig. 3
Fig. 3. Intact SPN1 C-terminus is required for its oligomerization.
a Comparison between the 3D structure predictions of SPN1 WT and m1, m6, m7, m9 pathogenic variants. Protein is shown colored based on the secondary structure, with alpha helices in red, beta sheets in blue, and loops in yellow. Mutated amino acids in m6 and m7 are shown in magenta. C-termini are indicated in the dotted box. b Co-immunoprecipitation (co-IP) assay performed in HEK293T cells co-transfected with Flag- and Myc-tagged SPN1 using Flag beads. Input and eluate samples blotted with anti-Myc or anti-Flag antibodies reveal SPN1 interaction between SPN1WT (Lane 2) and SPN1Ile309Ser (Lane 3) but not with Flag-SPN1Tyr301Cysfs*29 and Flag-SPN1Asp300Valfs*30 (Lanes 4 and 5). n = 3 independent experiments. c Immunoblot analysis of HeLa cells cytoplasmic fractions transfected with WT or mutant Myc-tagged SPN1 constructs. In absence of DTT, two bands at 41 and 150 kDa were observed in samples transfected with Myc-SPN1WT and Myc-SPN1Ile309Ser whereas bands at 150 kDa disappeared totally in lysate transfected with Myc-SPN1Tyr301Cysfs*29, and Myc-SPN1Asp300Valfs*30 constructs. Upon treatment with DTT, higher bands were not detected in either samples. n = 2 independent experiments. d Immunoblot analysis of endogenous SPN1 in cytoplasmic fractions of fibroblast showing SPN1 specific bands at 41 kDa and 150 kDa. The upper band was unchanged in F10m9/m9, very faint in F1m1/m1, and completely disappeared in F2m2/m3 and F4-II-2m6/m6 samples. GAPDH served as loading control. n = 3 independent experiments. e Model of tetramer formation with C-terminal region (residues 299-330) based on AlphaFold2 Colab and Socket2 coiled-coil predictions. Ile309 is highlighted in red and residues predicted to form hydrophobic interactions in blue. f Co-IP assay using Flag beads and performed with HEK293T cells co-transfected with Flag- and Myc-tagged SPN1 C-termini fragments. Input and eluate samples blotted with anti-Myc or anti-Flag antibodies reveal interaction between Myc-SPN1WT(254-360) and Flag-SPN1m1(254-360) (Lane 1) but not with Flag-SPN1m6(254-328) and Flag-SPN1m7(254-328) (Lanes 2 and 3). Self-interaction of SPN1m1(254-360) is reduced (Lane 4). n = 3 independent experiments. Source data are provided as a Source Data file.
Fig. 4
Fig. 4. SPN1 C-terminus is necessary for proper spliceosomal maturation.
a Schematic of snRNPs biogenesis and maturation pathways. In cytoplasm, snRNP occurs in three steps: (1) snRNP core formation, (2) trimethylguanosine m3G cap (TMG) addition, (3) association of SPN1 with TMG, Imp-β1, and SMN complex. In nucleus, the complex releases the snRNP-SMN complex to Cajal bodies to complete spliceosome maturation. b Immunofluorescence images of fibroblasts showing reduced nuclear Sm (green) in F2m2/m3 and F4-II:2m6/m6. SPN1 (red) aggregation around the nucleus is evident in all the mutants compared to WT. DAPI labeled nuclei (blue). Scale bar, 10 µm. c Quantitative analysis showing significant decrease of nuclear Sm in F2m2/m3, F4m6/m6 compared to two WT (WTs) fibroblast lines. Note that mild reduction in F1m1/m1 is not significant. n = 15 (WTs), 9 (F1m1/m1), 10 (F2m2/m3), 10 (F4-II:2m6/m6), 15 (F10m9/m9) cells. Fold change relative to WTs is plotted as mean ± SEM. ns nonsignificant; **P = 0.0088; ****P = 0.0001 (two-tailed unpaired t-test). d Immunoblot analysis of fibroblast cytoplasmic fractions showing increased Sm in all patients (Lanes 3-7) compared to WTs samples (Lanes 1–2). GAPDH and H2A served as cytoplasmic and nuclear markers, respectively. n = 3 independent stainings. e Immunofluorescence images showing co-localization of COILIN (green) and FIBRILLARIN (red) in F1m1/m1, F2m2/m3, F4-II:2m6/m6 compared to WT fibroblasts. Scale bar, 10 µm. f Scatter plot showing ratio of positive nuclei stained with COILIN and FIBRILLARIN in fibroblasts from five patients compared to two WT. n = 59 (WTs), 53 (F1m1/m1), 36 (F2m2/m3), 55 (F4-II:2m6/m6), 44 (F4-II:3m6/m6), 42 (F10m9/m9) total nuclei. Each dot represents the average from one image (n = 5). Fold change relative to WTs plotted as mean ± SEM. ****P < 0.0001 (two-tailed unpaired t-test). g Immunofluorescence images showing increased number of COILIN (green) foci in SPN1 HeLa mutant lines compared to WT. h Scatter plot representing quantification of COILIN foci in SPN1 HeLa mutant lines compared to WT. Each dot represents a cell (n = 30). Fold change relative to WTs plotted as mean ± SEM. *P = 0.0162; ****P < 0.0001 (two-tailed unpaired t-test). Source data are provided as a Source Data file.
Fig. 5
Fig. 5. SPN1 deficiency leads to dysregulation of ECM components.
a Volcano plot showing the alternative splicing analysis comparing two WT (WT1 and WT2) and three mutants (F1m1/m1, F2m2/m3, and F4m6/m6) fibroblasts. The -Log10 (FDR) (False Discovery Rate) is plotted on the y-axis, whereas the x-axis represents the exon inclusion level (ΔPSI) where PSI = Percent Splicing Inclusion. ΔPSI is the difference between PSI patient average compared to WTs. Likelihood ratio test was used b Sashimi plot showing significant SGCA exon 3 disruption in three mutant lines. c Bubble plot illustrating gene ontology (GO) enrichment analyses of downregulated genes in SNUPN mutant fibroblasts compared to WTs. Circle size indicates the number of differentially expressed genes enriched in each pathway. Circle color represents the enrichment significance with red showing high statistical significance (Wald test). d Volcano plot displaying genes significantly upregulated (green) and downregulated (red) in three mutant fibroblasts compared to two WTs (Wald test). e RT-qPCR analysis on four dysregulated genes identified by RNA-seq. Fold change relative to 3 WT (WTs) is plotted as mean ± SEM n = 3 biological replicates. LAMA5 and SGCA: ****P < 0.0001; SFRP2: *P = 0.01; **P = 0.005 (F2); **P = 0.003 (F4-II:2, F4-II:3 and F10); ITGB2: *P = 0.012 (F1); *P = 0.016 (F2); **P = 0.008 (F4-II:2); ***P = 0.0002 (F4-II:3); **P = 0.009 (F10) with two-tailed unpaired t-test. f Immunofluorescence staining showing the amount of endogenous COL IV (green) and SGCA (red) in F1m1/m1 and F2m2/m3 muscle sections compared to WTs. DAPI labeled nuclei (blue). n = 2 independent stainings. Scale bar, 50 µm. g Immunoblot analysis of β-DAG (β-dystroglycan) using whole-cell lysates from fibroblasts (Lanes 1–4) and HeLa SPN1 mutant cell lines (Lanes 5–6). In fibroblasts, β-DAG43 is observed only in the WT sample, while its cleaved fragment (β-DAG31) is present in F1m1/m1 and F2m2/m3. β-DAG is completely absent in F4m6/m6. In HeLa cells, β-DAG43 is decreased in both mutants compared to WT, whereas the β-DAG31 is exclusively found in SPN1sgEx2. n = 2 independent experiments for each cell type. Source data are provided as a Source Data file.
Fig. 6
Fig. 6. SPN1 deficiency leads to dysregulation of ECM-associated key components.
ac Representative images of immunofluorescence stainings from WT and patients’ fibroblasts (F1m1/m1, F2m2/m3, and F4m6/m6) using cytoskeleton markers. n = 3 independent stainings for each marker. Scale bars, 20 µm. a Filamentous actin (F-ACTIN) labeled with Phalloidin (green). b Anti-VIMENTIN (red). c Anti-VINCULIN (green). In the three mutants, filamentous actin (F-ACTIN) networks appeared disorganized and aggregated whereas VIMENTIN and VINCULIN stainings were more intense compared to WT cells. Nuclei are labeled with DAPI (blue). d Representative images of immunostaining on muscle sections from patients F1m1/m1 and F2m2/m3 showing aggregation of DESMIN in myofibers. n = 1. Scale bar, 100 µm. e, f Representative images of immunofluorescence on F2m2/m3 muscle section showing abnormal accumulation of F-ACTIN and ɑβ-CRYSTALLIN in myofibers. n = 1 staining. Scale bar, 100 µm. g Proposed schematic model of SPN1 role on ECM and cytoskeleton dynamics in muscle fibers. In healthy skeletal muscle, WT SPN1 homo-oligomers are expected to attach properly to the snRNP import complex and subsequently lead to normal splicing. In dystrophic skeletal muscle carrying hypomorphic SNUPN pathogenic variants, the conformational change and the inability of SPN1 mutants to self-oligomerize disorganize the snRNP import complex resulting in (1) aberrant splicing, (2) disassembly of DGC (SGCA & DAG) complexes, and finally (3) cytoskeleton aggregation (F-ACTIN, DESMIN and ɑβ-CRYSTALLIN) and ECM disorganization (COLLAGEN and LAMININ).

References

    1. Mercuri E, Muntoni F. Muscular dystrophies. Lancet. 2013;381:845–860. doi: 10.1016/S0140-6736(12)61897-2. - DOI - PubMed
    1. Mercuri E, Bönnemann CG, Muntoni F. Muscular dystrophies. Lancet. 2019;394:2025–2038. doi: 10.1016/S0140-6736(19)32910-1. - DOI - PubMed
    1. Thompson R, et al. Advances in the diagnosis of inherited neuromuscular diseases and implications for therapy development. Lancet Neurol. 2020;19:522–532. doi: 10.1016/S1474-4422(20)30028-4. - DOI - PubMed
    1. Cohen E, Bonne G, Rivier F, Hamroun D. The 2022 version of the gene table of neuromuscular disorders (nuclear genome) Neuromuscul. Disord. 2021;31:1313–1357. doi: 10.1016/j.nmd.2021.11.004. - DOI - PubMed
    1. Monaco AP, et al. Detection of deletions spanning the Duchenne muscular dystrophy locus using a tightly linked DNA segment. Nature. 1985;316:842–845. doi: 10.1038/316842a0. - DOI - PubMed