. 2024 Feb 27;15(1):1788.
doi: 10.1038/s41467-024-45942-4.

The emergence of circadian timekeeping in the intestine

Affiliations

The emergence of circadian timekeeping in the intestine

Kathyani Parasram et al. Nat Commun. .

Abstract

The circadian clock is a molecular timekeeper, present from cyanobacteria to mammals, that coordinates internal physiology with the external environment. The clock has a 24-h period however development proceeds with its own timing, raising the question of how these interact. Using the intestine of Drosophila melanogaster as a model for organ development, we track how and when the circadian clock emerges in specific cell types. We find that the circadian clock begins abruptly in the adult intestine and gradually synchronizes to the environment after intestinal development is complete. This delayed start occurs because individual cells at earlier stages lack the complete circadian clock gene network. As the intestine develops, the circadian clock is first consolidated in intestinal stem cells with changes in Ecdysone and Hnf4 signalling influencing the transcriptional activity of Clk/cyc to drive the expression of tim, Pdp1, and vri. In the mature intestine, stem cell lineage commitment transiently disrupts clock activity in differentiating progeny, mirroring early developmental clock-less transitions. Our data show that clock function and differentiation are incompatible and provide a paradigm for studying circadian clocks in development and stem cell lineages.


Conflict of interest statement

The authors declare no competing interests.

Figures

Fig. 1
Fig. 1. The circadian clock emerges in the adult intestine.
A The circadian clock comprises the transcriptional activators Clk/cyc and their repressors per/tim. The repressor vri and activator Pdp1 form a secondary feedback system and light is sensed through cry. B Drosophila development from egg through three larval instars, followed by pupation prior to eclosion as an adult. Images of the midgut from larva to adults shows dramatic growth and remodeling of the intestine, DAPI stains nuclei (black). All images shown at same scale (scale bar = 200 µm). “P” indicates posterior. C Schematic of the Clock Reporter showing binding of Clk/cyc to the minimal promoter of either tim (for the ClockTIM reporter) or per (ClockPER) located upstream of destabilized GFP (dGFP). D Images of larva, pupa, and adult show that ClockPER is expressed only in adult intestines (Myo1A>mCherry). The intestine is outlined in a dashed line (scale bar = 500 µm). Whole mount quantification of the number of flies expressing (E) ClockPER or (F) ClockTIM in the intestine throughout development. G Antibody staining showing that PER protein is only expressed in the adults and is localized to the nuclei in ClockTIM flies at ZT0 (Zeitgeber Time relative to photoperiod, ZT0=lights on, ZT12=lights off). Scale 10 µm. Histone marks nuclei. H The mRNA expression of circadian clock genes at ZT0 from 3rd instar larva to adults showing the circadian clock transcripts increase in adults. One-Way ANOVA p < 0.0001 Clk and vri, p = 0.0001 tim and Pdp1. Error bars indicate ±SEM. Each point represents one replicate (20 intestines). Representative images of two replicates. Full statistics are shown in Supplementary Information. Related to Supplementary Figs. 2–3. Source data are provided as a Source Data file. L1 1st Instar Larva.
Fig. 2
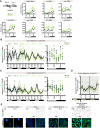
Fig. 2. Daily rhythms are established after three days of adulthood.
A Circadian clock genes are expressed in adults immediately after eclosion (day 1, shown in the schematic) but rhythms are stronger at day 4. For instance, amplitude of mRNA rhythm of Pdp1 increases, and cry timing changes, other genes similarly show differences as intestine matures. Line shows mean, day 1 is shown in a dark green dashed line, day 4 in a light green solid line. Error bars indicate ±SEM. Each point is the average of two replicates each consisting of 15–20 intestines, n = 2. Two-Way ANOVA Pdp1 p = 0.3867; vri p = 0.2637; cry p = 0.0270; tim p = 0.5207; per p = 0.2634; Clk p = 0.5399; cyc p = 0.5007. B Clk/cyc transcriptional activity in the ClockPER reporter shows daily rhythms are established robustly on day 4 with a peak around ZT0 and trough around ZT12. Cosinor fit analysis (right graph) shows arrhythmic activity on Day 1 (no cosinor curve can be fitted to the data) and 24-h rhythms on Day 4 shown in a light green solid line. Lines show mean. Error bars indicate ±SEM. Each point represents one intestine, n = 737 intestines over at least two independent replicates. C In the ClockTIM reporter rhythms show a similar trend but are noted earlier, from day 1, that phase shift to match those of ClockPER by day 4. Lines show mean, day 1 dark green dashed line, day 4 light green solid line. Error bars indicate ±SEM. Each point represents one intestine, n = 853 intestines over at least two independent replicates. Day 1 corresponds to the first light and dark cue after eclosion. D Clk/cyc activity when shifted to constant darkness prior to ZT0 on Day 4 shows free-running rhythms over the first two days in constant darkness. The vertical line separates the first and second days in constant darkness. One-Way ANOVA p < 0.0001. Lines show mean. Error bars indicate ±SEM. Each point represents one intestine, n = 198 intestines over two independent replicates. E Protein expression of per (PER-AID-eGFP) at ZT0 and ZT12 shows that there is no per protein expression in larva or pupa, but per is expressed in day 1 or day 4 adults with clear nuclear (ZT0) and cytoplasmic (ZT12) staining established by day 4. Scale 10 µm. DAPI marks nuclei. Representative images of two replicates. Full statistics are shown in Supplementary Information. Related to Supplementary Figs. 3–4. Source data are provided as a Source Data file.
Fig. 3
Fig. 3. Clock gene expression increases in ISCs and ECs during intestinal maturation.
scRNA-seq analysis of clock gene expression of the intestine of early pupa, day 1 immature adults, and day 7-8 mature adults showing (A) tSNE plots with 23 different cell populations over the integrated dataset. B Population changes are evident during three developmental stages with PupCs (green) disappearing from the pupal intestine, and ECs (dark blue) appearing in distinct clusters in the mature intestine. ISCs (aquamarine) are present at all stages, similar to EEs (light blue). For cluster assignments and markers see Supplementary Fig. 5A and Supplementary Data 4. C Multidimensional plots showing the changes in four highly expressed clock genes from early pupa to adult: tim (y-axis), cwo (x-axis), Pdp1 (color), vri (size of datapoint). Initially expression of all four genes in ISCs (first column of graphs) is low but increases during maturation. This pattern is also seen in ECs (third column). EBs and EEs do not show these increases, cells remain clustered together at low levels of expression of all four genes. D PupCs also show low clock gene expression. See Supplementary Information for correlation matrices of multidimensional plots. Related to Supplementary Fig. 5, Supplementary Data 1–4. ISC intestinal stem cell, EB enteroblast, EC enterocyte, EE enteroendocrine cell, PupC pupal cell.
Fig. 4
Fig. 4. Transcriptional analysis of intestinal clock development.
A SCENIC analysis of differentially expressed regulons that distinguish individual cell populations show clear changes in the transcriptional programs of different intestinal cell types (klu and Sox21a in ISCs, nub in ECs, tap in EEs). B Differential regulon expression focusing on the pupal-to-adult transition in ISCs shows that specific transcriptional pathways change during ISC development (gce/met, Pdp1, Stat92E are increased; EcR, GATA are decreased). Scaled AUC values are shown, ##g indicates the number of genes enriched in each regulon’s network. C The tSNE plot for early pupa and immature adult cells highlighting the ISC cluster used for SCENIC analysis, AUC values shown on a tSNE and in histograms showing population distributions based on regulon expression for the nuclear receptors gce and the clock gene Pdp1. Related to Supplementary Fig. 6 and Supplementary Data 4.
Fig. 5
Fig. 5. Hormonal regulators of intestinal clock emergence.
A Knockdown of nuclear receptors in ISC/EBs show that loss of hormone signaling transduction decreases Clk/cyc activity. Scale 500 µm. DAPI marks nuclei. One-Way ANOVA p < 0.0001. B Overexpression in ISC/EBs of candidates shows that Hnf4 and Hr78 upregulate Clk/cyc activity compared to control midguts. Scale 500 or 10 µm for whole gut and close-up images, respectively. DAPI marks nuclei. One-Way ANOVA p < 0.0001. C Knockdown of nuclear receptors in ECs shows loss of hormone signaling transduction also affects Clk/cyc activity in ECs. Scale 500 µm. DAPI marks nuclei. We also noticed that EC knockdown of ftz-f1, and ISC/EB overexpression of Eip78C, fewer flies eclosed indicating a developmental role for these genes. In all graphs: Lines show median and quartiles. One-Way ANOVA p < 0.0001, multiple comparison, p-value < 0.05 (significant groups are shown in maroon and marked with an asterisk) compared to the control (Luc shown in blue) are shown. Scale 500 µm. DAPI marks nuclei. Representative images of two replicates. Full statistics are shown in Supplementary Information. Related to Supplementary Fig. 6 and Supplementary Data 4–5. Source data are provided as a Source Data file.
Fig. 6
Fig. 6. The EC lineage reveals heterogeneity in clock activity during differentiation.
A A subset of clusters from the mature adult intestine (0,2,3,7,8,14) were assembled into a lineage from earliest cells (ISC = cluster 0) to differentiated ECs in pseudotime. See Supplementary Fig. 6B for more details. B Expression of a housekeeping gene, RpL32, shows it is expressed in all cell populations, whereas ISC-specific klu and EC-specific Amy-p are restricted to their respective populations. Mapping clock genes such as Pdp1 shows their expression in these lineage changes. C Graphs show cellular expression levels in this lineage of RpL32, compared to cell-specific genes (klu and Amy-p), and clock genes (Pdp1, tim, vri, cwo). RpL32 is expressed throughout, klu only in ISCs, Amy-p only in differentiating EBs and ECs. Clock genes show initially high expression in mature ISCs which lowers in the transient differentiating EBs, to increase again in the EC. Lines indicate median and quartiles. Kruskal-Wallis test, full statistics are shown in Supplementary Information. D Flp/out clones show a mixture of basally located GFP+ and GFP- small cells, suggesting that Clk/cyc activity is heterogeneous in either ISCs and/or their progeny. Arrowhead marks GFP+ cell, arrow marks GFP- cell. Scale bar 10 µm. DAPI marks nuclei. Additional clones are shown in Supplementary Fig. 6D, E. Using mCherry expression to mark (E) ISCs, (F) EBs, and (G) ECs, specifically, Clk/cyc activity (ClockPER) is present in ISCs, absent in EBs, and strongest in ECs. Outline indicates cell of interest marked with mCherry. Scale bar 10 µm. DAPI marks nuclei. An example of each mCherry+ cell is outlined. H Schematic summarizing the observed decrease in Clk/cyc activity and clock gene expression during differentiation. Representative images of two replicates. Related to Supplementary Fig. 6 and Supplementary Data 4.
Fig. 7
Fig. 7. Photoperiod and feeding synchronize the maturing intestinal circadian clock.
A ClockTIM flies that receive only water for the first three days after pupation show robust rhythmic Clk/cyc activity earlier: by day 3 rather than day 4, suggesting the absence of food more quickly synchronizes a rhythmic clock. Line shows mean. Error bars indicate ±SEM. Each point represents one intestine, n = 595 intestines over two independent replicates. One-Way ANOVA p < 0.0001. B ClockTIM;cry01 mutant flies that cannot sense photoperiod light display arrhythmic Clk/cyc transcriptional activity until day 4 when these are established, similar to controls. This suggests food in the absence of photoperiod can also synchronize a rhythmic clock. Line shows mean. Error bars indicate ±SEM. Each point represents one intestine, n = 570 intestines over two independent replicates. One-Way ANOVA p < 0.0001. C Alternating days of feeding and starving (water only) shows arrhythmic Clk/cyc activity whereas restricted feeding for 6 h a day in ClockTIM;cry01 mutants synchronizes intestinal Clk/cyc rhythms that peak ~6 h after feeding. Ad libitum measurements (control) from Fig. 7B are replotted in gray to show difference. Line shows mean. Error bars indicate ±SEM. Two-Way ANOVA Feed/Starve p = 0.0047; RF5-11 and RF0-6 p < 0.0001. Fasting/Starvation times outlined in light blue rectangle(s). Full statistics are shown in Supplementary Information. Related to Supplementary Fig. 7. Source data are provided as a Source Data file.

Similar articles

References

    1. Hardin P. E. Advances in genetics. (Elsevier, 2011). - PMC - PubMed
    1. Cox KH, Takahashi JS. Circadian clock genes and the transcriptional architecture of the clock mechanism. J. Mol. Endocrinol. 2019;63:R93–r102. doi: 10.1530/JME-19-0153. - DOI - PMC - PubMed
    1. Panda S. Circadian physiology of metabolism. Science. 2016;354:1008–1015. doi: 10.1126/science.aah4967. - DOI - PMC - PubMed
    1. Reppert SM, Weaver DR. Coordination of circadian timing in mammals. Nature. 2002;418:935. doi: 10.1038/nature00965. - DOI - PubMed
    1. Dekens MP, Whitmore D. Autonomous onset of the circadian clock in the zebrafish embryo. Embo J. 2008;27:2757–2765. doi: 10.1038/emboj.2008.183. - DOI - PMC - PubMed