. 2024 Feb 27;15(1):1796.
doi: 10.1038/s41467-024-45901-z.

Impact of population aging on future temperature-related mortality at different global warming levels

Collaborators, Affiliations

Impact of population aging on future temperature-related mortality at different global warming levels

Kai Chen et al. Nat Commun. .

Abstract

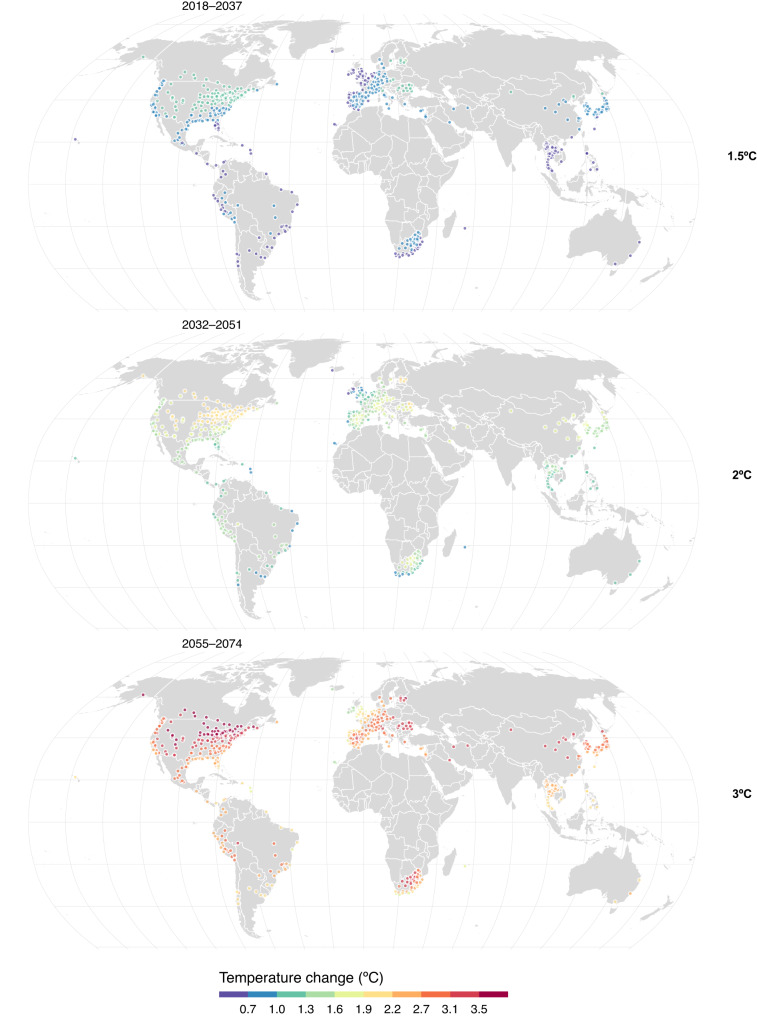
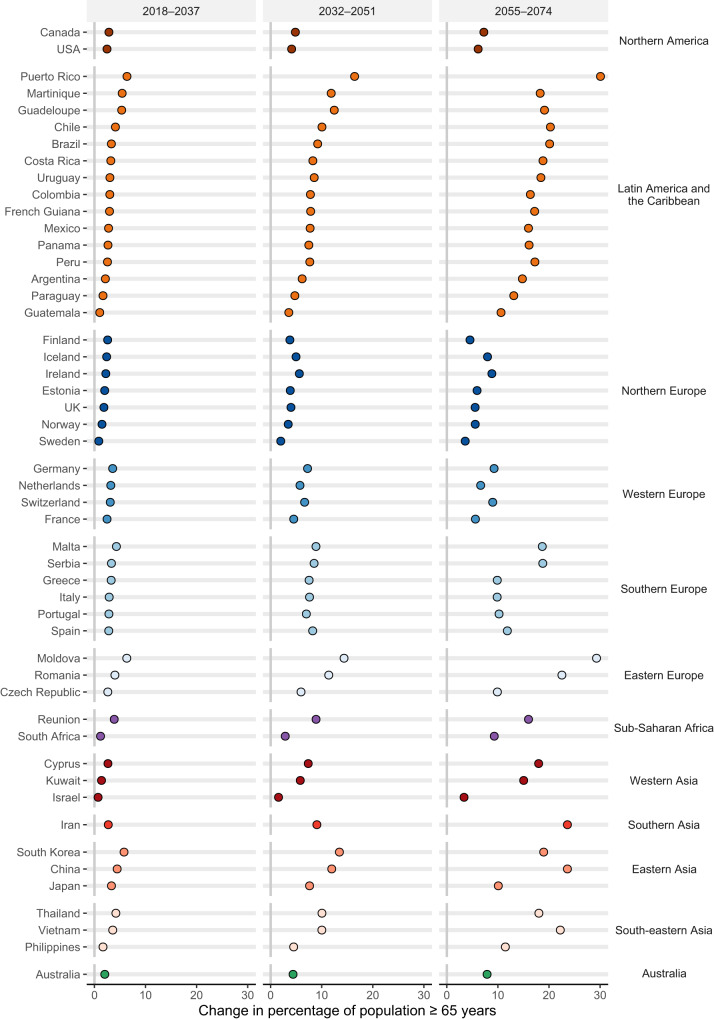
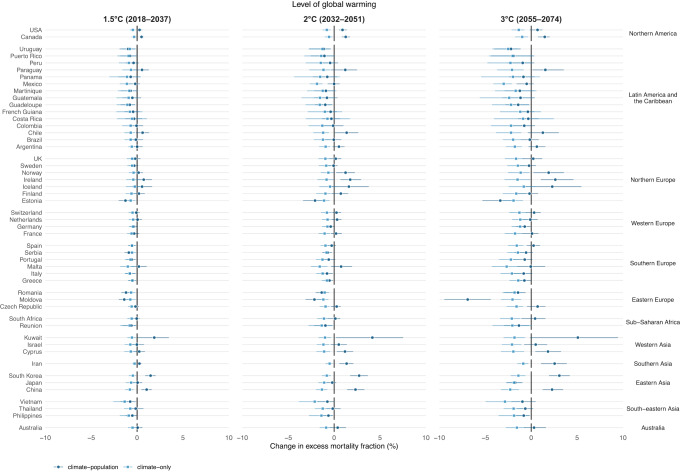
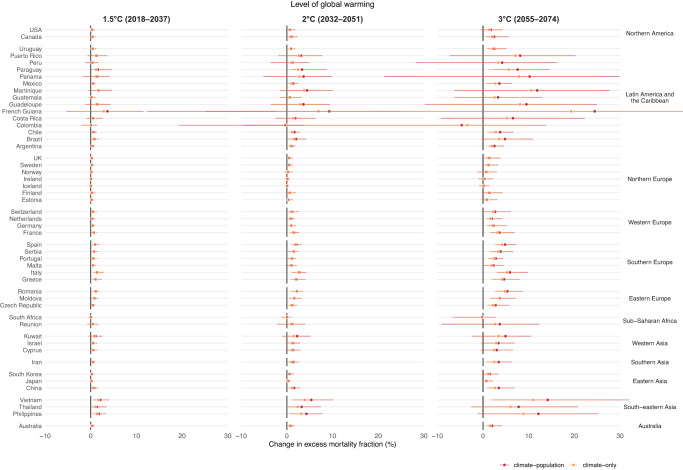
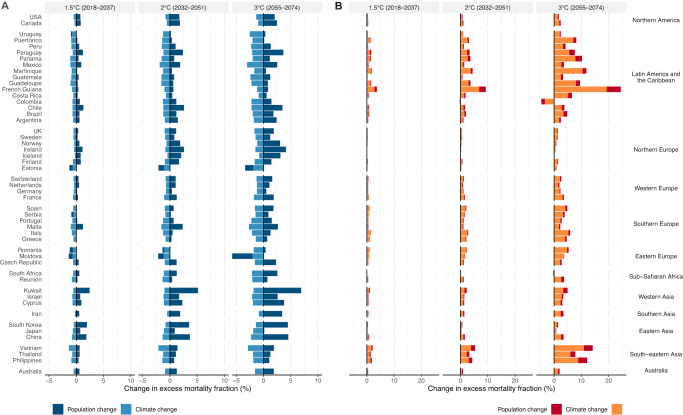
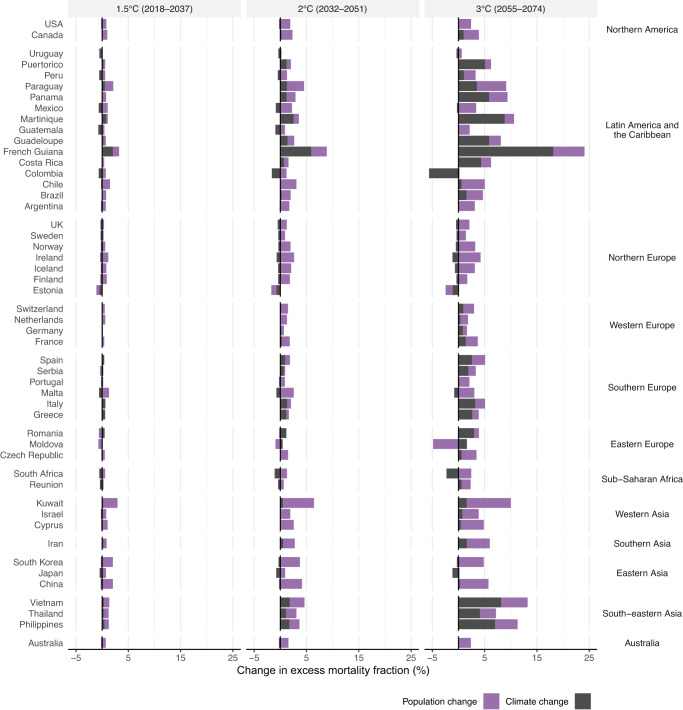
Older adults are generally amongst the most vulnerable to heat and cold. While temperature-related health impacts are projected to increase with global warming, the influence of population aging on these trends remains unclear. Here we show that at 1.5 °C, 2 °C, and 3 °C of global warming, heat-related mortality in 800 locations across 50 countries/areas will increase by 0.5%, 1.0%, and 2.5%, respectively; among which 1 in 5 to 1 in 4 heat-related deaths can be attributed to population aging. Despite a projected decrease in cold-related mortality due to progressive warming alone, population aging will mostly counteract this trend, leading to a net increase in cold-related mortality by 0.1%-0.4% at 1.5-3 °C global warming. Our findings indicate that population aging constitutes a crucial driver for future heat- and cold-related deaths, with increasing mortality burden for both heat and cold due to the aging population.


Conflict of interest statement

The authors declare no competing interests.

Figures

Fig. 1
Fig. 1. Projections of average daily mean temperature changes under global warming levels.
Distribution of the 800 locations with projected temperature changes at 1.5 °C, 2 °C, and 3 °C) of global warming. The future periods in which the 20-year running mean of global mean temperature first reaches the 1.5 °C, 2 °C, and 3 °C of warming above pre-industrial level (1850–1900) are 2018–2037, 2032–2051, and 2055–2074, respectively under SSP5-8.5. The administrative map data is from the giscoR package (https://ropengov.github.io/giscoR/).
Fig. 2
Fig. 2. Population aging at 20-year periods corresponding to different levels (1.5 °C, 2 °C, and 3 °C - SSP5-8.5) of global warming by country/area.
Country/area-specific age-group population projections are derived from the SSP5 scenario in the first 20-year periods reaching 1.5 °C (2018–2037), 2 °C (2032–2051), and 3 °C (2055–2074) of warming, respectively. X-axis shows the changes in percentage of population ≥ 65 years (%).
Fig. 3
Fig. 3. Changes in cold-related excess mortality fractions (%) at different levels of global warming by country/area under the climate-population and climate-only scenarios, compared with the historical period (1995–2014).
Estimates (shown as dots) are reported as the ensemble average of 18 general circulation models under the SSP5-8.5 scenario. The whiskers represent the 95% empirical confidence intervals. The future periods in which the 20-year running mean of global mean temperature first reaches the 1.5 °C, 2 °C, and 3 °C of warming above pre-industrial level (1850–1900) are 2018–2037, 2032–2051, and 2055–2074, respectively under SSP5-8.5.
Fig. 4
Fig. 4. Changes in heat-related excess mortality fractions (%) at different levels of global warming by country/area under the climate-population and climate-only scenarios, compared with the historical period (1995–2014).
Estimates (shown as dots) are reported as the ensemble average of 18 general circulation models under the SSP5-8.5 scenario. The whiskers represent the 95% empirical confidence intervals. The future periods in which the 20-year running mean of global mean temperature first reaches the 1.5 °C, 2 °C, and 3 °C of warming above pre-industrial level (1850–1900) are 2018–2037, 2032–2051, and 2055–2074, respectively under SSP5-8.5.
Fig. 5
Fig. 5. Contributions of climate change and population change to the changes in cold- and heat-related mortality at different levels of global warming.
A change in cold-related excess mortality fraction (%); B change in heat-related excess mortality fraction (%). Country/area-level changes by climate change and population aging are shown at 1.5 °C, 2 °C, and 3 °C of global warming using a 20-year window compared with the historical period 1995–2014 under SSP5-8.5. The future periods in which the 20-year running mean of global mean temperature first reaches the 1.5 °C, 2 °C, and 3 °C of warming above pre-industrial level (1850–1900) are 2018–2037, 2032–2051, and 2055–2074, respectively under SSP5-8.5. The impact of population aging was estimated by subtracting the future changes in temperature-related impacts in the constant population scenario (“climate-only”) from the changes in temperature-related impacts under the SSP5 mortality projection in the “climate-population” scenario. Note the different scales in the x-axis used for heat and cold.
Fig. 6
Fig. 6. Contributions of climate change and population change to the changes in non-optimal temperature-related (heat and cold combined) mortality at different levels of global warming.
Country/area-level changes by climate change and population aging are shown at 1.5 °C, 2 °C, and 3 °C of global warming using 20-year window compared with the historical period 1995-2014 under SSP5-8.5. The future periods in which the 20-year running mean of global mean temperature first reaches the 1.5 °C, 2 °C, and 3 °C of warming above pre-industrial level (1850–1900) are 2018–2037, 2032–2051, and 2055–2074, respectively under SSP5-8.5. The impact of population aging was estimated by subtracting the future changes in temperature-related impacts in the constant population scenario (climate-only) from the changes in temperature-related impacts under SSP5 mortality projection in the climate-population scenario.

Similar articles

Cited by

References

    1. de Schrijver, E. et al. Nationwide projections of heat- and cold-related mortality impacts under various climate change and population development scenarios in Switzerland. Environ. Res. Lett. 18, 12 (2023). - PMC - PubMed
    1. Eyring V, et al. Overview of the Coupled Model Intercomparison Project Phase 6 (CMIP6) experimental design and organization. Geosci. Model Dev. 2016;9:1937–1958. doi: 10.5194/gmd-9-1937-2016. - DOI
    1. Vicedo-Cabrera AM, Sera F, Gasparrini A. Hands-on tutorial on a modeling framework for projections of climate change impacts on health. Epidemiology. 2019;30:321–329. doi: 10.1097/EDE.0000000000000982. - DOI - PMC - PubMed
    1. Lange S. Trend-preserving bias adjustment and statistical downscaling with ISIMIP3BASD (v1.0) Geosci. Model Dev. 2019;12:3055–3070. doi: 10.5194/gmd-12-3055-2019. - DOI
    1. Samir K, Lutz W. The human core of the shared socioeconomic pathways: Population scenarios by age, sex and level of education for all countries to 2100. Glob. Environ. Change. 2017;42:181–192. doi: 10.1016/j.gloenvcha.2014.06.004. - DOI - PMC - PubMed