. 2024 Apr;30(4):1134-1142.
doi: 10.1038/s41591-024-02855-5. Epub 2024 Feb 27.

Adapted large language models can outperform medical experts in clinical text summarization

Affiliations

Adapted large language models can outperform medical experts in clinical text summarization

Dave Van Veen et al. Nat Med. 2024 Apr.

Abstract

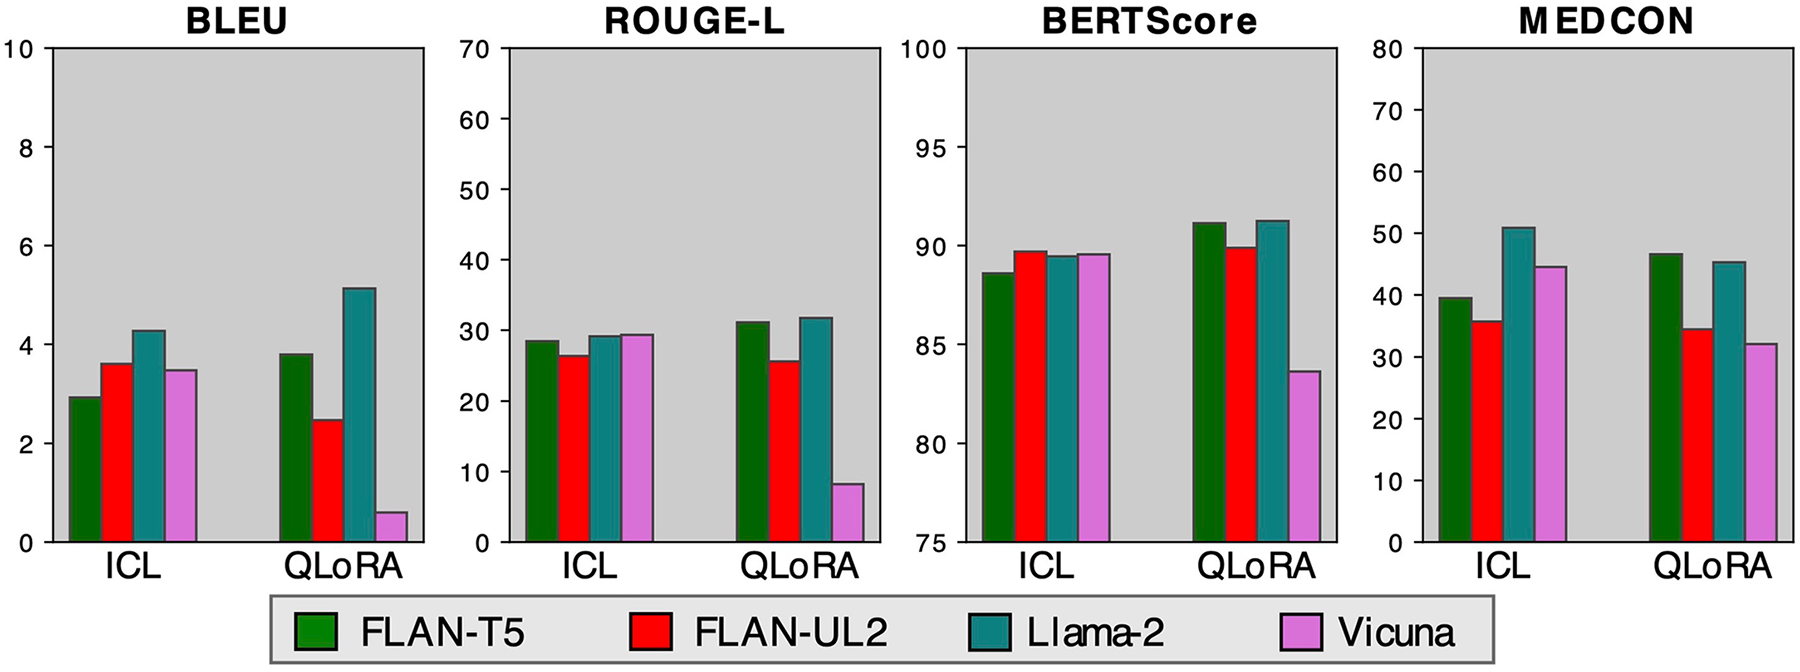
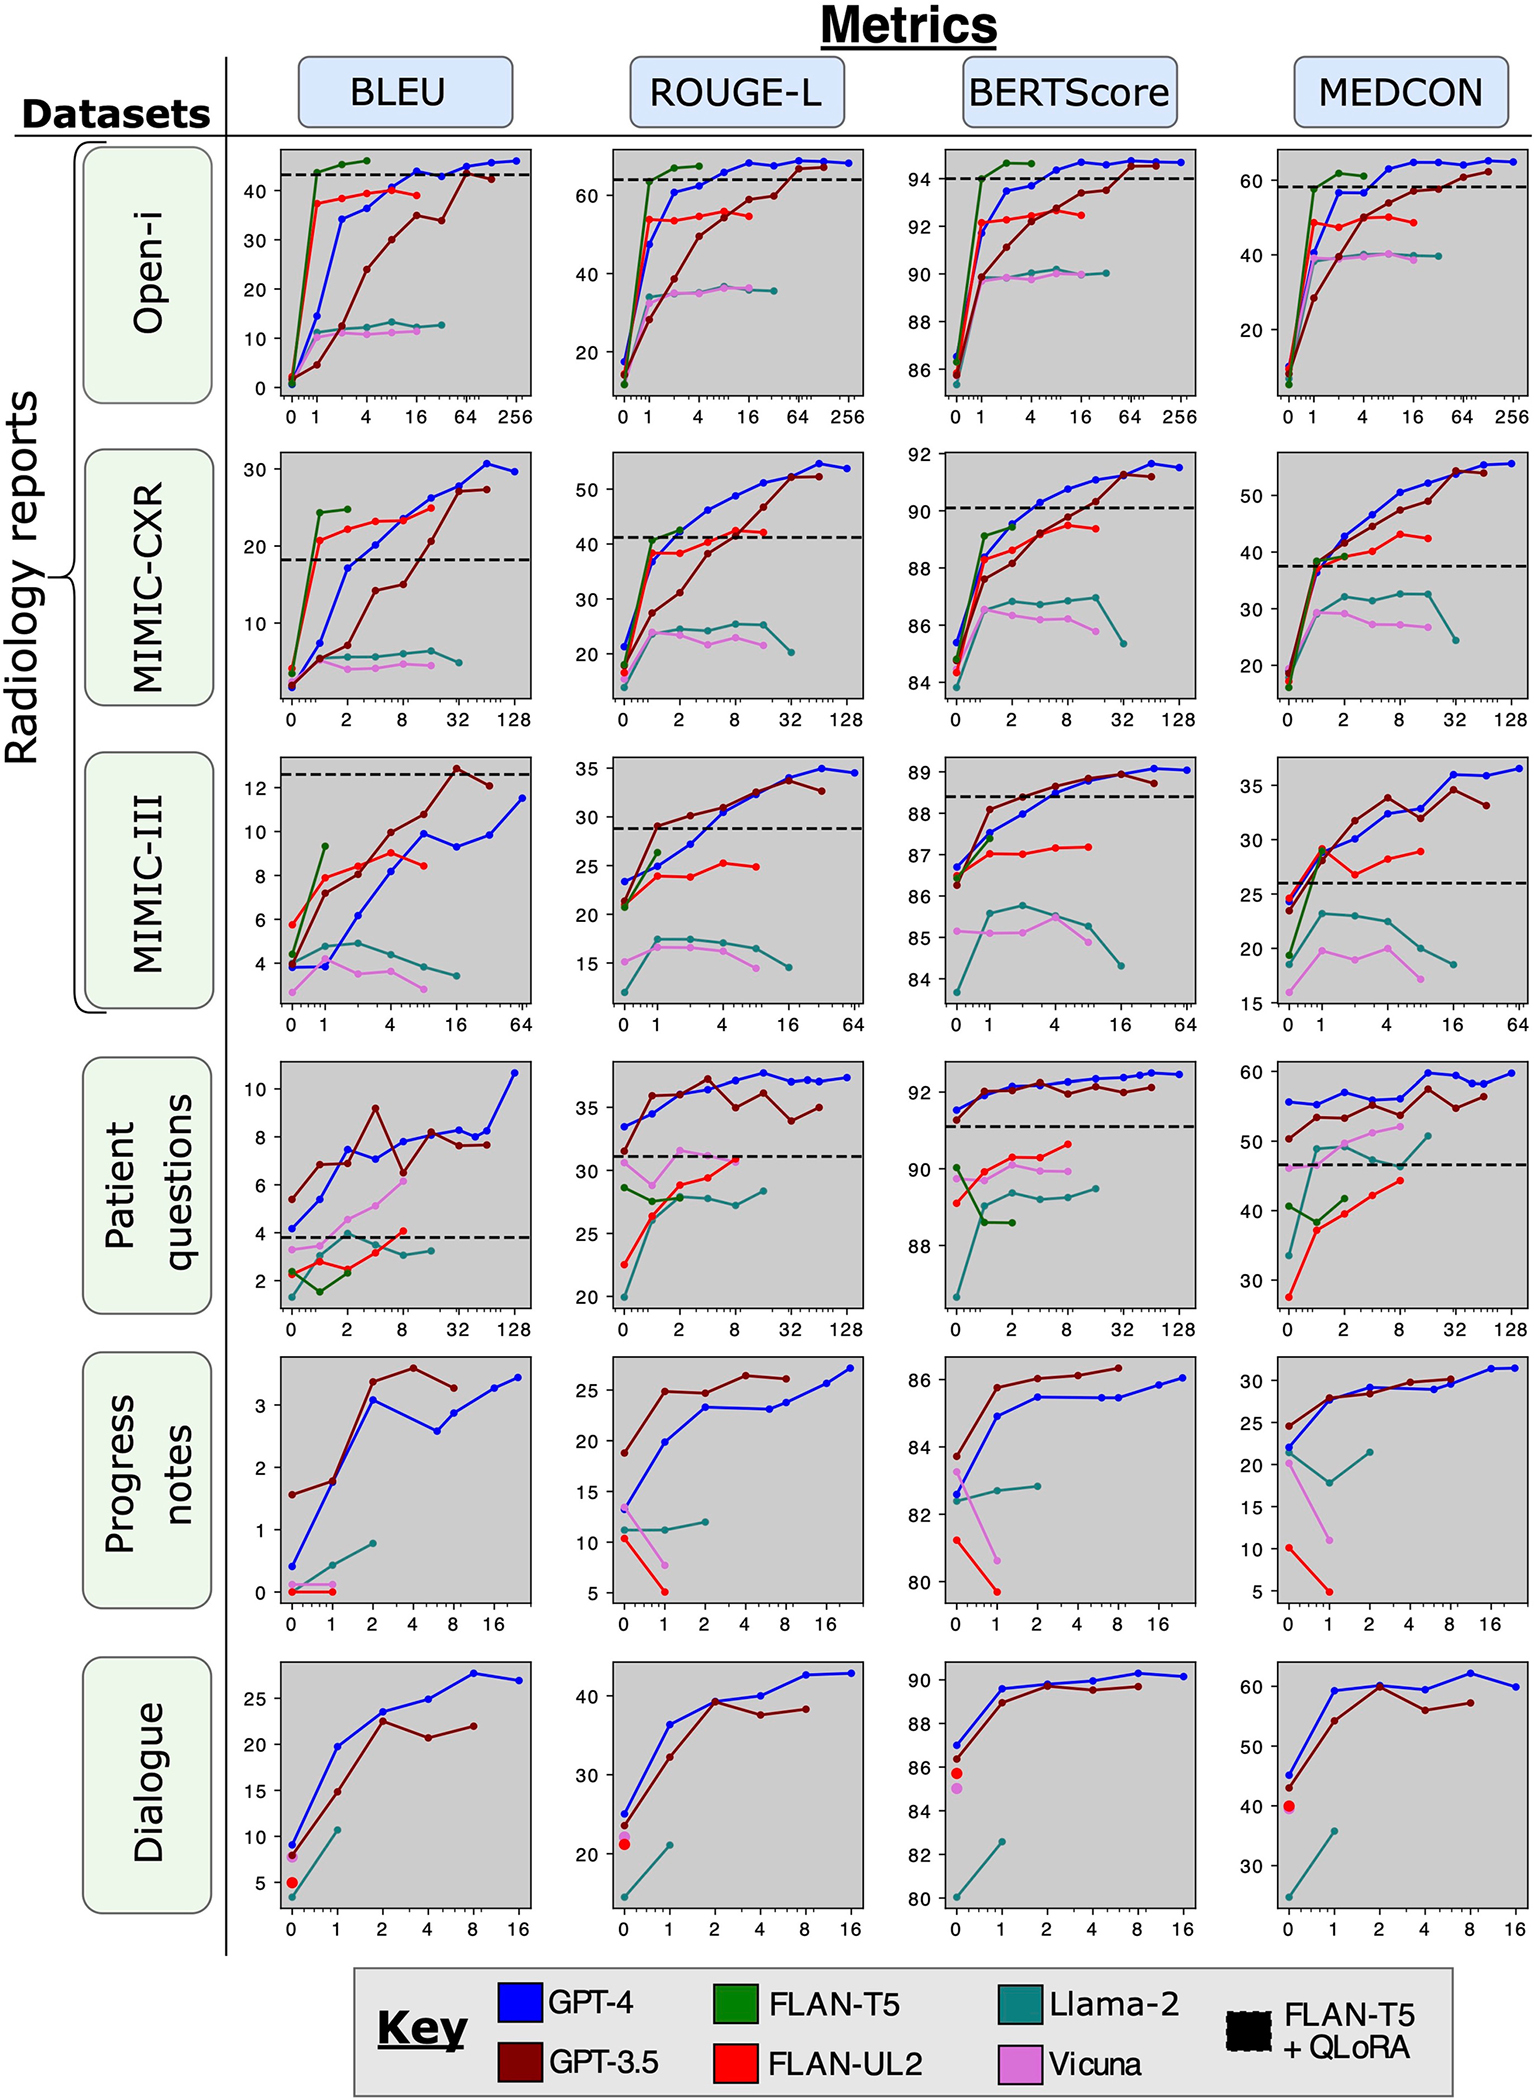
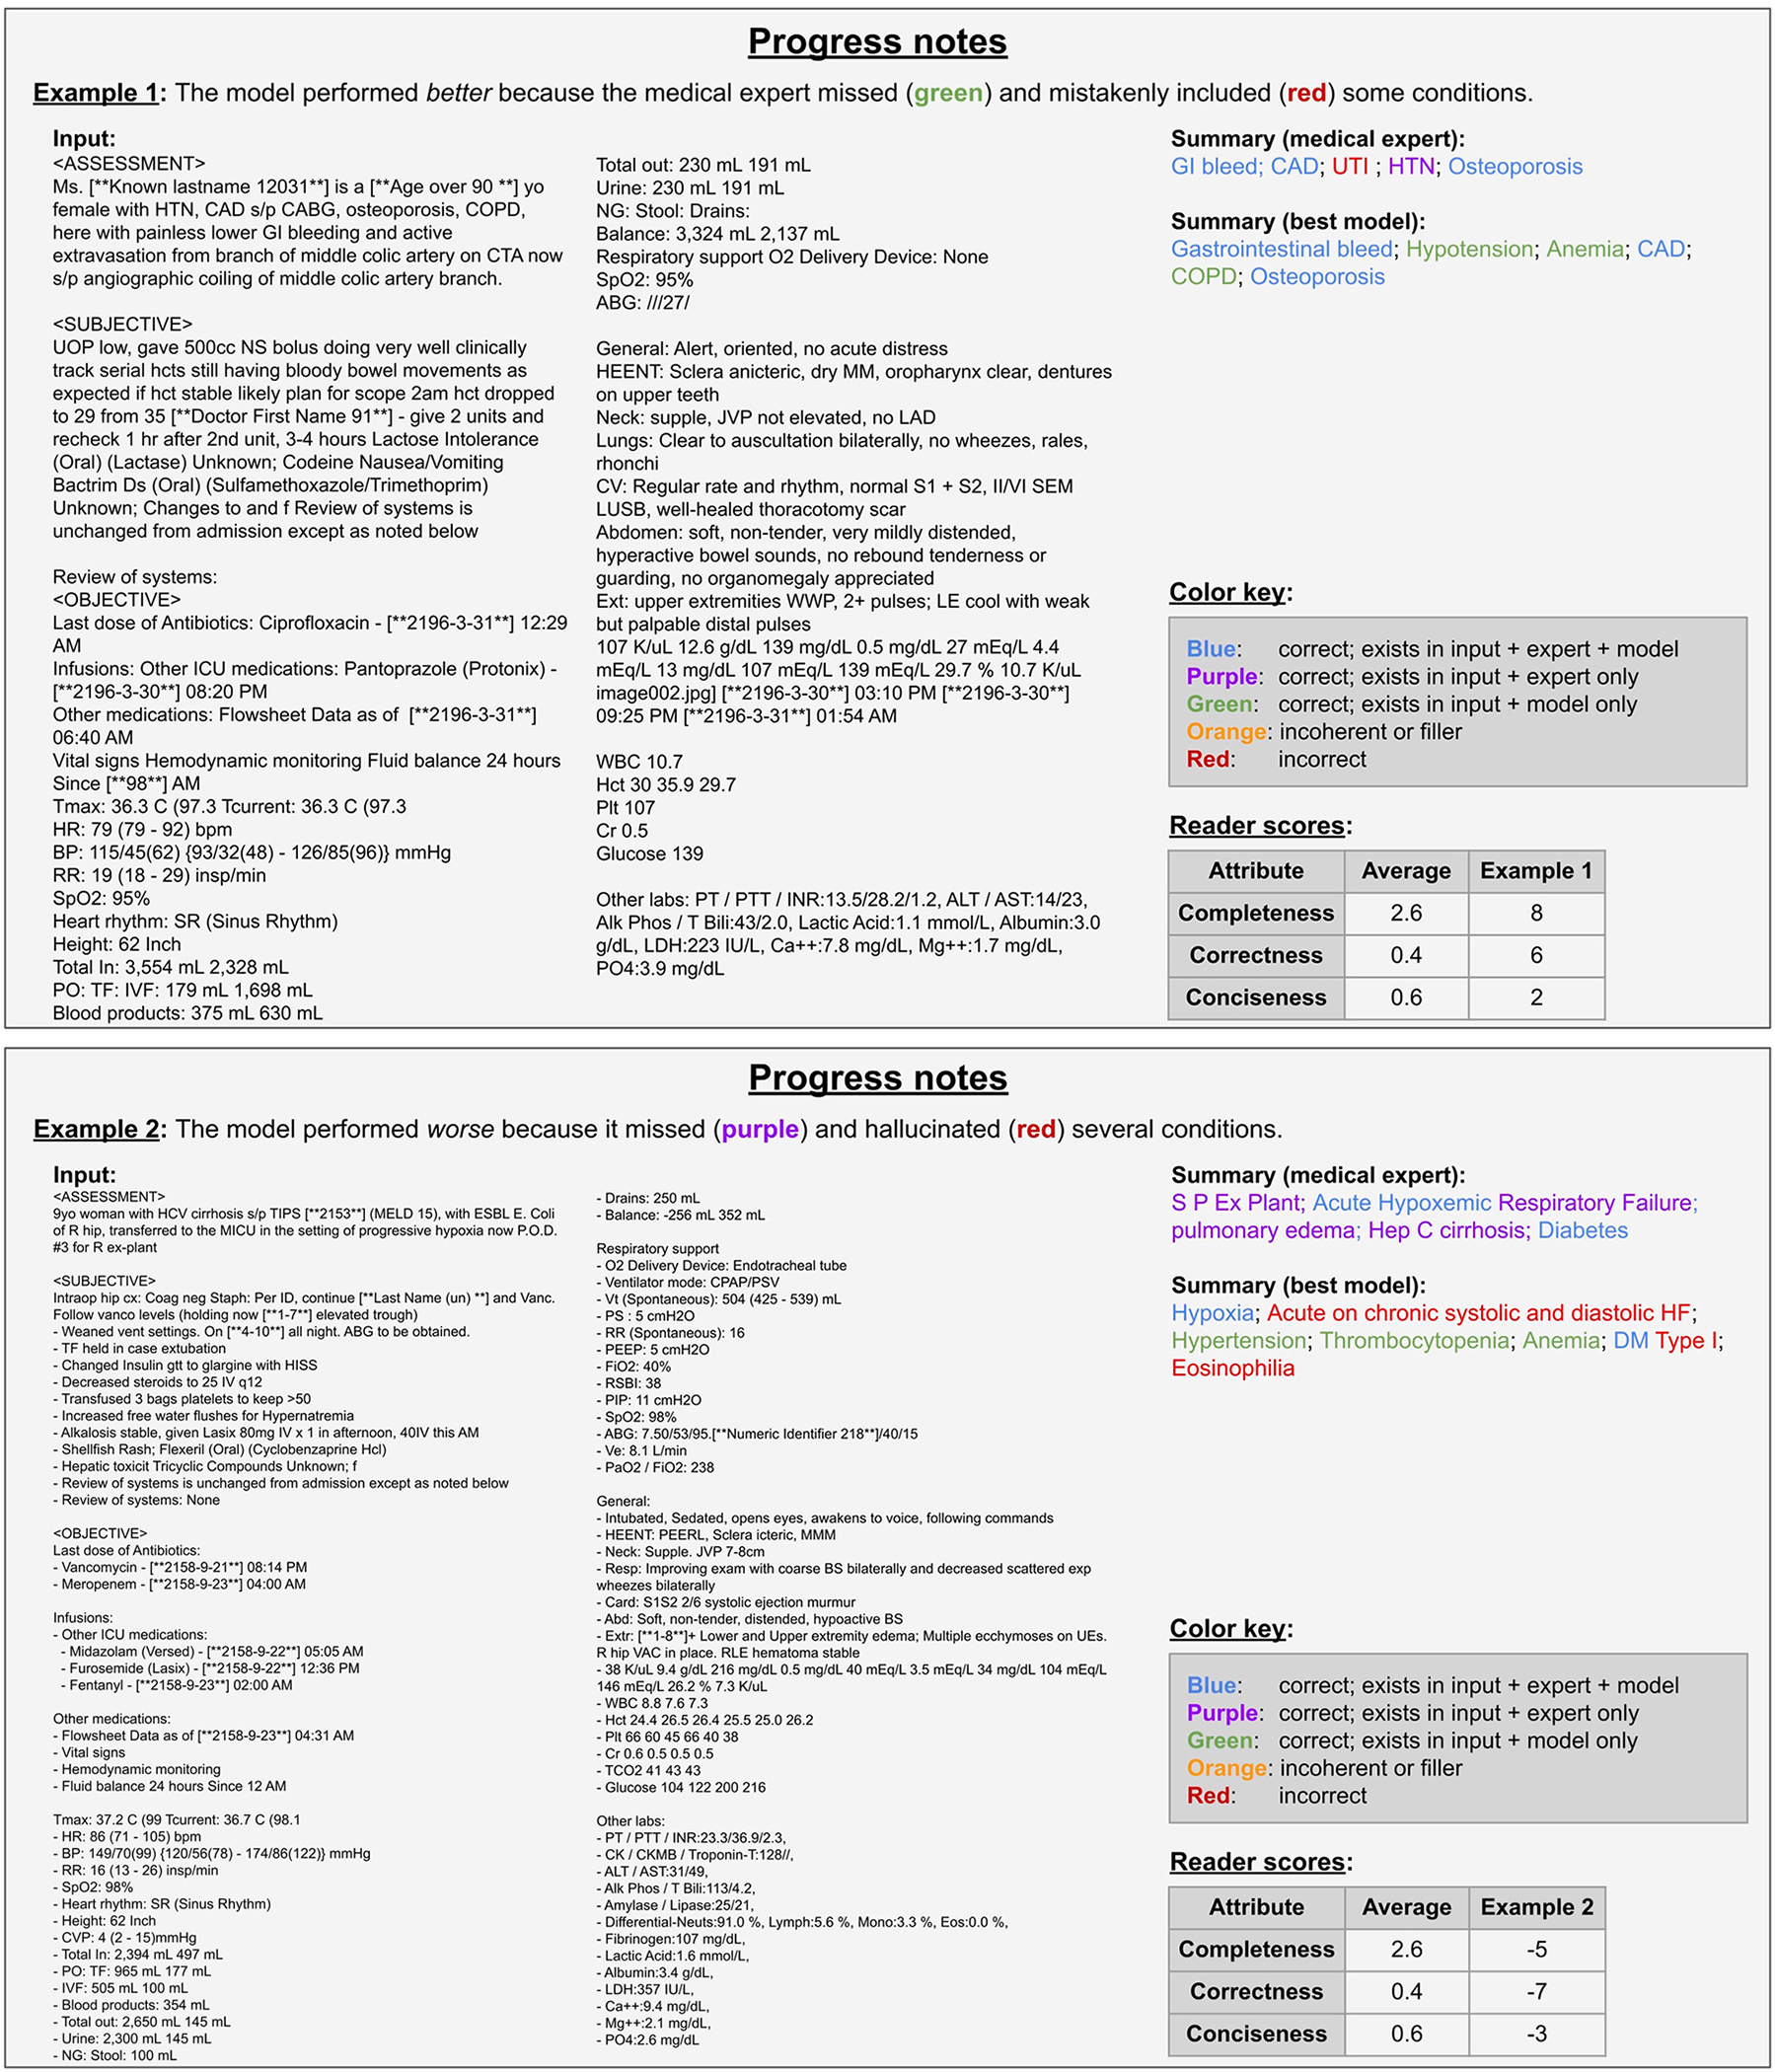
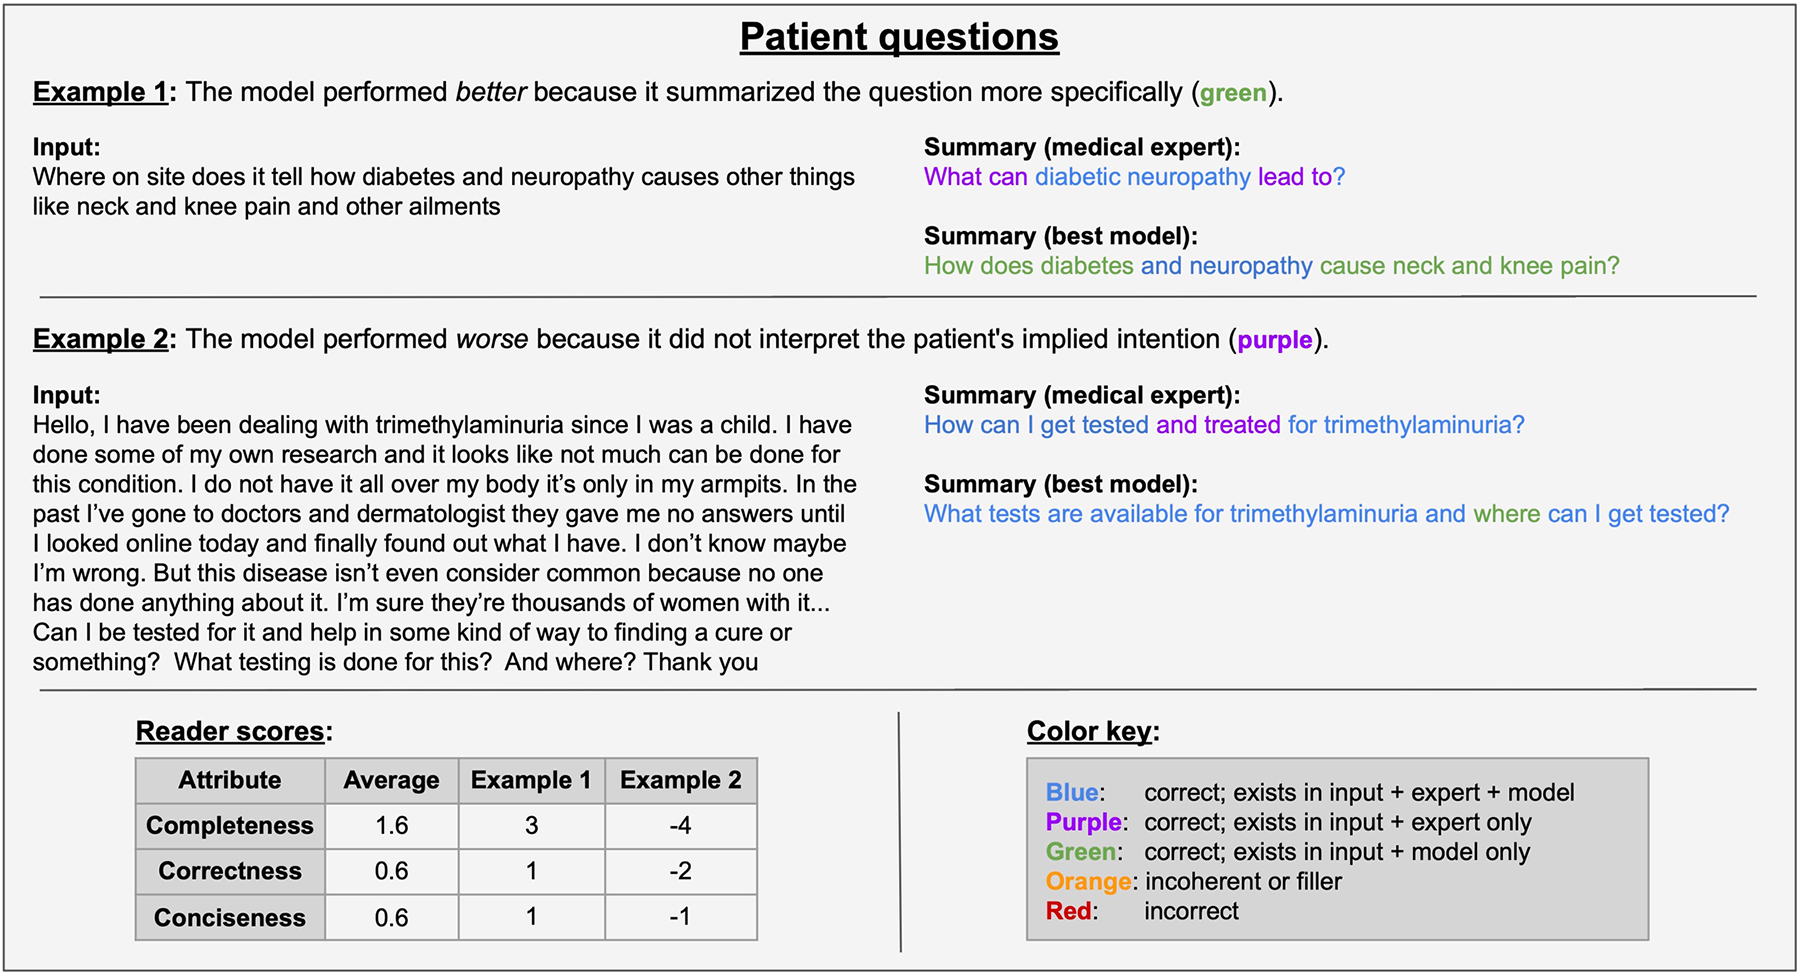
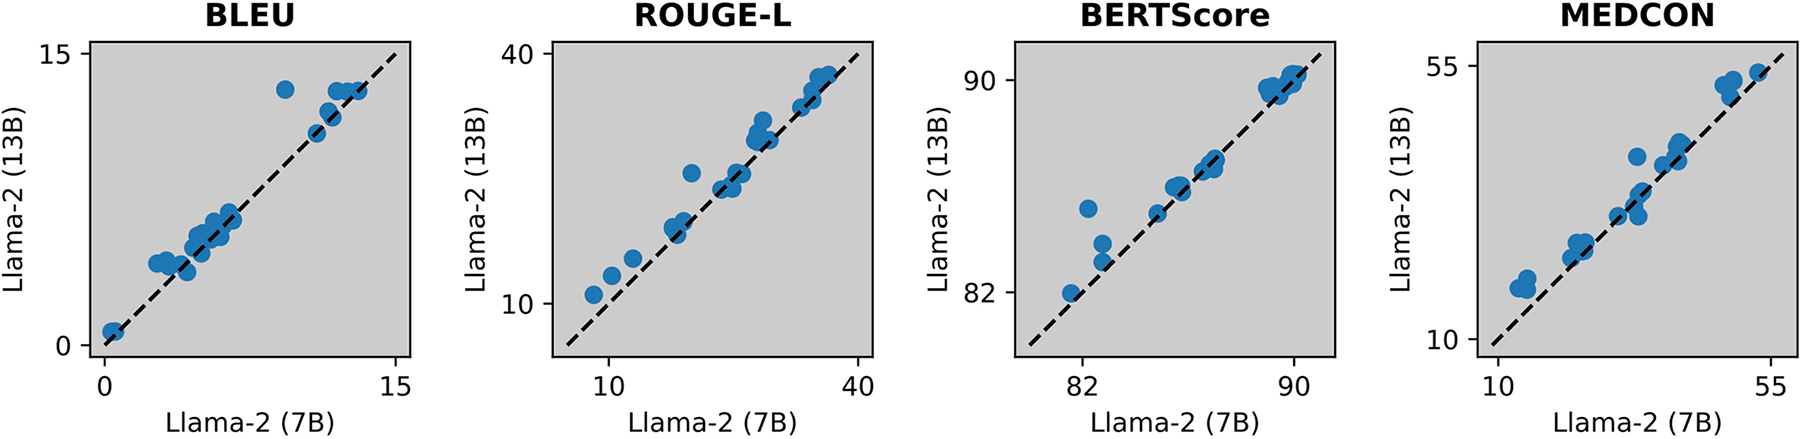
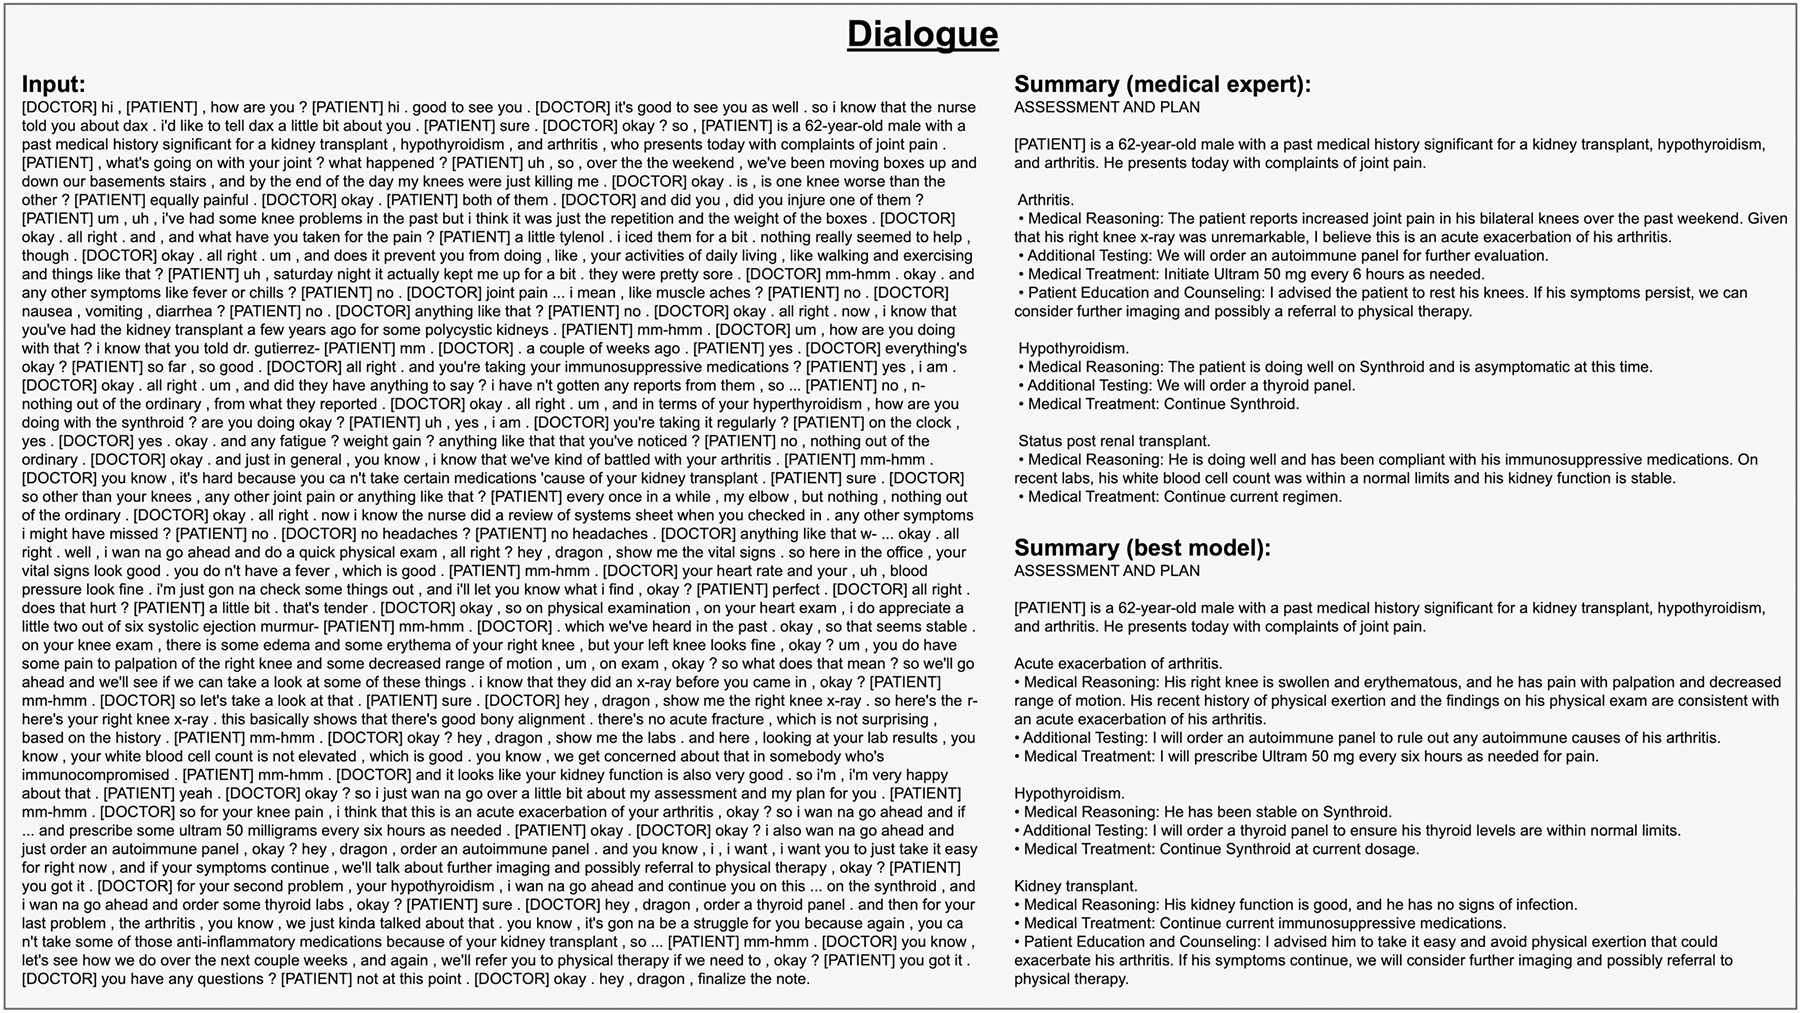
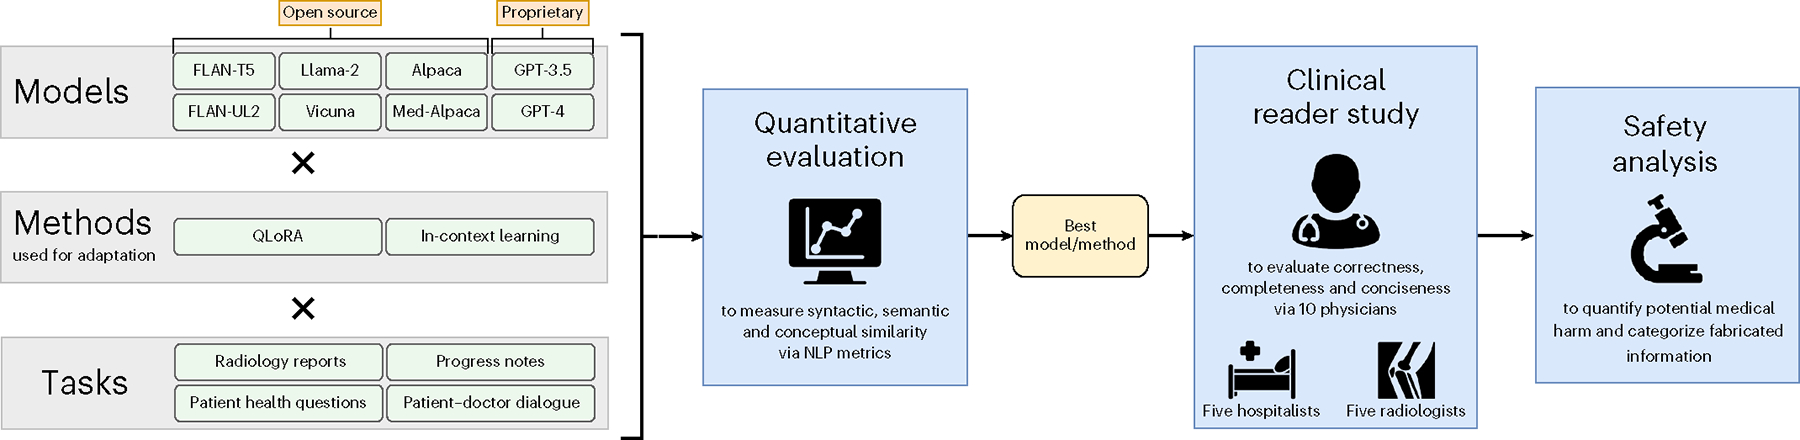
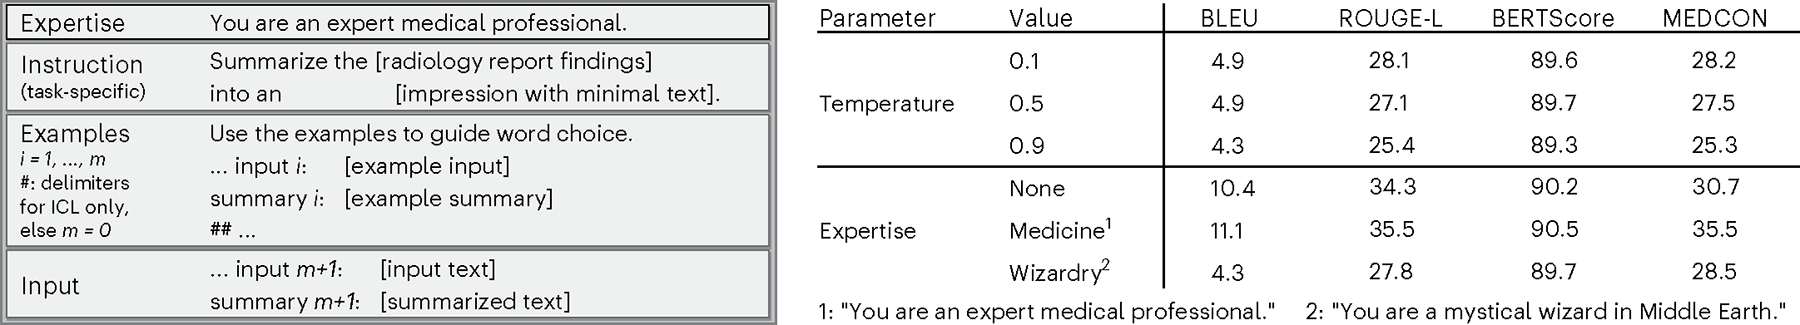
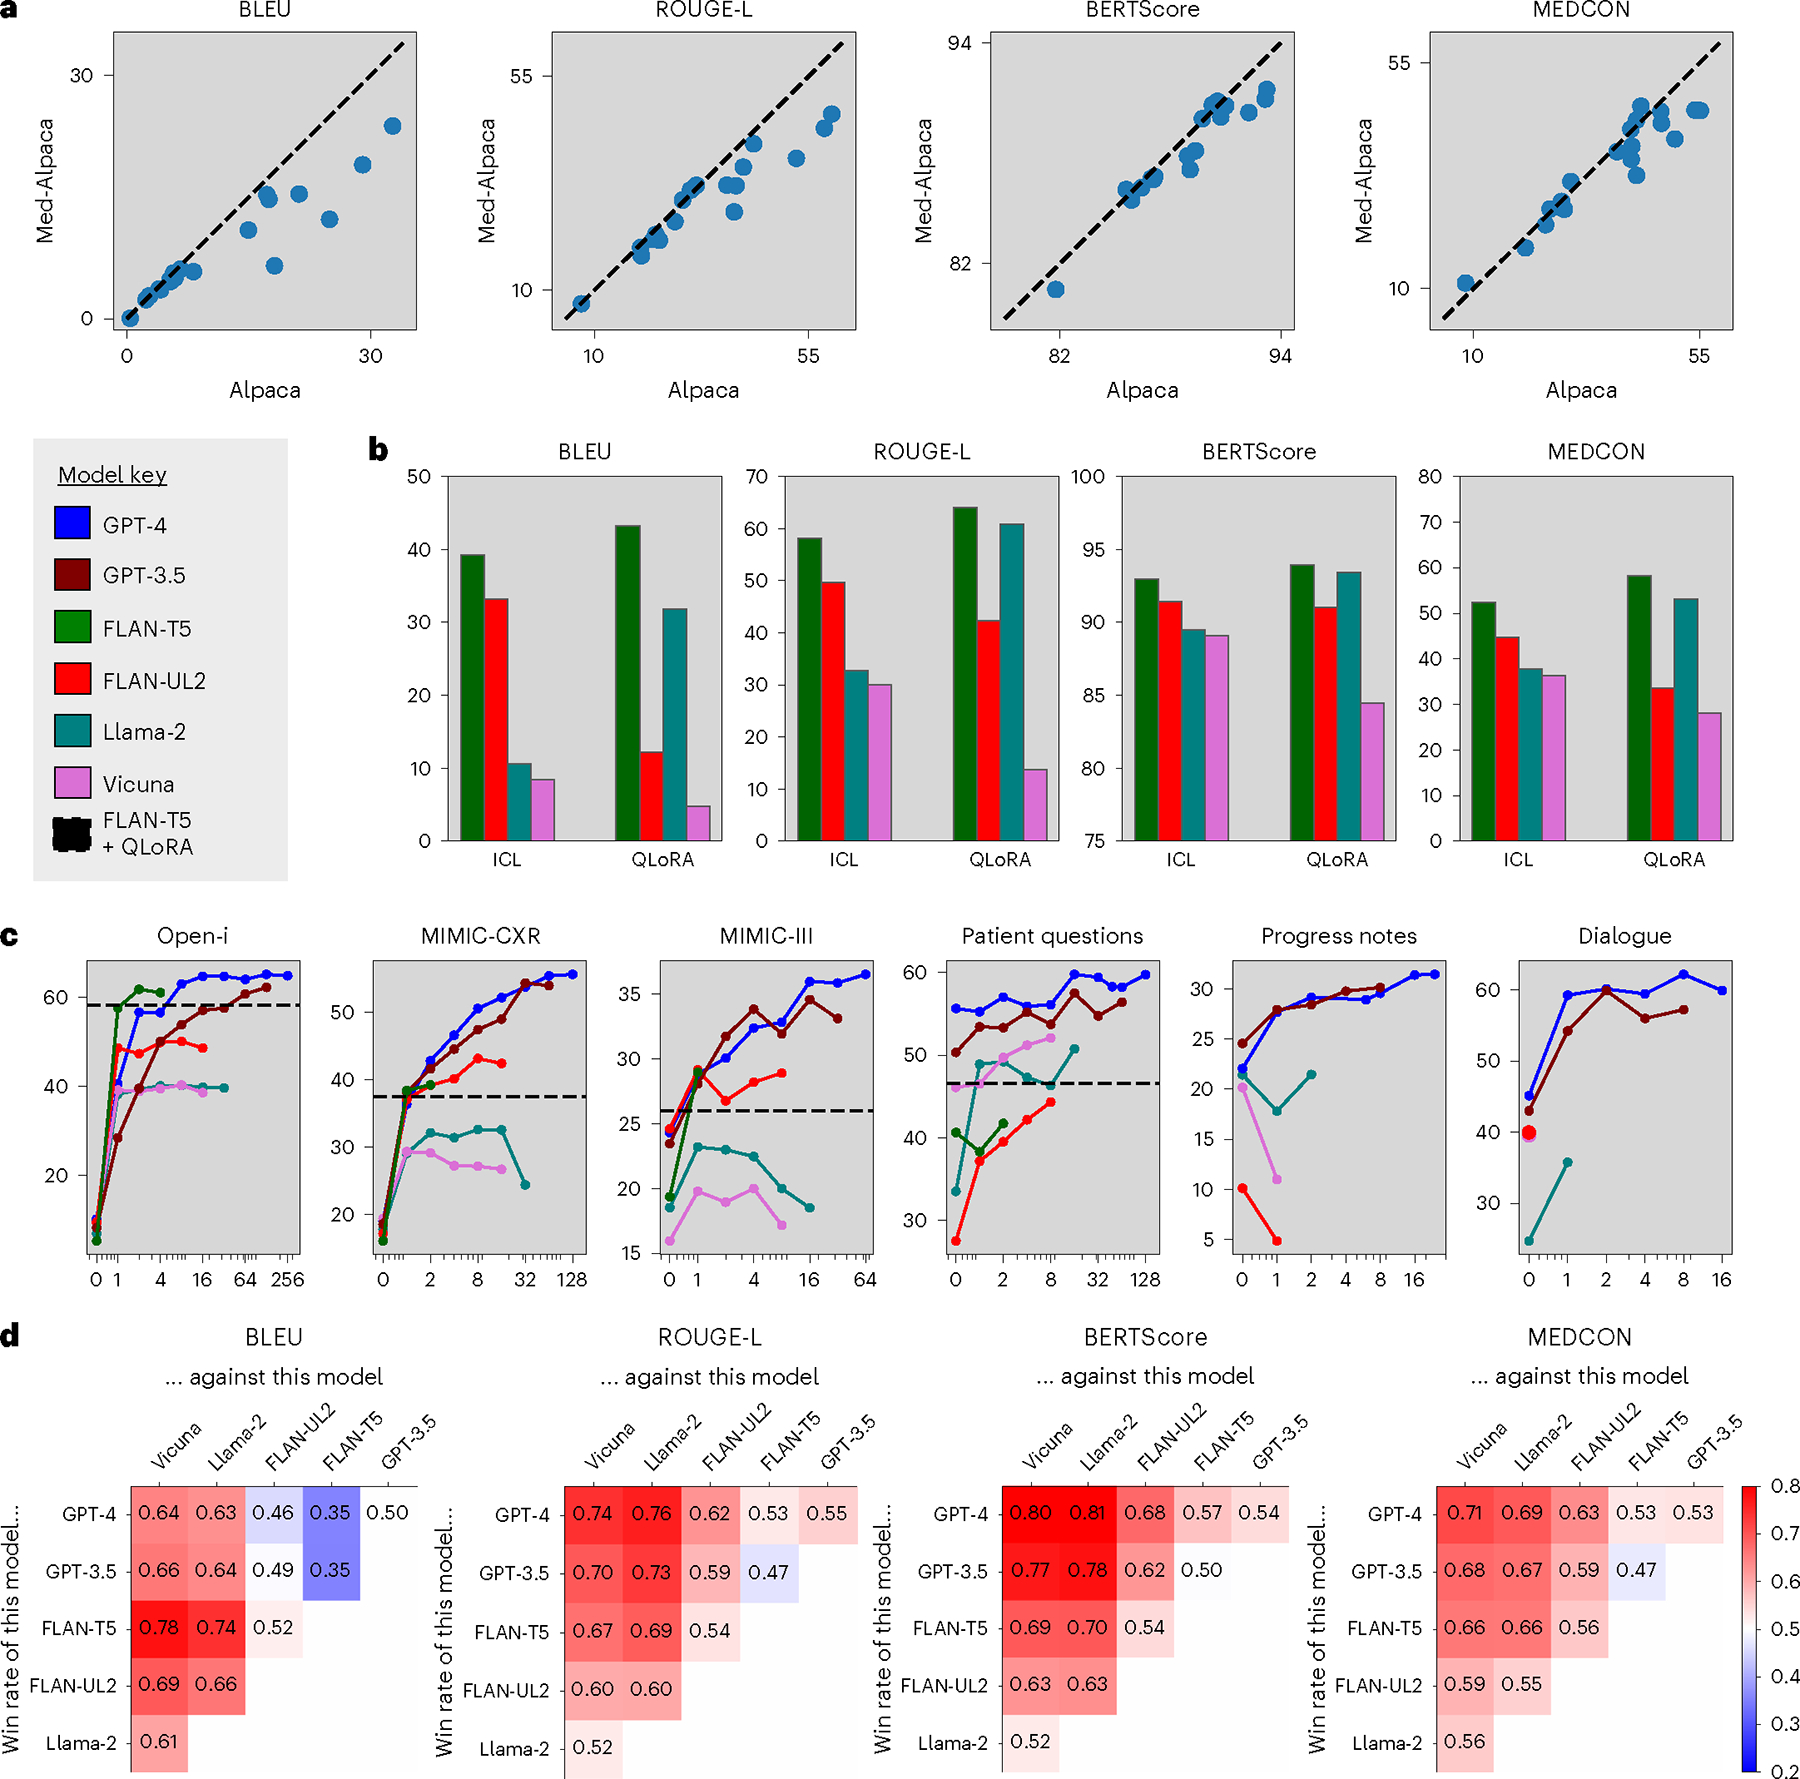
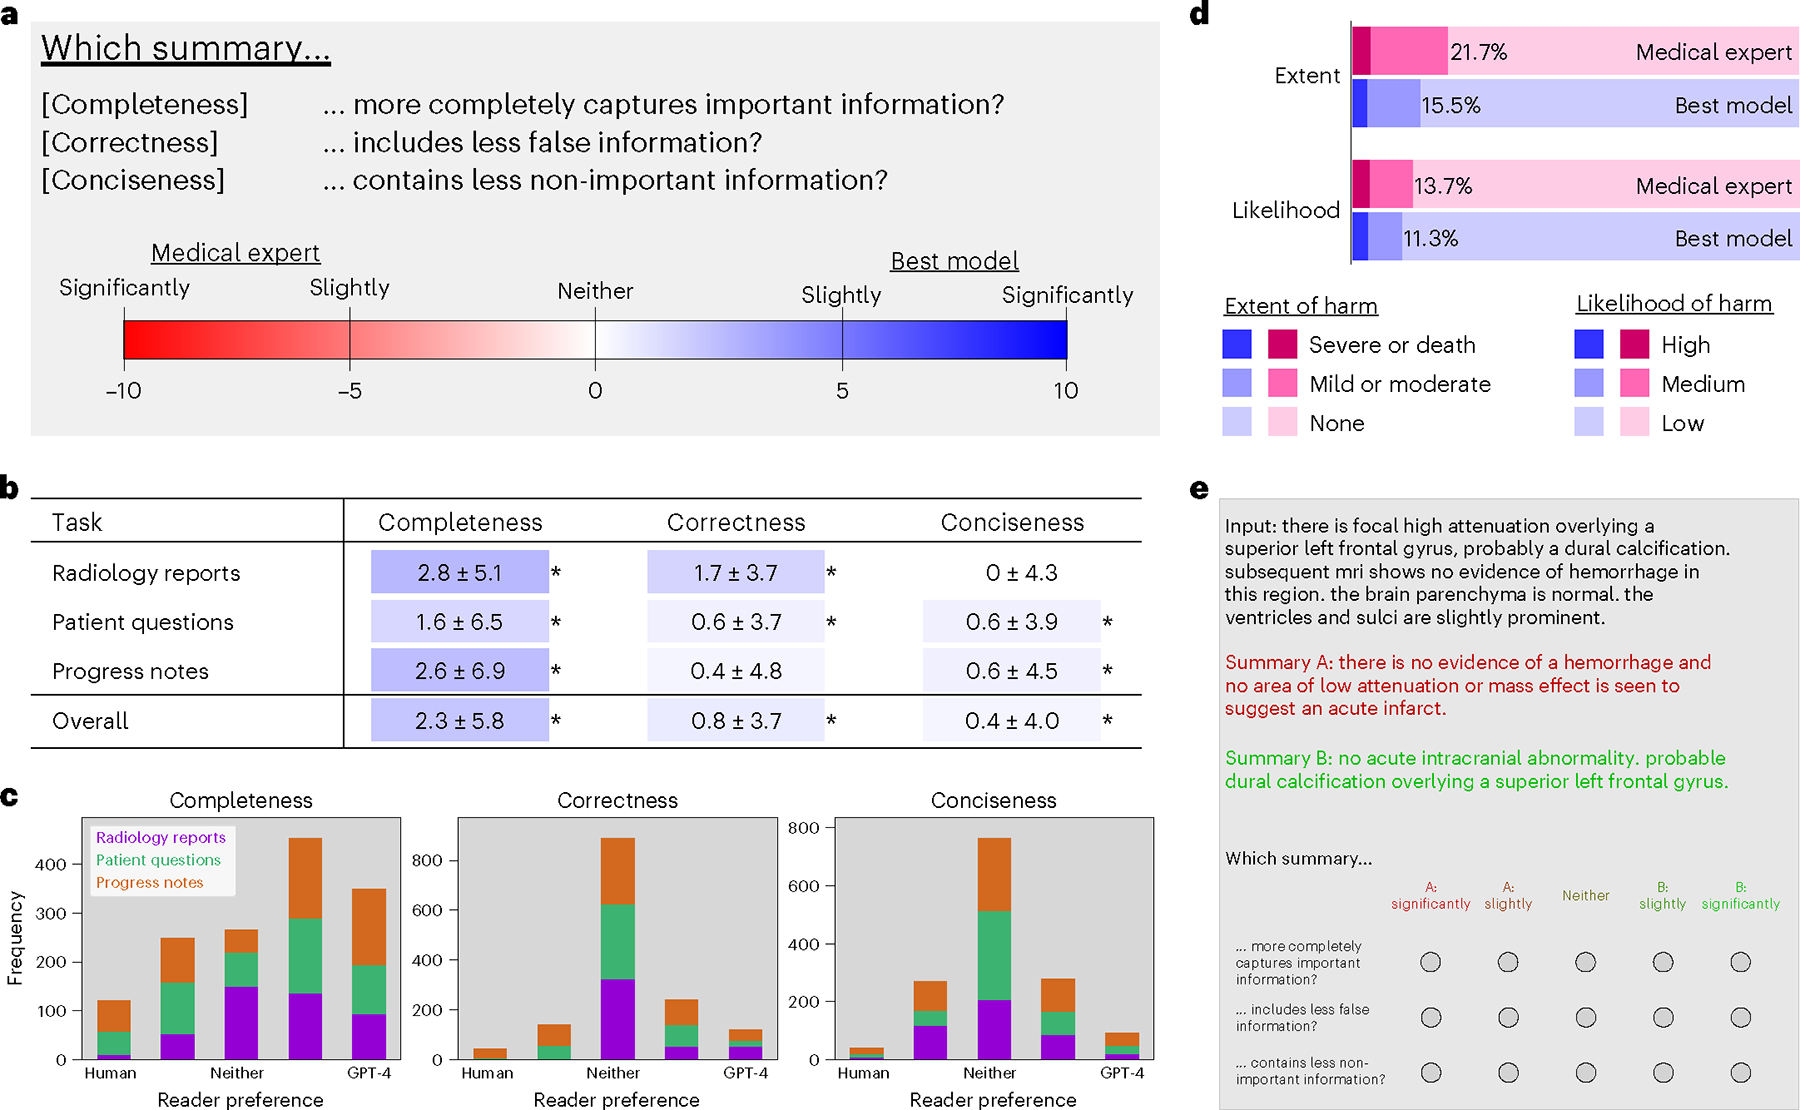
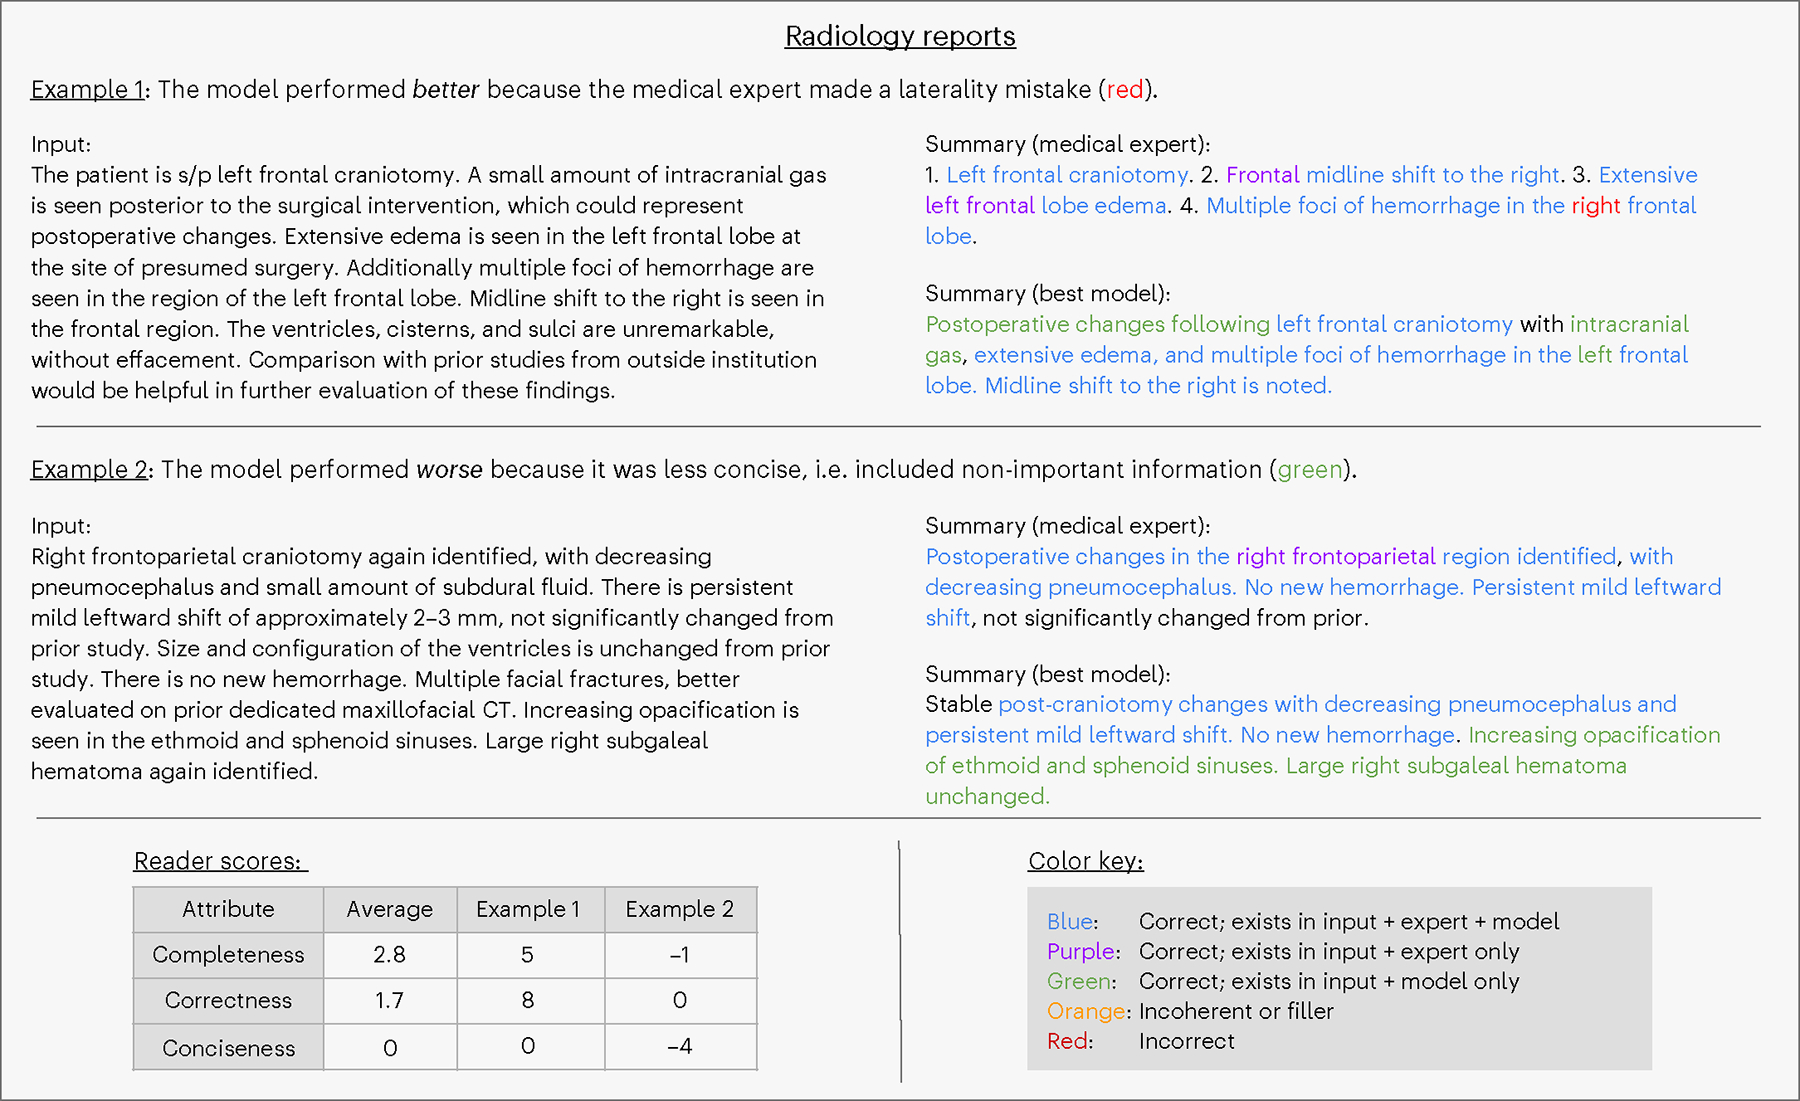
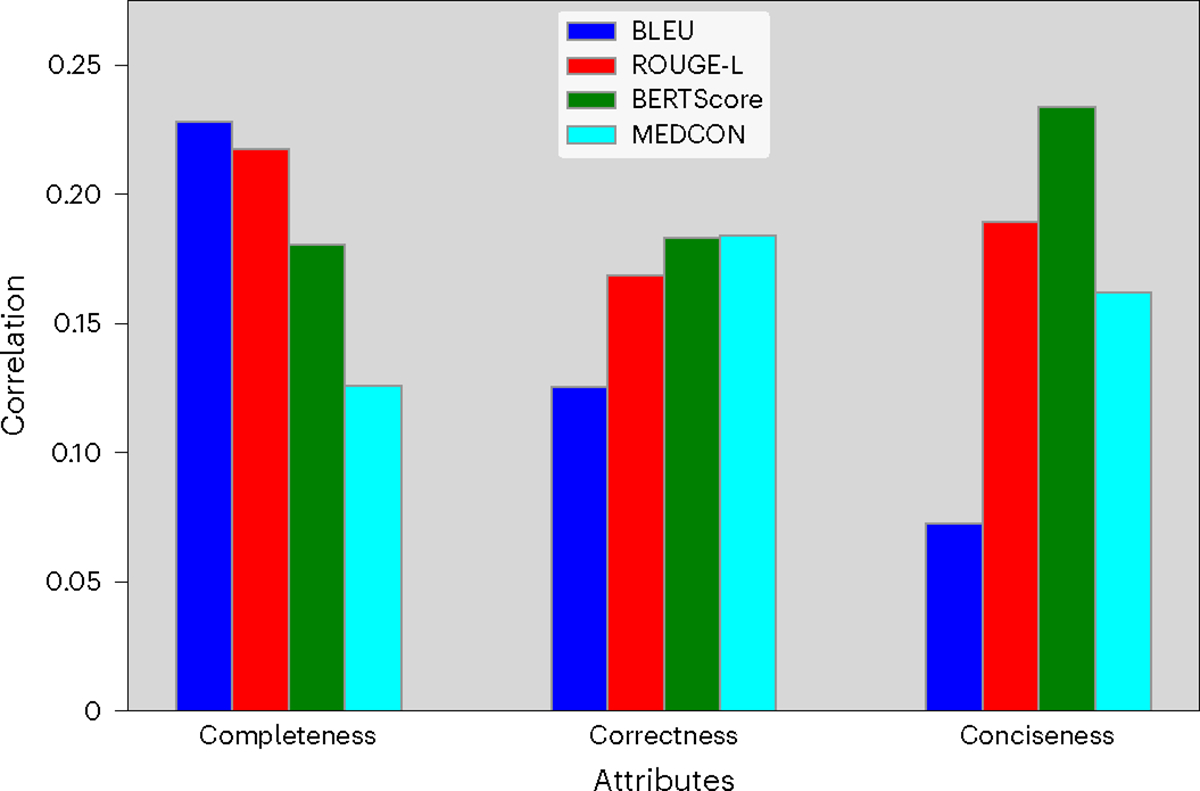
Analyzing vast textual data and summarizing key information from electronic health records imposes a substantial burden on how clinicians allocate their time. Although large language models (LLMs) have shown promise in natural language processing (NLP) tasks, their effectiveness on a diverse range of clinical summarization tasks remains unproven. Here we applied adaptation methods to eight LLMs, spanning four distinct clinical summarization tasks: radiology reports, patient questions, progress notes and doctor-patient dialogue. Quantitative assessments with syntactic, semantic and conceptual NLP metrics reveal trade-offs between models and adaptation methods. A clinical reader study with 10 physicians evaluated summary completeness, correctness and conciseness; in most cases, summaries from our best-adapted LLMs were deemed either equivalent (45%) or superior (36%) compared with summaries from medical experts. The ensuing safety analysis highlights challenges faced by both LLMs and medical experts, as we connect errors to potential medical harm and categorize types of fabricated information. Our research provides evidence of LLMs outperforming medical experts in clinical text summarization across multiple tasks. This suggests that integrating LLMs into clinical workflows could alleviate documentation burden, allowing clinicians to focus more on patient care.


Conflict of interest statement

Competing interests

The authors declare no competing interests.

Figures

Extended Data Fig. 1 |
Extended Data Fig. 1 |. ICL vs. QLoRA.
Summarization performance comparing one in-context example (ICL) vs. QLoRA across all open-source models on patient health questions.
Extended Data Fig. 2 |
Extended Data Fig. 2 |. Quantitative results across all metrics.
Metric scores vs. number of in-context examples across models and datasets. We also include the best model fine-tuned with QLoRA (FLAN-T5) as a horizontal dashed line.
Extended Data Fig. 3 |
Extended Data Fig. 3 |. Annotation: progress notes.
Qualitative analysis of two progress notes summarization examples from the reader study. The table (lower right) contains reader scores for these examples and the task average across all samples.
Extended Data Fig. 4 |
Extended Data Fig. 4 |. Annotation: patient questions.
Qualitative analysis of two patient health question examples from the reader study. The table (lower left) contains reader scores for these examples and the task average across all samples.
Extended Data Fig. 5 |
Extended Data Fig. 5 |. Effect of model size.
Comparing Llama-2 (7B) vs. Llama-2 (13B). The dashed line denotes equivalence, and each data point corresponds to the average score of s = 250 samples for a given experimental configuration, that is {dataset x m in-context examples}.
Extended Data Fig. 6 |
Extended Data Fig. 6 |. Example: dialogue.
Example of the doctor-patient dialogue summarization task, including ‘assessment and plan’ sections generated by both a medical expert and the best model.
Fig. 1 |
Fig. 1 |. Framework overview.
First, we quantitatively evaluated each valid combination (×) of LLM and adaptation method across four distinct summarization tasks comprising six datasets. We then conducted a clinical reader study in which 10 physicians compared summaries of the best model/method against those of a medical expert. Lastly, we performed a safety analysis to categorize different types of fabricated information and to identify potential medical harm that may result from choosing either the model or the medical expert summary.
Fig. 2 |
Fig. 2 |. Model prompts and temperature.
Left, prompt anatomy. Each summarization task uses a slightly different instruction. Right, model performance across different temperature values and expertise.
Fig. 3 |
Fig. 3 |. Identifying the best model/method.
a, Impact of domain-specific fine-tuning. Alpaca versus Med-Alpaca. Each data point corresponds to one experimental configuration, and the dashed lines denote equal performance. b, Comparison of adaptation strategies. One in-context example (ICL) versus QLoRA across all open-source models on the Open-i radiology report dataset. c, Effect of context length for ICL. MEDCON scores versus number of in-context examples across models and datasets. We also included the best QLoRA fine-tuned model (FLAN-T5) as a horizontal dashed line for valid datasets. d, Head-to-head model comparison. Win percentages of each head-to-head model combination, where red/blue intensities highlight the degree to which models on the vertical axis outperform models on the horizontal axis.
Fig. 4 |
Fig. 4 |. Clinical reader study.
a, Study design comparing summaries from the best model versus that of medical experts on three attributes: completeness, correctness and conciseness. b, Results. Highlight colors correspond to a value’s location on the color spectrum. Asterisks (*) denote statistical significance by a one-sided Wilcoxon signed-rank test, P < 0.001. c, Distribution of reader scores for each summarization task across attributes. Horizontal axes denote reader preference as measured by a five-point Likert scale. Vertical axes denote frequency count, with 1,500 total cases for each plot. d, Extent and likelihood of possible harm caused by choosing summaries from the medical expert (pink) or best model (purple) over the other. e, Reader study user interface.
Fig. 5 |
Fig. 5 |. Annotation: radiology reports.
Qualitative analysis of two radiologist report examples from the reader study. The table (lower left) contains reader scores for these two examples and the task average across all samples.
Fig. 6 |
Fig. 6 |. Connecting NLP metrics and reader scores.
Spearman correlation coefficients between quantitative metrics and reader preference assessing completeness, correctness and conciseness.

Update of

References

    1. Golob JF Jr, Como JJ & Claridge JA The painful truth: the documentation burden of a trauma surgeon. J. Trauma Acute Care Surg. 80, 742–747 (2016). - PubMed
    1. Arndt BG et al. Tethered to the EHR: primary care physician workload assessment using EHR event log data and time–motion observations. Ann. Fam. Med. 15, 419–426 (2017). - PMC - PubMed
    1. Fleming SL et al. MedAlign: a clinician-generated dataset for instruction following with electronic medical records. Preprint at 10.48550/arXiv.2308.14089 (2023). - DOI
    1. Yackel TR & Embi PJ Unintended errors with EHR-based result management: a case series. J. Am. Med. Inform. Assoc. 17, 104–107 (2010). - PMC - PubMed
    1. Bowman S Impact of electronic health record systems on information integrity: quality and safety implications. Perspect. Health Inf. Manag. 10, 1c (2013). - PMC - PubMed

LinkOut - more resources