. 2024 Mar;25(3):1233-1255.
doi: 10.1038/s44319-024-00090-0. Epub 2024 Feb 27.

Hyperfunction of post-synaptic density protein 95 promotes seizure response in early-stage aβ pathology

Affiliations

Hyperfunction of post-synaptic density protein 95 promotes seizure response in early-stage aβ pathology

Yeeun Yook et al. EMBO Rep. 2024 Mar.

Abstract

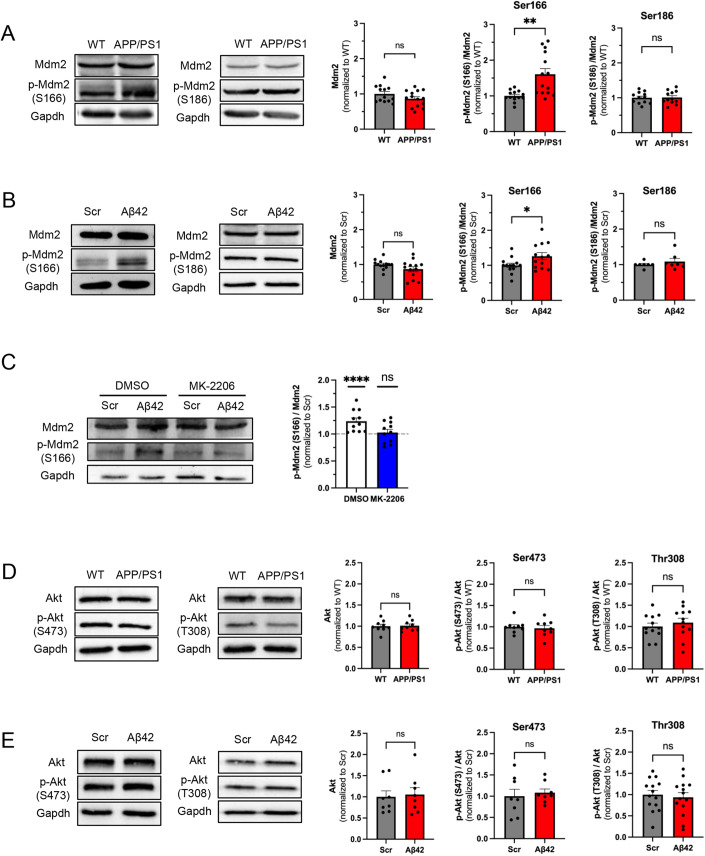
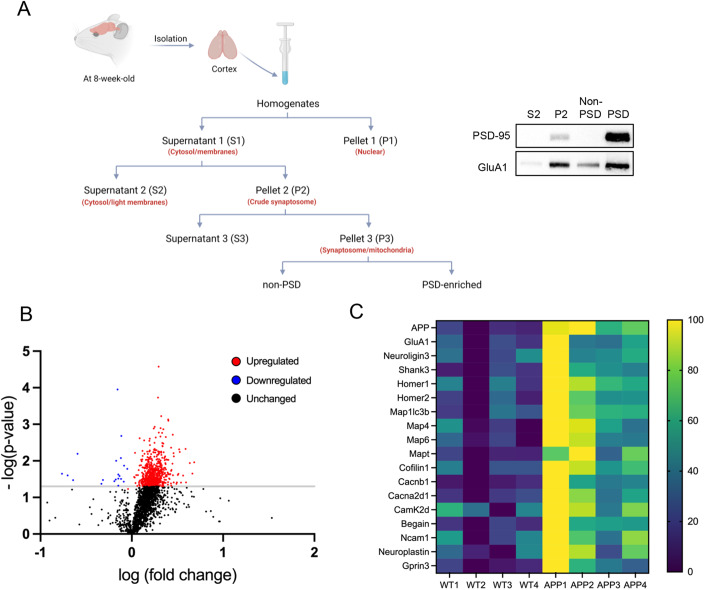
Accumulation of amyloid-beta (Aβ) can lead to the formation of aggregates that contribute to neurodegeneration in Alzheimer's disease (AD). Despite globally reduced neural activity during AD onset, recent studies have suggested that Aβ induces hyperexcitability and seizure-like activity during the early stages of the disease that ultimately exacerbate cognitive decline. However, the underlying mechanism is unknown. Here, we reveal an Aβ-induced elevation of postsynaptic density protein 95 (PSD-95) in cultured neurons in vitro and in an in vivo AD model using APP/PS1 mice at 8 weeks of age. Elevation of PSD-95 occurs as a result of reduced ubiquitination caused by Akt-dependent phosphorylation of E3 ubiquitin ligase murine-double-minute 2 (Mdm2). The elevation of PSD-95 is consistent with the facilitation of excitatory synapses and the surface expression of α-amino-3-hydroxy-5-methyl-4-isoxazolepropionic acid (AMPA) receptors induced by Aβ. Inhibition of PSD-95 corrects these Aβ-induced synaptic defects and reduces seizure activity in APP/PS1 mice. Our results demonstrate a mechanism underlying elevated seizure activity during early-stage Aβ pathology and suggest that PSD-95 could be an early biomarker and novel therapeutic target for AD.

Keywords: AMPA Receptors; Alzheimer’s Disease; Mdm2; PSD-95; Seizure.


Conflict of interest statement

The authors declare no competing interests.

Figures

Figure 1
Figure 1. Young APP/PS1 mice exhibit higher response to kainic acid-induced seizures.
(A) A schematic of seizure observation following intraperitoneal injections of kainic acid. (B) A summary chart of the modified Racine scoring scale for evaluation of seizures. (C) Quantification of susceptibility to stage 4 seizures (*P = 0.0329) (C1), highest seizure scores (**P = 0.0013) (C2) and lethality (**P = 0.0051) (C3) from 8-weeks-old APP/PS1 mice or their WT littermates intraperitoneally injected with kainic acid (15 mg/kg). n = 16 and 14 for WT and APP/PS1 mice, respectively. (D) Quantification of susceptibility to stage 4 seizures (*P = 0.03) (D1) and highest seizure scores (**P = 0.0034) (D2) from 8-weeks-old WT mice injected with amyloid-beta 1–42 (Aβ42) or scrambled peptide (Scr). Mice were intraperitoneally injected with kainic acid (15 mg/kg). n = 16 and 14 for WT and APP/PS1 mice, respectively. Data Information: significance was determined by Fisher’s exact test (seizure susceptibility and lethality) or Mann–Whitney U test (highest score). Data are represented as mean ± SEM with *P < 0.05 and **P < 0.01. Source data are available online for this figure.
Figure 2
Figure 2. Aβ promotes Akt-dependent Mdm2 phosphorylation in vitro and in vivo.
(A) Representative western blots from total brain lysate of APP/PS1 mice or their WT littermates at 8 weeks of age (left). Quantification of Mdm2 (P = 0.1442), phosphor (p)-Mdm2 at S166 (**P = 0.0019), and p-Mdm2 at S186 (P = 0.9126) (right). n = 12–14 for WT and APP/PS1 mice, respectively. (B) Representative western blots from WT primary cortical neuron cultures treated with amyloid-beta 1–42 (Aβ42; 1 µM) or scrambled peptide (Scr, 1 µM) for 2 h at DIV 12–14. (Left) Quantification of Mdm2 (P = 0.1169), phosphor (p)-Mdm2 at S166 (*P = 0.0363), and p-Mdm2 at S186 (P = 0.6125) (right). For Mdm2 and p-Mdm2 at S166, n = 13 from seven independent cultures for both Scr and Aβ42 groups. For p-Mdm2 at S186 n = 7 from three independent cultures. (C) Representative western blots from WT primary cortical neuron cultures treated with MK-2206 for 30 min, followed by Aβ42 or Scr (1 µM) for 2 h at DIV 12–14 (left). Quantification is performed by first normalizing p-Mdm2 at S166 to total Mdm2 levels, followed by normalizing Aβ42 group to Scr group within DMSO or MK-2206 group. n = 11 from six independent cultures for both Scr and Aβ42 groups. (D) Representative western blots from total brain lysate of APP/PS1 mice or their WT littermates at 8 weeks of age (left). Quantification of Akt (P = 0.8666), p-Akt at S473 (P = 0.6823), and p-Akt at T308 (P = 0.4952) (right). For Akt and p-Akt at S473, n = 9 for WT and APP/PS1 mice. For p-Akt at T308, n = 12 for WT and APP/PS1 mice. (E) Representative western blots from WT primary cortical neuron cultures treated with Aβ42 or Scr (1 µM) for 2 h at DIV 12–14 (left) Quantification of Akt (P = 0.8785), p-Akt at S473 (P = 0.6669), and p-Akt at T308 (P = 0.6716) (right). For Akt and p-Akt at S473, n = 8 from two independent cultures for Scr and Aβ42 groups. For p-Akt at T308, n = 14 from three independent cultures for Scr and Aβ42 groups. Data Information: Significance was determined by Student’s t test (D) or Mann–Whitney U test (A, B, C, E). Data are represented as mean ± SEM with *P < 0.05, **P < 0.01, ****P < 0.0001, ns non-significant. Source data are available online for this figure.
Figure 3
Figure 3. Aβ-induced Mdm2 phosphorylation leads to an elevation of PSD-95 via reduced ubiquitination.
(A) Quantification of p53 (P = 0.7976) and representative western blots from total brain lysate of APP/PS1 mice or their WT littermates at 8 weeks of age. n = 11 and 10 for WT and APP/PS1 mice, respectively. (B) Quantification of p53 (P = 0.6118) and representative western blots from WT primary cortical neuron cultures treated with amyloid-beta 1–42 (Aβ42; 1 µM) or scrambled peptide (Scr, 1 µM) for 2 h at DIV 12–14. n = 8 from two independent cultures for Ctrl and Aβ42 groups. (C) Quantification of PSD-95 (*P = 0.0477) and representative western blots from total brain lysate of APP/PS1 mice or their WT littermates at 8 weeks of age. n = 13 and 14 for WT and APP/PS1 mice, respectively. (D) Quantification of PSD-95 (***P = 0.0001) and representative western blots from WT primary cortical neuron cultures treated with Aβ42 (1 µM) or Scr (1 µM) for 2 h at DIV 12–14. n = 5 and 4 from three independent cultures for Scr and Aβ42 groups, respectively. (E) Quantification of interaction between PSD-95 and Mdm2 (P = 0.0084) after co-immunoprecipitation and representative western blots using lysates from APP/PS1 mice or their WT littermates at 8 weeks of age. n = 4 mice per genotype. (F) Quantification of interaction between PSD-95 and Mdm2 (*P = 0.0221) after co-immunoprecipitation and representative western blots using lysates from WT primary cortical neuron cultures treated with Aβ42 or Scr (1 µM) for 2 h at DIV 12–14. n = 7 and 6 from two independent cultures for Scr and Aβ42 groups, respectively. (G) Representative western blots of Ubiquitin and PSD-95 after immunoprecipitation with anti-PSD-95 antibody using lysates from APP/PS1 mice or their WT littermates at 8 weeks of age. Quantification is performed by first normalizing ubiquitinated PSD-95 (IP: PSD-95, IB: Ub) to immunoprecipitated PSD-95 (IP: PSD-95, IB: PSD-95), followed by normalizing APP/PS1 group to WT group (**P = 0.0081). n = 4 mice per genotype. (H) Representative western blots of Ubiquitin and PSD-95 after immunoprecipitation with anti-PSD-95 antibody using lysates from WT primary cortical neuron cultures treated with Aβ42 or Scr (1 µM) for 2 h at DIV 12–14. Quantification is performed by first normalizing ubiquitinated PSD-95 (IP: PSD-95, IB: Ub) to immunoprecipitated PSD-95 (IP: PSD-95, IB:PSD-95), followed by normalizing Aβ42 group to Scr group (***P = 0.0002). n = 5 from three independent cultures for both groups. Data Information: Significance was determined by Student’s t test (AE, G, H) or Mann–Whitney U test (F). Data are represented as mean ± SEM with *P < 0.05, **P < 0.01, ***P < 0.001, ns non-significant. Source data are available online for this figure.
Figure 4
Figure 4. Aβ-induced elevation of PSD-95 leads to enrichment of a variety of postsynaptic proteins at PSD.
(A) A schematic of PSD fractionation (top) and an example of western blots demonstrating the results of PSD enrichment (bottom). (B) A volcano plot following RNA sequencing analysis using PSD fractions from four APP/PS1 mice and four WT littermates at 8 weeks of age. The raw value of each gene is normalized to the levels of PSD-95 from the same sample and Student’s t test was used to determine the P value of each gene between WT and APP/PS1 mice where differences are considered significant when P < 0.05. (C) A heatmap showing 18 significantly elevated postsynaptic or postsynapse-related proteins in PSD fractions from APP/PS1 mice. Source data are available online for this figure.
Figure 5
Figure 5. Aβ induces PSD-95-dependent elevation of synapse numbers.
(A) Immunocytochemistry from WT primary cortical neuron cultures treated with Aβ1-42 (Aβ42, 1 µM) or scrambled Aβ peptide (Scr, 1 µM) for 2 h at DIV 12–14 showing postsynaptic marker PSD-95 (red), presynaptic marker Synapsin-I (green), dendritic marker MAP2 (blue), and colocalization of PSD-95 and Synapsin-I (left). Quantification of colocalized synaptic puncta number (**P = 0.0069), PSD-95 puncta number (****P < 0.0001), and Synapsin-I puncta number (***P = 0.0001) (right). n = 14 cells from two independent cultures treated with Scr or Aβ42. (B) Immunocytochemistry from PSD-95+/− (Het) primary cortical neuron cultures treated with Aβ42 (1 µM) or Scr (1 µM) for 2 h at DIV 12–14 showing postsynaptic marker PSD-95 (red), presynaptic marker Synapsin-I (green), dendritic marker MAP2 (blue), and colocalization of PSD-95 and Synapsin-I (left). Quantification of colocalized synaptic puncta number (P = 0.8249), PSD-95 puncta number (P = 0.302), and Synapsin-I puncta number (P = 0.6488) (right). n = 12–15 cells from two independent cultures treated with Scr or Aβ42. (C) Immunocytochemistry from PSD-95−/− (KO) primary cortical neuron cultures transduced with control lentivirus at DIV 9–10 and treated with Aβ42 or Scr (1 µM) for 2 h at DIV 12–14 showing postsynaptic marker Homer1b/c (red), presynaptic marker Synapsin-I (green), and colocalization of Homer1b/c and Synapsin-I (left). Quantification of colocalized synaptic puncta number (P = 0.9962), Homer1b/c puncta number (P = 0.5814), and Synapsin-I puncta number (P = 0.4667) (right). n = 16–17 cells from two independent cultures treated with Scr or Aβ42. (D) Immunocytochemistry from PSD-95−/− (KO) primary cortical neuron cultures transduced with PSD-95 lentivirus at DIV 9–10 and treated with Aβ42 or Scr (1 µM) for 2 h at DIV 12–14 showing postsynaptic marker Homer1b/c (red), presynaptic marker Synapsin-I (green), and colocalization of Homer1b/c and Synapsin-I (left). Quantification of colocalized synaptic puncta number (****P < 0.0001) Homer1b/c puncta number (***P = 0.0001), and Synapsin-I puncta number (***P = 0.0009) (right). n = 16–17 cells from two independent cultures treated with Scr or Aβ42. Data Information: significance was determined by Student’s t test (AC) or Mann–Whitney U test (D). Data are represented as mean ± SEM with *P < 0.05, **P < 0.01, ***P < 0.001, ****P < 0.0001, ns: non-significant. Scale bar: 5 μm. Source data are available online for this figure.
Figure 6
Figure 6. Aβ promotes PSD-95-dependent surface expression of AMPA receptors.
(A, B) Immunocytochemistry and quantification showing dendritic marker MAP2, total (t) and surface (s) GluA1 (A) and GluA2 (B) from WT primary cortical neuron cultures treated with Aβ1-42 (Aβ42, 1 µM) or scrambled peptide (Scr, 1 µM) for 2 h at DIV 12–14. For GluA1, *P = 0.0192 for surface level, P = 0.42 for total level, and n = 17 and 18 cells from two independent cultures treated with Scr and Aβ42, respectively. For GluA2, **P = 0.0025 for surface level, P = 0.1584 for total level, and n = 16 and 20 cells from two independent cultures treated with Scr and Aβ42, respectively. (C, D) Immunocytochemistry and quantification showing dendritic marker MAP2, total (t) and surface (s) GluA1 (C) and GluA2 (D) from PSD-95+/− primary cortical neuron cultures treated with Aβ1-42 (Aβ42, 1 µM) or scrambled peptide (Scr, 1 µM) for 2 h at DIV 12–14. For GluA1, P = 0.4539 for surface level, P = 0.1311 for total level, and n = 14 and 13 cells from two independent cultures treated with Scr and Aβ42, respectively. For GluA2, P = 0.6643 for surface level, P = 0.659 for total level, and n = 13 and 14 cells from two independent cultures treated with Scr and Aβ42, respectively. Data Information: significance was determined by Student’s t test (A, C) or Mann–Whitney U test (B, D). Data are represented as mean ± SEM with *P < 0.05, **P < 0.01, ns non-significant. Scale bar: 5 μm. Source data are available online for this figure.
Figure 7
Figure 7. PSD-95 suppression in APP/PS1 mice significantly reduces seizure severity.
(A) Representative western blots of PSD-95 and Gapdh from the brain lysates of a group of WT, PSD-95+/-, APP/PS1, and APP/PS1 × PSD-95+/− littermate mice. (B) Quantification of susceptibility to stage 4 seizures and lethality from 8-weeks-old WT, PSD-95+/−, APP/PS1, and APP/PS1 × PSD-95+/− mice intraperitoneally injected with kainic acid (30 mg/kg). For seizure susceptibility, **P = 0.0016 and *P = 0.0154. For lethality, **P = 0.0048 and ****P < 0.0001. n = 11–14 mice as indicated. (C) Quantification of highest seizure scores (*P = 0.0496) and latency to stage 4 seizures (**P = 0.0031) from 8-weeks-old APP/PS1, and APP/PS1 × PSD-95+/− mice intraperitoneally injected with kainic acid (30 mg/kg). n = 12 and 14 for APP/PS1, and APP/PS1 × PSD-95+/− mice, respectively. Sixty minutes in latency to score 4 means the mice without showing score 4 or above. (D) Quantification of susceptibility to stage 4 seizures (P > 0.9999), latency to stage 4 seizures (P = 0.1552), highest seizure scores (P > 0.9999), and lethality (P > 0.9999) from 8-weeks-old WT and PSD-95+/− mice intraperitoneally injected with kainic acid (45 mg/kg). n = 8 mice for both WT and PSD-95+/− mice. (E) A working model illustrating Mdm2-mediated ubiquitination of PSD-95 reduces seizure susceptibility while impairment of that leads to elevated seizure susceptibility during early Aβ pathology. Data Information: significance was determined by Fisher’s exact test (seizure susceptibility and lethality) or Mann–Whitney U test (highest score and latency to score 4). Data are represented as mean ± SEM with *P < 0.05 and **P < 0.01, ****P < 0.0001, ns non-significant. Source data are available online for this figure.
Figure EV1
Figure EV1. Seizure severity in young APP/PS1 does not exhibit sex differences.
(A, B) Quantification of seizure susceptibility, lethality, and highest score in male and female APP/PS1 mice. Two different doses of 15 mg/kg (A) and 30 mg/kg (B) were intraperitoneally injected into mice. Significance was determined by Fisher’s exact test (seizure susceptibility; P > 0.9999 for both 15 and 30 mg/kg and lethality; P > 0.9999 for both 15 and 30 mg/kg) or Mann–Whitney U test (highest score; P = 0.7308 for 15 mg/kg and P > 0.9999 for 30 mg/kg). Data are represented as mean ± SEM with ns: non-significant. Source data are available online for this figure.
Figure EV2
Figure EV2. Aβ1-42 does not alter the interaction between eEF1α and Mdm2.
Quantification of interaction between eEF1α and Mdm2 after co-immunoprecipitation and representative western blots using lysates from WT primary cortical neuron cultures treated with Aβ1-42 (Aβ42, 1 µM) or scrambled Aβ peptide (Scr, 1 µM) for 2 h at DIV 12–14. n = 10 at least from three independent cultures for both Scr and Aβ42 groups. Significance was determined by Student’s t test (P = 0.4605). Data are represented as mean ± SEM with ns: non-significant. Source data are available online for this figure.
Figure EV3
Figure EV3. Aβ1-42 does not promote the total level of Synapsin-I.
Quantification of Synapsin-I and representative western blots from WT primary cortical neuron cultures treated with amyloid-beta 1–42 (Aβ42; 1 µM) or scrambled Aβ peptide (Scr, 1 µM) for 2 h at DIV 12–14. n = 8 and 7 for Scr and Aβ42 groups, respectively. Significance was determined by Student’s t test (P = 0.3604). Data are represented as mean ± SEM with ns: non-significant. Source data are available online for this figure.
Figure EV4
Figure EV4. No changes in mEPSCs were observed in hippocampal CA1 neurons in PSD-95-/+ or APP/PS1 mice.
Voltage-clamp recordings of mEPSCs from CA1 pyramidal cells in acute hippocampal slice of WT (n = 16 cells from 6 mice), APP/PS1 (n = 17 cells from 7 mice), PSD−/+ (n = 17 cells from 6 mice), and APP/PS1 PSD−/+ (16 cells from 6 mice) mice. Holding potential was −70 mV. Representative mEPSC traces (left) and quantification of mEPSC amplitude and frequency (right) are shown. Data were analyzed by one-way ANOVA with Tukey test and presented as mean ± SEM with NS: non-significant. Source data are available online for this figure.

Similar articles

Cited by

References

    1. Abramov E, Dolev I, Fogel H, Ciccotosto GD, Ruff E, Slutsky I. Amyloid-β as a positive endogenous regulator of release probability at hippocampal synapses. Nat Neurosci. 2009;12:1567–1576. doi: 10.1038/nn.2433. - DOI - PubMed
    1. Ajoolabady A, Lindholm D, Ren J, Pratico D. ER stress and UPR in Alzheimer’s disease: mechanisms, pathogenesis, treatments. Cell Death Dis. 2022;13:706. doi: 10.1038/s41419-022-05153-5. - DOI - PMC - PubMed
    1. Araki Y, Hong I, Gamache TR, Ju S, Collado-Torres L, Shin JH, Huganir RL. SynGAP isoforms differentially regulate synaptic plasticity and dendritic development. eLife. 2020;9:e56273. doi: 10.7554/eLife.56273. - DOI - PMC - PubMed
    1. Bakker A, Krauss GL, Albert MS, Speck CL, Jones LR, Stark CE, Yassa MA, Bassett SS, Shelton AL, Gallagher M. Reduction of hippocampal hyperactivity improves cognition in amnestic mild cognitive impairment. Neuron. 2012;74:467–474. doi: 10.1016/j.neuron.2012.03.023. - DOI - PMC - PubMed
    1. Bateman RJ, Xiong C, Benzinger TLS, Fagan AM, Goate A, Fox NC, Marcus DS, Cairns NJ, Xie X, Blazey TM, et al. Clinical and biomarker changes in dominantly inherited Alzheimer’s disease. New Engl J Med. 2012;367:795–804. doi: 10.1056/NEJMoa1202753. - DOI - PMC - PubMed