

Untargeted metabolomic profiling of serum from client-owned cats with early and late-stage chronic kidney disease
- PMID: 38413739
- PMCID: PMC10899575
- DOI: 10.1038/s41598-024-55249-5
Untargeted metabolomic profiling of serum from client-owned cats with early and late-stage chronic kidney disease
Abstract
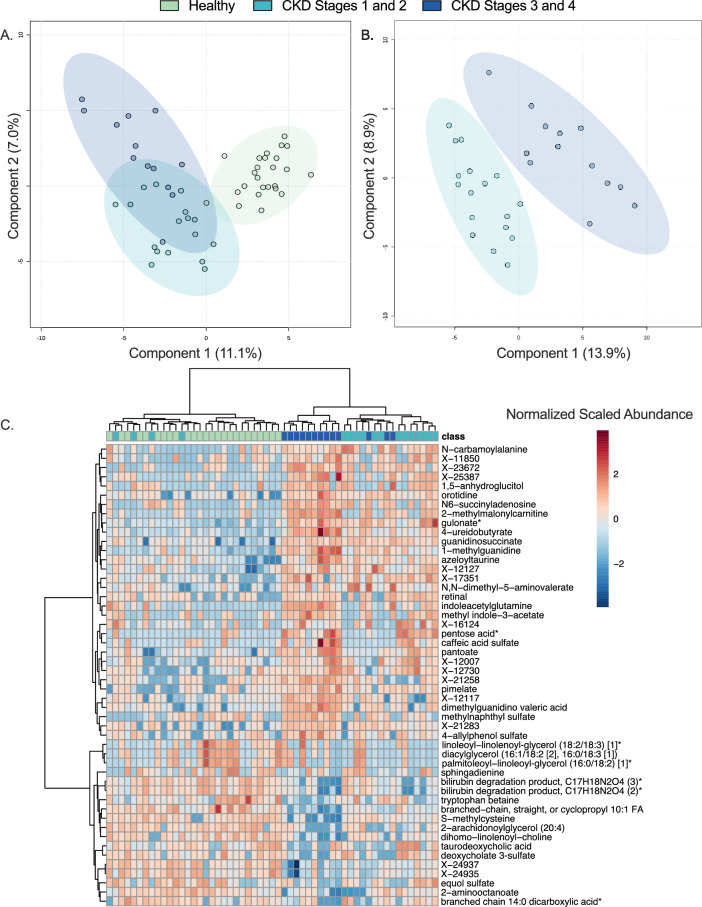
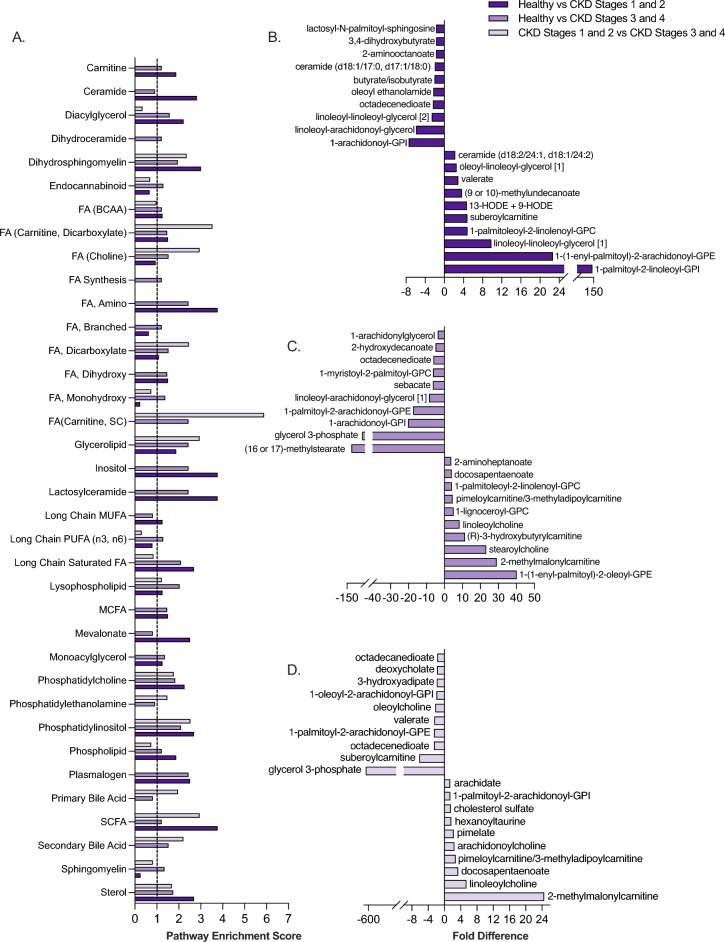
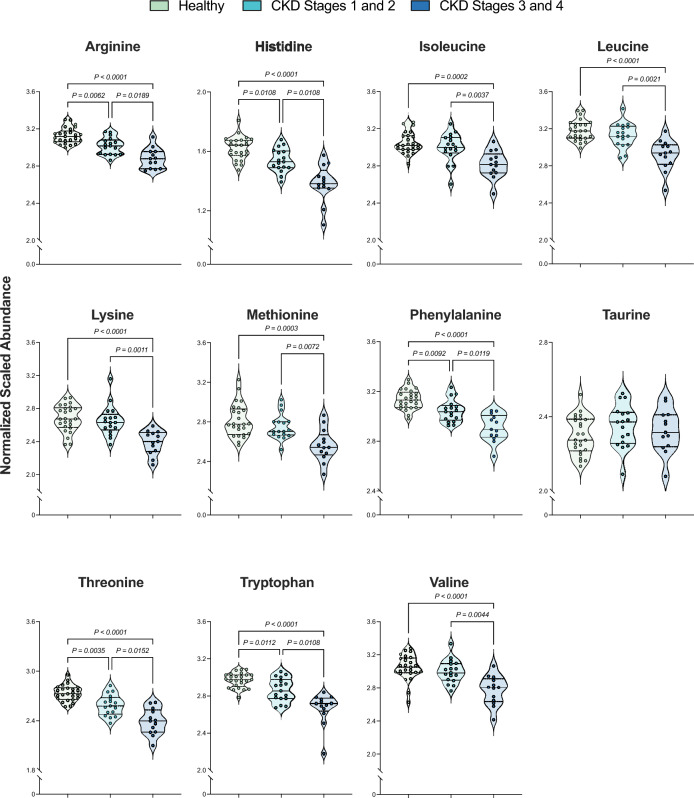
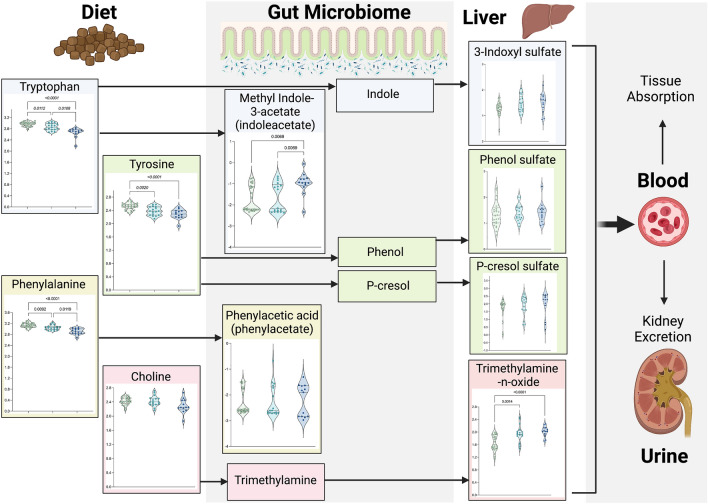
Evaluation of the metabolome could discover novel biomarkers of disease. To date, characterization of the serum metabolome of client-owned cats with chronic kidney disease (CKD), which shares numerous pathophysiological similarities to human CKD, has not been reported. CKD is a leading cause of feline morbidity and mortality, which can be lessened with early detection and appropriate treatment. Consequently, there is an urgent need for early-CKD biomarkers. The goal of this cross-sectional, prospective study was to characterize the global, non-targeted serum metabolome of cats with early versus late-stage CKD compared to healthy cats. Analysis revealed distinct separation of the serum metabolome between healthy cats, early-stage and late-stage CKD. Differentially abundant lipid and amino acid metabolites were the primary contributors to these differences and included metabolites central to the metabolism of fatty acids, essential amino acids and uremic toxins. Correlation of multiple lipid and amino acid metabolites with clinical metadata important to CKD monitoring and patient treatment (e.g. creatinine, muscle condition score) further illustrates the relevance of exploring these metabolite classes further for their capacity to serve as biomarkers of early CKD detection in both feline and human populations.
© 2024. The Author(s).
Conflict of interest statement
N.J.N. has no competing interests to declare. S.S. is a research consultant for IDEXX Laboratories, Inc. and has previous work funded by Nestle Purina and IDEXX Laboratories, Inc. She has received a speaker honorarium from Royal Canin, IDEXX Laboratories, Inc., and Boehringer-Ingelheim. Preliminary results from this analysis were presented in abstract form at the 2022 Annual Forum of American College of Veterinary Internal Medicine, held in Austin, Texas (ePoster NU30: Untargeted Metabolomic Profiling of Serum from Cats with Chronic Kidney Disease). J.Q.’s work has been funded by EveryCat Health Foundation, Morris Animal Foundation, Nestle Purina, Trivium Vet, Zoetis. She has received compensation as a member of the scientific advisory board of Nestle Purina, Elanco, Zoetis. She also has consulted or served as a key opinion leader for Boehringer Ingelheim, Dechra, Elanco, Gallant, Heska, Hill’s, IDEXX, Nestle Purina, Royal Canin, SN Biomedical, Vetoquinol, Zoetis and received compensation. J.A.W.’s laboratory has been funded by EveryCat Health Foundation, Morris Animal Foundation, American Kennel Club’s Canine Health Foundation, Nestle Purina, FDA, and National Institutes of Health. She has received speaker honorariums from Royal Canin, Nestle Purina, and DVM360.
Figures
Similar articles
-
Urinary liver-type fatty acid-binding protein in clinically healthy elderly cats: Evaluation of its potential to detect IRIS stage 1 chronic kidney disease and borderline proteinuria.Vet Med Sci. 2023 Jan;9(1):3-12. doi: 10.1002/vms3.1003. Epub 2022 Nov 23. Vet Med Sci. 2023. PMID: 36418182 Free PMC article.
-
The fecal microbiome and serum concentrations of indoxyl sulfate and p-cresol sulfate in cats with chronic kidney disease.J Vet Intern Med. 2019 Mar;33(2):662-669. doi: 10.1111/jvim.15389. Epub 2018 Dec 18. J Vet Intern Med. 2019. PMID: 30561098 Free PMC article.
-
Preliminary evaluation of fecal fatty acid concentrations in cats with chronic kidney disease and correlation with indoxyl sulfate and p-cresol sulfate.J Vet Intern Med. 2020 Jan;34(1):206-215. doi: 10.1111/jvim.15634. Epub 2019 Nov 6. J Vet Intern Med. 2020. PMID: 31693251 Free PMC article.
-
Renal biomarkers in cats: A review of the current status in chronic kidney disease.J Vet Intern Med. 2022 Mar;36(2):379-396. doi: 10.1111/jvim.16377. Epub 2022 Feb 26. J Vet Intern Med. 2022. PMID: 35218249 Free PMC article. Review.
-
Feline CKD: Diagnosis, staging and screening - what is recommended?J Feline Med Surg. 2013 Sep;15 Suppl 1(1 Suppl):15-27. doi: 10.1177/1098612X13495235. J Feline Med Surg. 2013. PMID: 23999183 Free PMC article. Review.
Cited by
-
Continuous intake of galacto-oligosaccharides containing syrup contributes to maintaining the health of household cats by modulating their gut microbiota.Biosci Microbiota Food Health. 2025;44(2):137-145. doi: 10.12938/bmfh.2024-082. Epub 2024 Dec 17. Biosci Microbiota Food Health. 2025. PMID: 40171393 Free PMC article.
-
Alterations in gut-derived uremic toxins before the onset of azotemic chronic kidney disease in cats.J Vet Intern Med. 2025 Jan-Feb;39(1):e17289. doi: 10.1111/jvim.17289. J Vet Intern Med. 2025. PMID: 39739435 Free PMC article.
-
Metabolomic Changes Associated with AGXT2 Genotype Variants and Stone Formation in a Colony of Cats.Genes (Basel). 2024 Sep 27;15(10):1264. doi: 10.3390/genes15101264. Genes (Basel). 2024. PMID: 39457388 Free PMC article.
-
Metabolomics reveals alterations in gut-derived uremic toxins and tryptophan metabolism in feline chronic kidney disease.Vet Q. 2025 Dec;45(1):1-15. doi: 10.1080/01652176.2024.2447601. Epub 2025 Jan 2. Vet Q. 2025. PMID: 39745207 Free PMC article.
-
Impaired renal transporter gene expression and uremic toxin excretion as aging hallmarks in cats with naturally occurring chronic kidney disease.Aging (Albany NY). 2024 Dec 20;16(22):13588-13607. doi: 10.18632/aging.206176. Epub 2024 Dec 20. Aging (Albany NY). 2024. PMID: 39729035 Free PMC article.
References
-
- IRIS Staging of CKD. http://www.iris-kidney.com/pdf/2_IRIS_Staging_of_CKD_2023.pdf. Accessed 24 Sep 2023.
MeSH terms
Substances
LinkOut - more resources
Full Text Sources
Medical
Miscellaneous
