. 2024 Feb 27;8(1):52.
doi: 10.1038/s41698-024-00543-8.

A functional personalised oncology approach against metastatic colorectal cancer in matched patient derived organoids

Affiliations

A functional personalised oncology approach against metastatic colorectal cancer in matched patient derived organoids

Dexter Kai Hao Thng et al. NPJ Precis Oncol. .

Abstract

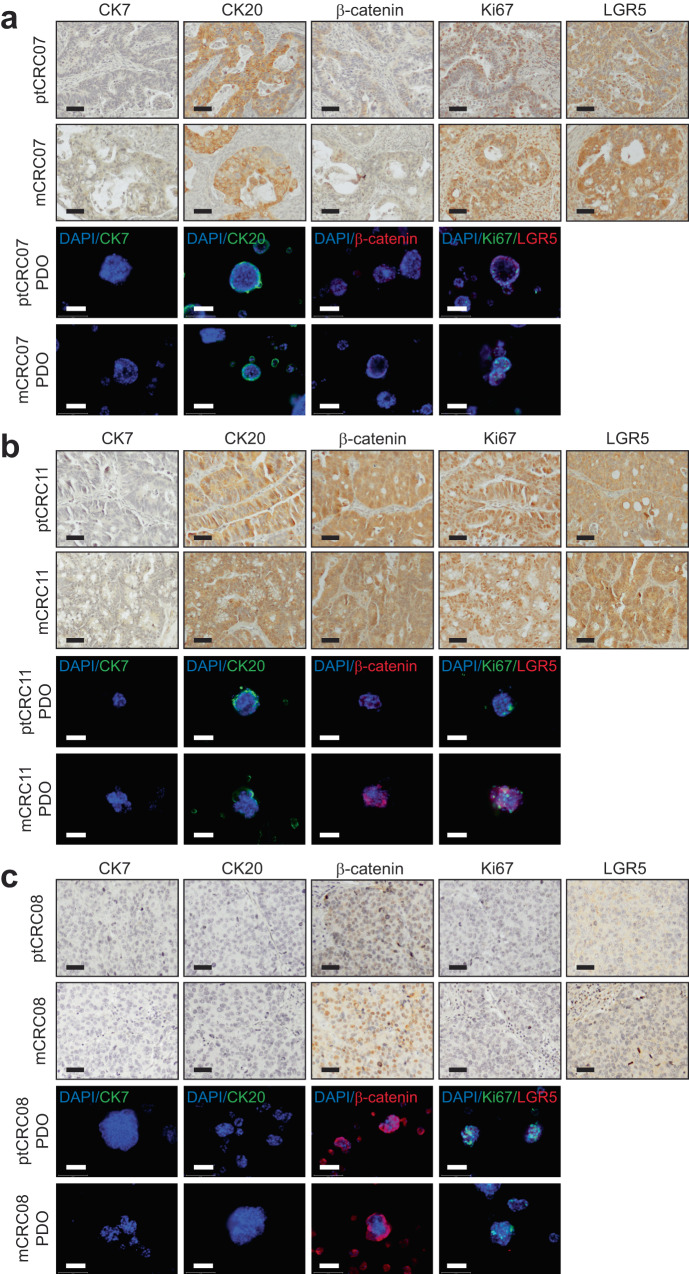
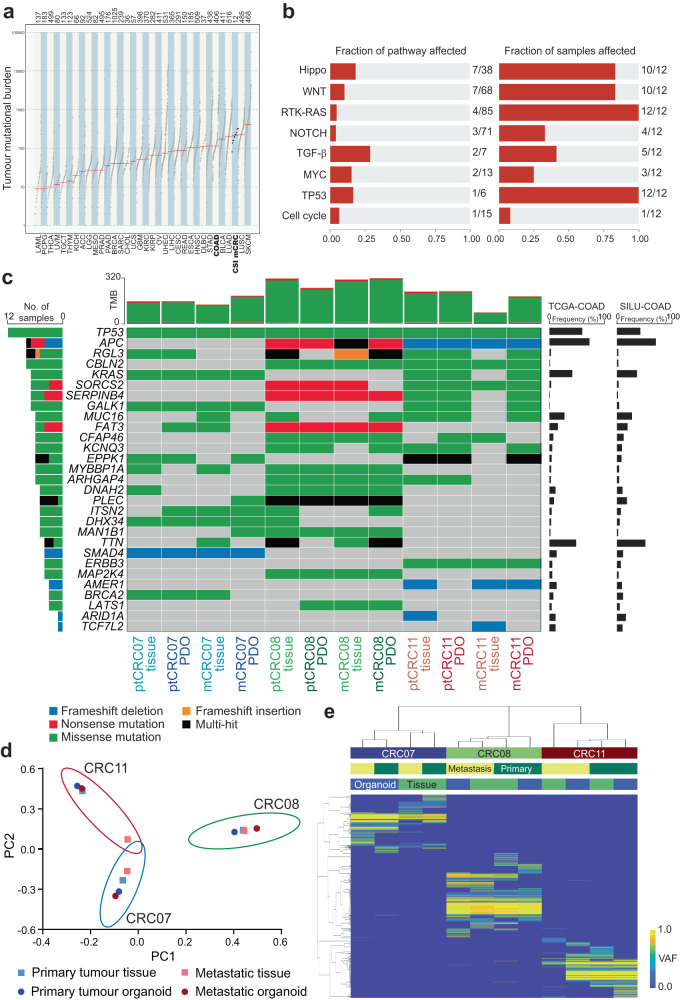
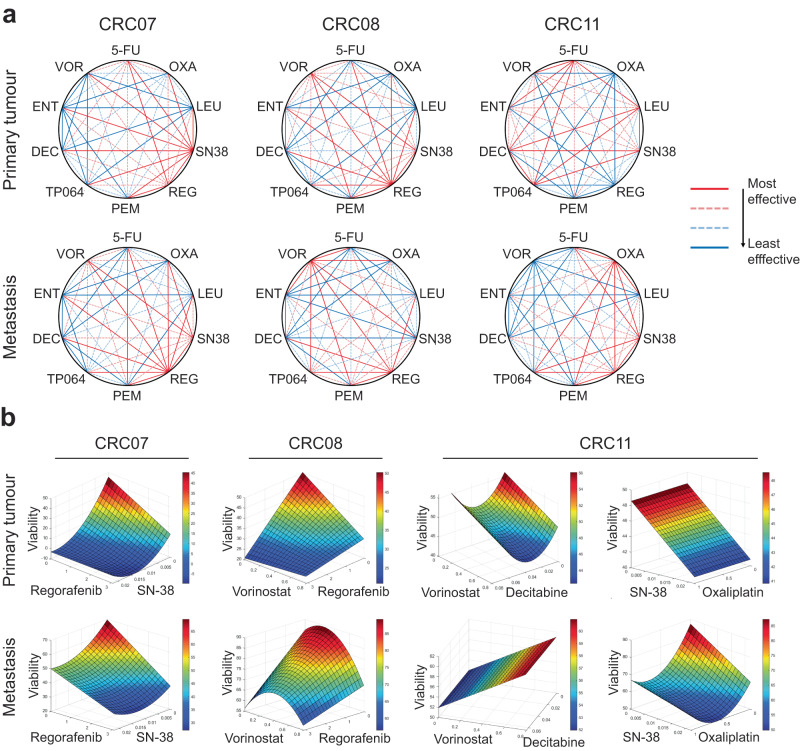
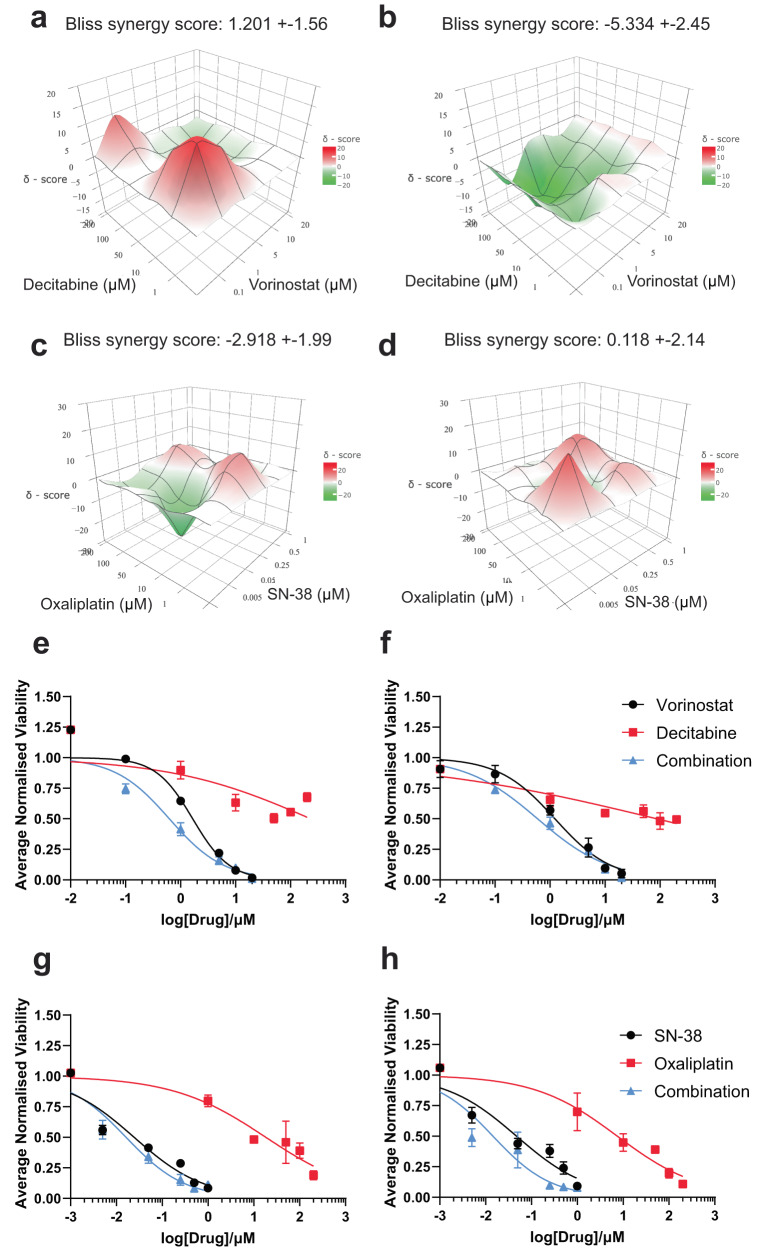
Globally, colorectal cancer (CRC) is the third most frequently occurring cancer. Progression on to an advanced metastatic malignancy (metCRC) is often indicative of poor prognosis, as the 5-year survival rates of patients decline rapidly. Despite the availability of many systemic therapies for the management of metCRC, the long-term efficacies of these regimens are often hindered by the emergence of treatment resistance due to intratumoral and intertumoral heterogeneity. Furthermore, not all systemic therapies have associated biomarkers that can accurately predict patient responses. Hence, a functional personalised oncology (FPO) approach can enable the identification of patient-specific combinatorial vulnerabilities and synergistic combinations as effective treatment strategies. To this end, we established a panel of CRC patient-derived organoids (PDOs) as clinically relevant biological systems, of which three pairs of matched metCRC PDOs were derived from the primary sites (ptCRC) and metastatic lesions (mCRC). Histological and genomic characterisation of these PDOs demonstrated the preservation of histopathological and genetic features found in the parental tumours. Subsequent application of the phenotypic-analytical drug combination interrogation platform, Quadratic Phenotypic Optimisation Platform, in these pairs of PDOs identified patient-specific drug sensitivity profiles to epigenetic-based combination therapies. Most notably, matched PDOs from one patient exhibited differential sensitivity patterns to the rationally designed drug combinations despite being genetically similar. These findings collectively highlight the limitations of current genomic-driven precision medicine in guiding treatment strategies for metCRC patients. Instead, it suggests that epigenomic profiling and application of FPO could complement the identification of novel combinatorial vulnerabilities to target synchronous ptCRC and mCRC.


Conflict of interest statement

EKHC is a shareholder of Kyan Technologies. The remaining authors declare no competing interests.

Figures

Fig. 1
Fig. 1. Establishment of metCRC patient-derived organoids recapitulates histological architecture of primary tissues.
a Establishment rates of CRC PDOs from patient samples derived from primary and metastatic lesions. b Establishment rates of ptCRC PDOs based on tumour origin. c Establishment rates of mCRC PDOs stratified according to metastatic site. d Brightfield images of 14 generated CRC PDO lines, including three pairs of matched metCRC PDOs. Black scale bar = 50 µm; blue scale bar = 100 µm; red scale bar = 150 µm. e Summary of clinical data for metastatic colorectal cancer patients from which matched PDOs were established. (FOLFOXIRI, 5-fluorouracil + leucovorin + oxaliplatin + irinotecan; XELOX, capecitabine + oxaliplatin). f H&E staining of matched metCRC parental tumours and PDOs derived from the corresponding tissues. Black scale bar = 50 µm; white scale bar = 100 µm.
Fig. 2
Fig. 2. metCRC PDOs retain expression patterns of common CRC markers of parental tissues.
a Immunohistochemistry staining of CK7, CK20, β-catenin, Ki67, and LGR5 in matched primary tumours and metastases, and immunofluorescent staining of the respective markers in the corresponding PDOs for three metCRC patients, CRC07, b CRC11 and c CRC08. Scale bars = 100 µm.
Fig. 3
Fig. 3. Mutational spectrum of CRC and parental tissues were represented in metCRC PDOs.
a Tumour mutational burden of the matched metCRC tissues and PDOs used in this study (CSI-mCRC), and the GDC TCGA patient cohorts grouped by cancer type. CRC patient cohorts, GDC TCGA-COAD and CSI-mCRC, are bolded. b Frequency of genetic alterations found in common oncogenic pathways observed in our cohort of metCRC patients and corresponding PDOs. c Summary of most frequent mutations identified in pairs of metCRC parental tumours and PDOs. Representative genes known to be mutated in CRC are included. Mutation frequency of these genes in the GDC TCGA-COAD and Sidra–Leiden University Medical Center (SILU)-COAD cohorts are also presented for comparison. d Principal component analysis of patient tumours and PDOs according to the VAF of mutations present in the cohort. Closely related samples are grouped together. e Heatmap of patient tumour tissues and PDOs clustered by the VAF of 1199 unique single nucleotide polymorphisms and insertion/deletion mutations.
Fig. 4
Fig. 4. metCRC PDOs demonstrate similar drug responses.
a Summary of IC50 values when PDOs were grouped according to tumour type. Matched PDOs were highlighted in blue (CRC07), green (CRC08) and red (CRC11). Two-way ANOVA and Šidák’s pairwise comparisons were performed as recommended (n.s. not significant; *p < 0.05; **p < 0.01; ***p < 0.001; ****p < 0.0001). Data represented as means ± SD (n = 6 and 4 for primary tumour and metastasis PDOs respectively). b Overview of IC50 when metastases PDOs were stratified based on metastatic site. Two-way ANOVA and Šidák’s pairwise comparisons were performed as recommended, but no statistical difference was identified between liver and ovarian metastases-derived PDOs for all 10 drugs. Data represented as means ± SD (n = 2). (5-FU 5-fluorouracil, OXA oxaliplatin, LEU leucovorin, SN38 SN-38, REG regorafenib, PEM pemrametostat, TP064 TP-064, DEC decitabine, ENT entinostat, VOR vorinostat).
Fig. 5
Fig. 5. Matched metCRC PDOs exhibit differential sensitivity patterns to QPOP-optimised drug combinations.
a Representative polygonograms depicting the effects of all two-drug combinations between 5-fluorouracil (5-FU), oxaliplatin (OXA), leucovorin (LEU), SN-38 (SN38), regorafenib (REG), pemrametostat (PEM), TP-064 (TP064), decitabine (DEC), entinostat (ENT) and vorinostat (VOR) in matched metCRC PDOs (n = 2; Supplementary Fig. 6). The coloured lines represent the ranked percentile of the geometric means for the viabilities of the PDOs in response to each combination. (Red, most effective, 75–100th percentile; pink and dotted, second most effective, 50–75th percentile; light blue and dotted, second least effective, 25–50th percentile; dark blue, least effective, 0–25th percentile). b Representative parabolic response surface maps illustrating the projected efficacy of the QPOP-optimised drug pairs on organoid viability for each respective pair of matched metCRC PDOs (n = 2; Supplementary Fig. 6).
Fig. 6
Fig. 6. CRC07 and CRC08 PDOs were sensitive to regorafenib in combination with SN-38 and vorinostat combination therapy respectively.
a Bliss synergy maps representing the synergy landscape for regorafenib-SN-38 in ptCRC07 and b mCRC07 over the entire dose matrix. Bliss synergy scores are represented as means of the entire search space ± 95% confidence interval. c Dose-response curves of regorafenib and SN-38 for ptCRC07 and d mCRC07 PDOs when treated as monotherapies and combination therapy. e Bliss synergy maps for regorafenib in combination with vorinostat in ptCRC08 and f mCRC08 over the entire dose matrix. Bliss synergy scores are represented as means of the entire search space ± 95% confidence interval. g Dose-response curves of ptCRC08 and h mCRC08 organoids when treated with regorafenib and vorinostat singly and in combination.
Fig. 7
Fig. 7. ptCRC11 and mCRC11 PDOs demonstrate different phenotypic response to QPOP-optimised combinations.
a Bliss synergy maps for decitabine and vorinostat in ptCRC11 and b mCRC11 over the entire dose matrix. Bliss synergy scores are represented as means of the entire search space ± 95% confidence interval. c Synergy landscape for oxaliplatin-SN-38 in ptCRC11 and d mCRC11 over the entire dose matrix. Bliss synergy scores are represented as means of the entire search space ± 95% confidence interval. e Dose-response curves of decitabine and vorinostat in ptCRC11 and f mCRC11 organoids when administered singly and in combination. g Dose-response curves of ptCRC11 and h mCRC11 PDOs following oxaliplatin and SN-38 treatment alone and concurrently.

References

    1. Sung H, et al. Global Cancer Statistics 2020: GLOBOCAN estimates of incidence and mortality worldwide for 36 cancers in 185 countries. CA Cancer J. Clin. 2021;71:209–249. doi: 10.3322/caac.21660. - DOI - PubMed
    1. Siegel R, Desantis C, Jemal A. Colorectal cancer statistics, 2014. CA Cancer J. Clin. 2014;64:104–117. doi: 10.3322/caac.21220. - DOI - PubMed
    1. Ciardiello F, et al. Clinical management of metastatic colorectal cancer in the era of precision medicine. CA Cancer J. Clin. 2022;72:372–401. doi: 10.3322/caac.21728. - DOI - PubMed
    1. O’Connell JB, Maggard MA, Ko CY. Colon cancer survival rates with the new American Joint Committee on Cancer sixth edition staging. J. Natl Cancer Inst. 2004;96:1420–1425. doi: 10.1093/jnci/djh275. - DOI - PubMed
    1. Yoshino T, et al. Pan-Asian adapted ESMO consensus guidelines for the management of patients with metastatic colorectal cancer: a JSMO-ESMO initiative endorsed by CSCO, KACO, MOS, SSO and TOS. Ann. Oncol. 2018;29:44–70. doi: 10.1093/annonc/mdx738. - DOI - PubMed