. 2024 Apr;4(4):491-509.
doi: 10.1038/s43587-024-00578-3. Epub 2024 Feb 27.

Inhibition of S6K lowers age-related inflammation and increases lifespan through the endolysosomal system

Affiliations

Inhibition of S6K lowers age-related inflammation and increases lifespan through the endolysosomal system

Pingze Zhang et al. Nat Aging. 2024 Apr.

Abstract

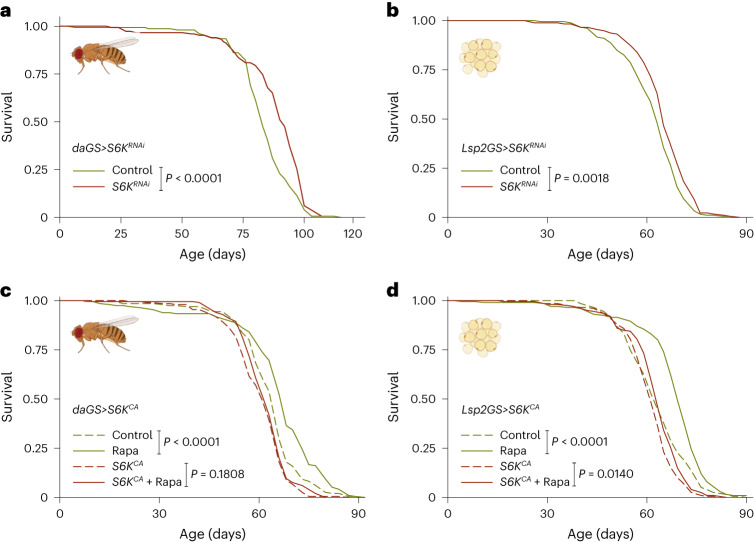
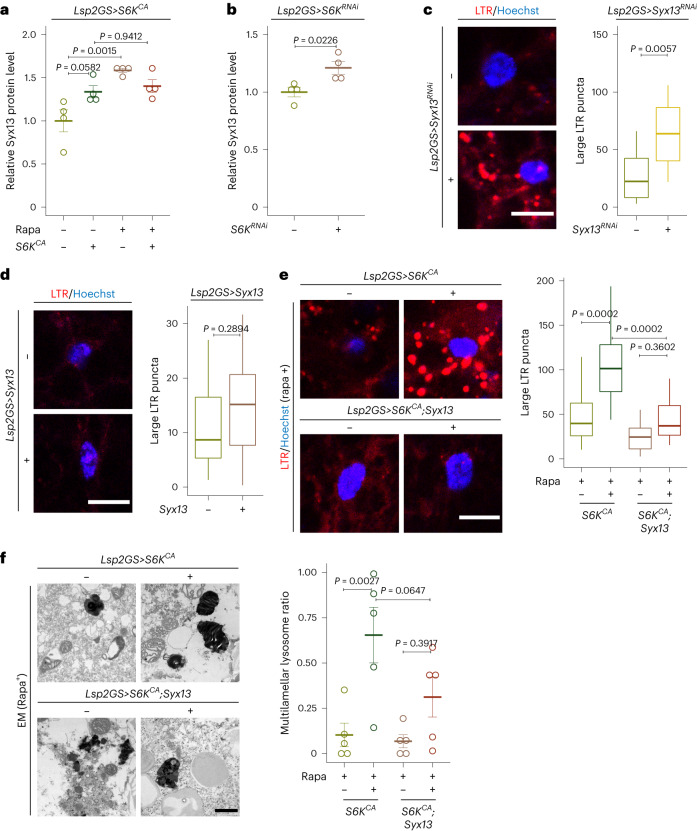
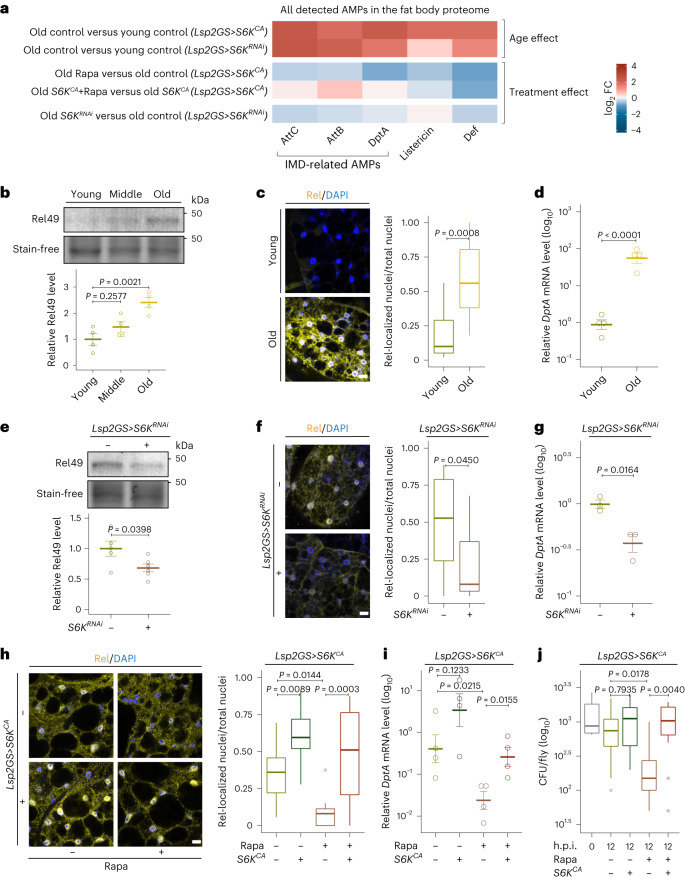
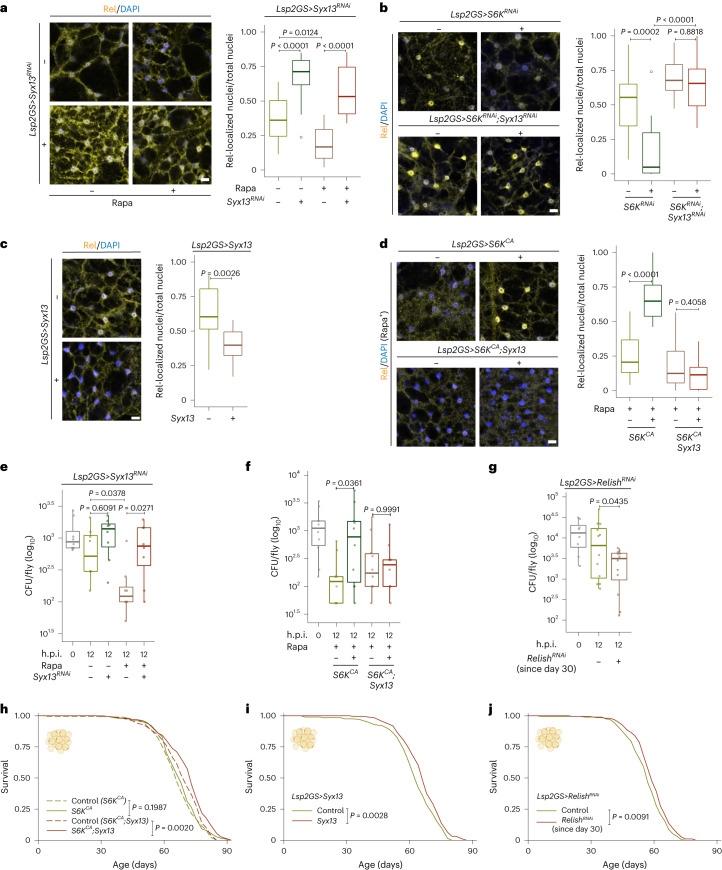
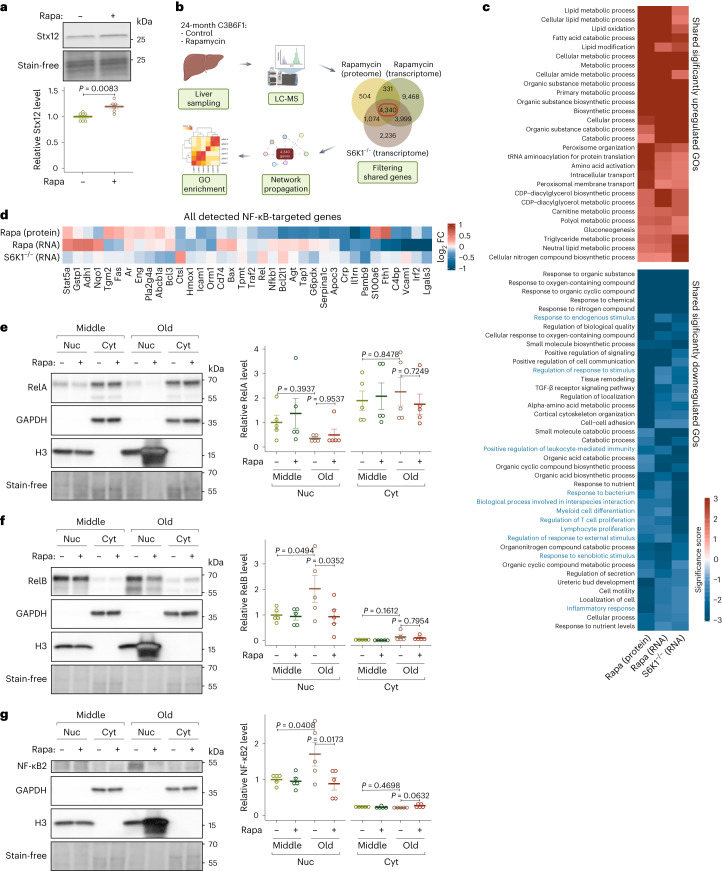
Suppression of target of rapamycin complex 1 (TORC1) by rapamycin ameliorates aging in diverse species. S6 kinase (S6K) is an essential mediator, but the mechanisms involved are unclear. Here we show that activation of S6K specifically in Drosophila fat-body blocked extension of lifespan by rapamycin, induced accumulation of multilamellar lysosomes and blocked age-associated hyperactivation of the NF-κB-like immune deficiency (IMD) pathway, indicative of reduced inflammaging. Syntaxin 13 mediated the effects of TORC1-S6K signaling on lysosome morphology and inflammaging, suggesting they may be linked. Inflammaging depended on the IMD receptor regulatory isoform PGRP-LC, and repression of the IMD pathway from midlife extended lifespan. Age-related inflammaging was higher in females than in males and was not lowered in males by rapamycin treatment or lowered S6K. Rapamycin treatment also elevated Syntaxin 12/13 levels in mouse liver and prevented age-related increase in noncanonical NF-κB signaling, suggesting that the effect of TORC1 on inflammaging is conserved from flies to mammals.


Conflict of interest statement

The authors declare no competing interests.

Figures

Fig. 1
Fig. 1. S6K activity in the fat body of adult flies determines longevity.
a, Adult-onset repression of S6K ubiquitously using daGS>S6KRNAi extended lifespan (P = 4.94 × 10−6, n = 150). b, Adult-onset repression of S6K in the fat body using Lsp2GS>S6KRNAi extended lifespan (n = 180). c, Rapa extended lifespan of control flies, but not of flies with ubiquitous overexpression of constitutively active S6K (daGS>S6KCA). Ubiquitous overexpression of constitutively active S6K significantly attenuated the response to Rapa treatment (Rapa: P = 2.04 × 10−5, daGS>S6KCA induction: P = 3.21 × 10−5, interaction P = 0.0236; n = 200). d, Adult-onset S6K activation in the fat body (Lsp2GS>S6KCA) significantly attenuated Rapa-related longevity (Rapa: P = 1.07 × 10−7, Lsp2GS>S6KCA induction: P = 1.58 × 10−5, interaction P = 0.0331; n = 200). log-rank test and CPH test. Representative survival curve of two independent assays.
Fig. 2
Fig. 2. TORC1–S6K signaling affects lysosomal morphology and function in the fat body.
a, LysoTracker staining of fat bodies from young (day 10) flies. Fat-body-specific, adult-onset overexpression of constitutively active S6K (Lsp2GS>S6KCA) significantly increased acidic organelle amount and size in response to Rapa treatment (total puncta: Rapa: P = 1.338 × 10−6, Lsp2GS>S6KCA induction: P = 0.0001, interaction P = 0.0946; large puncta: Rapa: P = 2.896 × 10−5, Lsp2GS>S6KCA induction: P = 1.618 × 10−5, interaction P = 0.0246; n = 12). b, LysoTracker-positive enlarged acidic organelles (magenta) colocalized with the lysosomal marker Lamp1 (Lsp2GS>S6KCA;GFP–Lamp1, green, top) and partially colocalized with Rab7 (Lsp2GS>S6KCA;YFP–Rab7, green, bottom), a marker for late endosomes, in young flies treated with Rapa and overexpressing S6KCA. c, Electron microscopy (EM) images of fat bodies of young flies treated with Rapa and overexpressing S6KCA. Overexpression of S6KCA in the fat body attenuated the effect of Rapa on the ratio of multilamellar to total lysosomal area (Rapa: P = 0.0395, Lsp2GS>S6KCA induction: P = 0.2798, interaction P = 0.0388; n = 5). d, Rapa increased lysosomal degradation capacity in the fat body of young flies, depicted by DQ–BSA/FITC–BSA pulse-chase assay. Lysosomes were labeled by FITC–BSA. Overexpression of S6K (Lsp2GS>S6KCA) blocked the effect of Rapa on lysosomal degradation capacity (Rapa: P = 0.3278, Lsp2GS>S6KCA induction: P = 0.1382, interaction P = 0.0051; n = 14) in fat bodies of young flies. e, LysoTracker staining of young fat bodies overexpressing dominant negative Rab7 (Lsp2GS>Rab7DN). Fat-body-specific overexpression of Rab7DN significantly increased acidic organelle size (P = 0.0064; n = 12). f, Fat-body-specific overexpression of dominant negative Rab5 (Lsp2GS>Rab5DN) also increased acidic organelle size (P = 0.0798; n = 12). For box plot (a and df), the center is the median, the lower and upper bounds correspond to the first and third quartiles, the whiskers extend up to 1.5 times the interquartile range, and the minima and maxima are the observed minima and maxima. Data are displayed as mean ± s.e.m. (c). Each data point represents an average value per fat body. Two-sided linear mixed model (a and df) or two-sided negative binomial generalized linear model (c) followed by Tukey’s multiple comparison test. Scale bar, 10 μm (a, b and df) or 1 μm (c).
Fig. 3
Fig. 3. Syx13 is a downstream effector of TORC1–S6K signaling that regulates lysosomal structure in the fly fat body.
a, Syx13 protein level was increased upon Rapa treatment in young fat body cells, and this increase was partly reverted by S6K overexpression (Lsp2GS>S6KCA; Rapa: P = 0.0003, Lsp2GS>S6KCA induction: P = 0.0138, interaction P = 0.0086; n = 5). b, Syx13 protein level was increased upon S6K repression (Lsp2GS>S6KRNAi; P = 0.0226; n = 5) in young fat body cells. Syx13 protein levels were measured by mass spectrometry-based proteomics. c, Knockdown of Syx13 expression (Lsp2GS>Syx13RNAi) resulted in enlarged lysosomes in the fat body of young flies, depicted by LysoTracker staining (P = 0.0057; n = 14). d, Overexpression of Syx13 (Lsp2GS>Syx13) did not affect lysosomal enlargement (P = 0.2894; n = 12) in young fat bodies. e, Overexpression of Syx13 (Lsp2GS>S6KCA;Syx13) rescued the enlarged lysosomes of flies overexpressing S6K (Lsp2GS>S6KCA) treated with Rapa (Lsp2GS>S6KCA induction: P = 5.559 × 10−5, Lsp2GS>Syx13 induction: P = 6.083 × 10−5, interaction P = 0.0429; n = 12). f, Overexpression of Syx13 (Lsp2GS>S6KCA;Syx13) partially rescued the multilamellar lysosomes of S6K overexpressing (Lsp2GS>S6KCA) flies treated with Rapa, depicted by electron microscopy (Lsp2GS>S6KCA induction: P = 0.0005, Lsp2GS>Syx13 induction: P = 0.7989, interaction P = 0.3068; n = 5). Data are displayed as mean ± s.e.m. (a, b and f). For box plot (ce), the center is the median, the lower and upper bounds correspond to the first and third quartiles, the whiskers extend up to 1.5 times the interquartile range, and the minima and maxima are the observed minima and maxima. Each data point represents an average value per five fat bodies (a and b) or per fat body (cf). Two-sided linear mixed model (ae) or two-sided negative binomial generalized linear model (f) followed by Tukey’s multiple comparison test. Scale bar, 10 μm (ce) or 1 μm (f).
Fig. 4
Fig. 4. Immune aging is modulated by TORC1–S6K signaling in the fat body.
a, log2 fold change (FC) across age and treatments of all AMPs detected in the fat body proteome. All AMPs accumulated with age and were repressed by Rapa treatment; S6K activation specifically blocked the effects of Rapa AMPs (AttC, AttB and DptA) downstream of the IMD pathway. AMPs associated with the IMD pathway were also repressed by S6K inhibition. b, Cleaved Relish (Rel49, 49 kDa) in fat bodies of young (day 10), middle (day 30) and old (day 50) flies (age effect P = 0.0034; n = 4). c,d, Relish (Rel) protein localization (c, n = 9 in young and n = 13 in old) and DptA transcript expression (d, n = 4) in fat bodies of young and old flies. eg, S6K inhibition (Lsp2GS>S6KRNAi) suppressed the age-related increase in activated Rel49 (e, n = 5), accumulation of Relish in the nucleus (f, n = 14), and the increase in DptA expression (g, n = 3) in fat bodies of old (day 50) flies. h,i, Rapa treatment suppressed age-related Relish localization (h) and the increase in DptA (i). Overexpression of S6K (Lsp2GS>S6KCA) blocked the effect of Rapa on Relish localization (h, Rapa: P = 0.0025, Lsp2GS>S6KCA induction: P = 1.339 × 10−6, interaction P = 0.2345; n = 14) and DptA expression (i, n = 4) in fat bodies of old (day 50) flies. j, Rapa treatment improved bacterial clearance in old (day 50) flies infected with Ecc15, indicated by colony forming unit (CFU) assay. This effect was blocked by S6K overexpression (Lsp2GS>S6KCA) (Rapa: P = 0.0185, Lsp2GS>S6KCA induction: P = 0.0024, interaction P = 0.0620; n = 12). Data are displayed as mean ± s.e.m. (b, d, e, g and i). For box plot (c, f, h and j), the center is the median, the lower and upper bounds correspond to the first and third quartiles, the whiskers extend up to 1.5 times the interquartile range, and the minima and maxima are the observed minima and maxima. Each data point represents an average value per fat body (c, f and h), per five fat bodies (b, d, e, g and i) or per three whole flies (i). Two-sided one-way analysis of variance (ANOVA) followed by Dunnett’s multiple comparison test (b). Two-sided linear mixed model (c, f and h) or two-sided two-way ANOVA with log transformation (j) followed by Tukey’s multiple comparison test. Two-sided Student’s t-test with (d, g and i) or without log-transformation (e). Scale bar, 10 μm.
Fig. 5
Fig. 5. Reduced TORC1–S6K attenuates inflammaging via the endolysosomal regulation of rPGRP-LC in the fat body.
a,b, Rapa treatment suppressed the age-related nuclear localization of Relish (Rel) in old fat body cells. Dominant-negative Rab7 (a, Rapa: P = 0.0638, Lsp2GS>Rab7DN induction: P = 4.149 × 10−6, interaction P = 0.0160; n = 14) and Rab5 (b, Rapa: P = 4.467 × 10−6, Lsp2GS>Rab5DN induction: P = 7.276 × 10−6, interaction P = 0.0003; n = 14) blocked the effect of Rapa on the age-related nuclear localization of Relish. c,d, Removing the full-length PGRP-LC (PGRP-LCΔE12) and only the regulatory PGRP-LC isoforms by deleting exon 5 (resc(LCΔex5)) repressed the age-related nuclear localization of Relish and Rapa effect in the fat body of old flies treated with antibiotic (c, Rapa: P = 0.0355, PGRP-LCΔE12: P = 7.925 × 10−9, interaction P = 0.0569; n = 9 in PGRP-LCΔE12 group and n = 14 in other groups; d, Rapa: P = 0.1642, resc(LCΔex5): P = 0.0028, interaction P = 0.0018; n = 14). e, Overexpression of regulatory PGRP-LC isoform (Lsp2GS>GFP–rLCx) suppressed the Rapa effect on Relish localization in old fat body cells (Rapa: P = 0.1921, Lsp2GS>GFP–rLCx induction: P = 0.0432, interaction P = 2.285 × 10−5; n = 14). f, Overexpression of canonical PGRP-LC isoform (Lsp2GS>LCx), did not affect the Rapa effect on Relish localization in old fat body cells (Rapa: P = 1.419 × 10−8, Lsp2GS>LCx induction: P = 0.8768, interaction P = 0.3832; n = 14). g, Overexpression of regulatory PGRP-LC isoform (Lsp2GS>GFP–rLCx) did not affect the nuclear localization of Relish in young (left, n = 14) and old (right, n = 14) fat body cells, but induced the nuclear localization of Relish in middle-aged (middle, n = 14) fat body cells. Time course experiments were performed separately using the same batch of flies. h, Regulatory PGRP-LC (green) colocalized with LysoTracker-positive enlarged acidic organelles (magenta) in the fat body of young flies treated with Rapa and overexpressing S6KCA (Lsp2GS>S6KCA;GFP–rLCx, n = 14). For box plot, the center is the median, the lower and upper bounds correspond to the first and third quartiles, the whiskers extend up to 1.5 times the interquartile range, and the minima and maxima are the observed minima and maxima. Each data point represents an average value per fat body. Two-sided linear mixed model followed by Tukey’s multiple comparison test. Scale bar, 10 μm.
Fig. 6
Fig. 6. The TORC1–S6K–Syx13 axis regulates inflammaging, immunosenescence and lifespan.
a,b, Knockdown of Syx13 blocked the effect of Rapa (a, Rapa: P = 0.0012, Lsp2GS>Syx13RNAi induction: P = 1.026 × 10−10, interaction P = 0.2930; n = 14) and S6K knockdown (b, Lsp2GS>S6KRNAi induction: P = 0.0004, Lsp2GS>Syx13RNAi induction: P = 5.699 × 10−7, interaction P = 0.0088; n = 14) on Relish (Rel) nuclear localization in old fat body cells. c, Overexpression of Syx13 (Lsp2GS>Syx13; n = 14) repressed the age-related nuclear localization of Relish in old fat body cells. d, Overexpression of Syx13 (Lsp2GS>S6KCA;Syx13) rescued the effect of S6K activation on Relish localization (Lsp2GS>S6KCA induction: P = 2.796 × 10−5, Lsp2GS>Syx13 induction: P = 1.139 × 10−10, interaction P = 8.787 × 10−9; n = 14) in old flies treated with Rapa. e, Knockdown of Syx13 (Lsp2GS>Syx13RNAi) blocked the effect of Rapa on bacterial clearance, indicated by colony forming unit (CFU) assay (Rapa: P = 0.0093, Lsp2GS>Syx13RNAi induction: P = 0.0057, interaction P = 0.2226; n = 8). f, Overexpression of Syx13 (Lsp2GS>S6KCA;Syx13) rescued the effect of S6K activation on bacterial clearance (Lsp2GS>S6KCA induction: P = 0.0644, Lsp2GS>Syx13 induction: P = 0.7042, interaction P = 0.0429; n = 10) in old flies treated with Rapa. g, Middle-age-onset repression of Relish using Lsp2GS>RelishRNAi improved bacterial clearance in old flies (n = 8 in 0 h.p.i. group and n = 12 in 12 h.p.i. groups). h, Overexpression of Syx13 (Lsp2GS>S6KCA;Syx13) increased the lifespan of flies with S6K activation (Lsp2GS>S6KCA induction: P = 0.1504, Lsp2GS>Syx13 induction: P = 0.0148, interaction P = 0.2410; n = 200) i,j, Overexpression of Syx13 (i, Lsp2GS>Syx13; n = 200) and middle-age-onset repression of Relish (j, Lsp2GS>RelishRNAi; n = 200) extended lifespan. For box plot, the center is the median, the lower and upper bounds correspond to the first and third quartiles, the whiskers extend up to 1.5 times the interquartile range, and the minima and maxima are the observed minima and maxima. Each data point represents an average value per fat body (ad) or per three whole flies (eg). Two-sided linear mixed model (ad) or two-sided two-way analysis of variance (ANOVA) with log transformation (e and f) followed by Tukey’s multiple comparison test. Two-sided Student’s t-test (g). CPH test and log-rank test (hj). Representative survival curve of one (h) or two independent assay(s) (i and j). Scale bar, 10 μm.
Fig. 7
Fig. 7. TORC1–S6K signaling regulates Stx12 expression and age-associated activation of the noncanonical NF-κB pathway in mouse liver.
a, Rapa treatment increased Stx12 level in the liver of 12-month-old mice (n = 7). b, Schematic for the analysis workflow. Common genes present in all three datasets were used for network propagation and GO analysis. c, Only GO terms significantly regulated (P < 0.05, Fisher tests) in the same direction in all three datasets are shown. Immune-related annotations are shown in blue. Cells are colored by their log10 significance score. d, All NF-κB-targeted genes detected in all three datasets are shown. Cells are colored by their log2 fold change (FC). e, The effect of age and Rapa on the activity of the canonical NF-κB pathway as indicated by RelA/p65 level in liver subcellular fractions from 12-month-old (‘Middle’) and 24-month-old (‘Old’) mice (for nuclear fraction (‘Nuc’): age effect P = 0.0504, Rapa effect P = 0.4886, interaction P = 0.7559; for cytosolic fraction (‘Cyt’): age effect P = 0.9721, Rapa effect P = 0.7437, interaction P = 0.4936; n = 4). f,g, The effect of age and Rapa on the activity of the noncanonical NF-κB pathway as indicated by RelB level (f, for nuclear fraction (‘Nuc’): age effect P = 0.1050, Rapa effect P = 0.0680, interaction P = 0.0944; for cytosolic fraction (‘Cyt’): age effect P = 0.0310, Rapa effect P = 0.5382, interaction P = 0.8136; n = 4) and by NF-κB2/p52 level (g, for nuclear fraction (‘Nuc’): age effect P = 0.1218, Rapa effect P = 0.0405, interaction P = 0.0630; for cytosolic fraction (‘Cyt’): age effect P = 0.7063, Rapa effect P = 0.2032, interaction P = 0.0636; n = 4) in the liver subcellular fractions from 12-month-old (‘Middle’) and 24-month-old (‘Old’) mice. Data are displayed as mean ± s.e.m. Two-sided one-way analysis of variance (ANOVA) (a). Two-sided two-way ANOVA followed by Šídák’s multiple comparison test for comparison within nuclear fraction and cytosolic fraction separately (eg).
Extended Data Fig. 1
Extended Data Fig. 1. Downregulation of S6K activity ubiquitously in male flies or in the neurons, intestine, muscle, or heart tube of female flies does not extend lifespan.
a, Adult-onset expression of S6K RNAi ubiquitously using daGS > S6KRNAi repressed S6K level (n = 3). b, Adult-onset repression of S6K ubiquitously using daGS > S6KRNAi extended lifespan in female flies, but not in males (gender: p < 2e-16, Lsp2GS > S6KRNAi induction: p = 0.0001, interaction p = 0.0240; n = 180). c-d, Adult-onset repression of S6K in the neurons using elavGS > S6KRNAi (c, n = 200) or in the intestine using TiGS > S6KRNAi (d, n = 150) did not affect lifespan. e-f, Adult-onset repression of S6K in the muscle using MHCGS > S6KRNAi (e, p = 3.936e-28, n = 200) or in the heart tube using HandGS > S6KRNAi (f, p = 1.155e-12, n = 200) shortened lifespan. Each data point represents an average value per 20 fly heads (a). Two-sided one-way ANOVA (a). CPH analysis (b). Log-rank test (b-f). Representative survival curve of one independent assay (b-f).
Extended Data Fig. 2
Extended Data Fig. 2. S6K activity in the fat body does not affect intestinal health.
a, Rapamycin treatment induced acid organelles in the intestine of young (day 20) flies. Overexpression of constitutively active S6K specifically in the fat body (Lsp2GS > S6KCA) did not affect this phenotype, depicted by lysotracker staining (rapamycin: p = 1.338e-06, Lsp2GS > S6KCA induction: p = 0.8463, interaction p = 0.9474; n = 8). b, Rapamycin treatment suppressed dividing intestinal stem cells of young (day 20) flies. Overexpression of constitutively active S6K specifically in the fat body (Lsp2GS > S6KCA) did not affect this phenotype, depicted by pH3 staining in the intestine (rapamycin: p = 2.9e-12, Lsp2GS > S6KCA induction: p = 0.8310, interaction p = 0.1610; n = 21 in control group, 23 in S6KCA group, 20 in Rapa group and Rapa+S6KCA group). c, RNAi mediated downregulation of S6K activity specifically in the fat body (Lsp2GS > S6KRNAi) did not affect dividing intestinal stem cells of young (day 20) flies, depicted by pH3 staining in the intestine (n = 21 in control group and n = 23 in S6KRNAi group). d, Rapamycin treatment suppressed intestinal dysplasia of old (day 50) flies. Overexpression of constitutive active S6K specifically in the fat body (Lsp2GS > S6KCA) did not affect this phenotype (rapamycin: p = 4.02e-08, Lsp2GS > S6KCA induction: p = 0.1340, interaction p = 0.3960; n = 19 in control group, 18 in S6KCA group, 17 in Rapa group and 20 in Rapa+S6KCA group). e, RNAi mediated downregulation of S6K activity specifically in the fat body (Lsp2GS > S6KRNAi) did not affect intestinal dysplasia of old (day 50) flies (n = 15). For box plot, the centre is the median, the lower and upper bounds correspond to the first and third quartiles, the whiskers extend up to 1.5 times the interquartile range, and the minima and maxima are the observed minima and maxima. Each data point represents an average value per intestine. Two-sided linear mixed model followed by Tukey’s multiple comparison test. Scale bar, 10 μm.
Extended Data Fig. 3
Extended Data Fig. 3. Proteomics analysis of TORC1-S6K dependent changes in the fly fat body.
a, Outline of the proteomics experiment. b, Principal component analysis projections of proteomic replicates of Lsp2GS > S6KCA (left) and Lsp2GS > S6KRNAi (right), showing separation according to treatments and age. Each replicate represents a pool of five fat bodies. c, Venn diagram showing the number of up- and down-regulated proteins (p < 0.05) of each comparison at young and old age. ‘Rapa effect’ comprises differentially expressed proteins between Control vs Rapa; ‘S6KCA+Rapa effect’ comprises S6KCA vs S6KCA+Rapa; and ‘S6KRNAi effect’ comprises differentially expressed proteins between Control vs S6KRNAi. d, Representation of age-related changes on Gene Ontology (GO) terms between young and old age groups in the Control treatment group of Lsp2GS > S6KCA dataset after network propagation. Colour indicates the categories of the terms. e, Representation of Gene Ontology (GO) terms in Lsp2GS > S6KCA dataset (left) and Lsp2GS > S6KRNAi dataset (right) after network propagation. S6KCA-dependent Rapa-induced annotations were selected if the p-value of Control vs Rapa annotation is at least 100 times greater than the p-value of S6KCA vs S6KCA+Rapa annotation (EtOHvsRapa.log10_pvalue - RUvsRURapa.log10_pvalue > 2). Colour indicates the categories of the terms.
Extended Data Fig. 4
Extended Data Fig. 4. TORC1-S6K signalling in the fat body does not affect egg laying, global and 5’ TOP-related genes translation rate, TAG storage or starvation resistance.
a, Repression of S6K in the fat body using Lsp2GS > S6KRNAi did not affect cumulative egg laying (n = 10). b, Rapamycin treatment or overexpression of constitutively active S6K specifically in the fat body (Lsp2GS > S6KCA) did not affect the overall level of newly synthesized proteins, depicted by puromycin immunoblotting (rapamycin: p = 0.1307, Lsp2GS > S6KCA induction: p = 0.6792, interaction p = 0.6168). Overexpression of S6K elevated both pS6K and total S6K level. Rapamycin treatment repressed pS6K level (rapamycin: p = 0.0018, Lsp2GS > S6KCA induction: p = 1.551e-06, interaction p = 0.3253) and pS6K/S6K ratio (rapamycin: p = 0.0090, Lsp2GS > S6KCA induction: p = 0.0023, interaction p = 0.0738) but did not affect total S6K level (rapamycin: p = 0.9751, Lsp2GS > S6KCA induction: p = 4.343e-09, interaction p = 0.0398; n = 3). c, Rapamycin treatment or overexpression of S6K (Lsp2GS > S6KCA) did not affect the overall protein expression level in the fat body proteome of young flies (upper panel). Although rapamycin treatment repressed expression of genes containing 5’ TOP motif (‘Rapa vs Ctrl’, bottom panel), activation of specifically in the fat body (Lsp2GS > S6KCA) did not block the rapamycin effect (‘S6KCA+Rapa vs S6KCA’, bottom panel). d, Rapamycin increased triglyceride (TAG) storage of young flies. Expression of S6K in the fat body (Lsp2GS > S6KCA) did not block the effect of rapamycin on TAG storage (rapamycin: p = 5.36e-06, Lsp2GS > S6KCA induction: p = 0.0957, interaction p = 0.0890; n = 5). e, Starvation resistance was not affected by downregulation of S6K in the fat body (Lsp2GS > S6KRNAi; n = 100). f, Rapamycin increased starvation resistance of young flies. Overexpression of S6K (daGS > S6KCA) did not block the effect of rapamycin on starvation resistance (rapamycin: p < 2e-16, daGS > S6KCA induction: p = 8.78e-14, interaction p = 0.5770; n = 100). For box plot (a), the centre is the median, the lower and upper bounds correspond to the first and third quartiles, the whiskers extend up to 1.5 times the interquartile range, and the minima and maxima are the observed minima and maxima. Data are displayed as mean ± s.e.m. (b, d), or violin plot with median value (c). Each data point represents an average value per vial (a), per five fat bodies (b), or per five whole flies (d). Two-sided Student’s t- test (a). Two-sided linear mixed model with (b) or without (d) log transformation followed by Tukey’s multiple comparison test. Log-rank test (e-f) and CPH analysis (f).
Extended Data Fig. 5
Extended Data Fig. 5. TORC1-S6K signalling affects lysosomal size and structure.
a, Visualization of enlarged lysosomes in the fat body of young flies treated with rapamycin and overexpressing constitutively active S6K (Lsp2GS > S6KCA) using a 3xmCherry-Lamp1 reporter (rapamycin: p = 2.131e-05, Lsp2GS > S6KCA induction: p = 2.042e-06, interaction p = 0.0468; n = 14). b, (Corresponding to Fig. 2c) Rapamycin treatment, but not overexpression of S6K, mildly increased the area of homogeneous, electron dense lysosomes, depicted by electron microscopy (rapamycin: p = 0.1410, Lsp2GS > S6KCA induction: p = 0.9640, interaction p = 0.9640; upper panel). Rapamycin treatment mildly repressed the area of multilamellar lysosomes; however, overexpression of S6K attenuated the rapamycin effect on the multilamellar lysosomes (rapamycin: p = 0.1850, Lsp2GS > S6KCA induction: p = 0.1090, interaction p = 0.1390; n = 5; bottom panel). For box plot (a), the centre is the median, the lower and upper bounds correspond to the first and third quartiles, the whiskers extend up to 1.5 times the interquartile range, and the minima and maxima are the observed minima and maxima. Data are displayed as mean ± s.e.m. (b). Each data point represents an average value per fat body. Two-sided linear mixed model (a) or two-sided negative binomial generalized linear model (b) followed by Tukey’s multiple comparison test. Scale bar, 10 μm.
Extended Data Fig. 6
Extended Data Fig. 6. S6K-dependent lysosomal enlargement is not regulated by lysosomal biogenesis or autophagy in the fat body.
a, RNAi mediated knock down of Mitf specifically in the fat body (Lsp2GS > S6KCA;MitfRNAi) did not affect the enlarged lysosome phenotype of fat body tissue of S6K overexpression flies (Lsp2GS > S6KCA) treated with rapamycin, depicted by lysotracker staining (Lsp2GS>MitfRNAi induction: p = 0.4676, Lsp2GS > S6KCA induction: p = 4.159e-05, interaction p = 0.5475; n = 12). b, Rapamycin treatment induced acid organelles in the fat body of young flies. RNAi mediated knock down of Atg5 specifically in the fat body (Lsp2GS>Atg5RNAi) blocked this phenotype, depicted by lysotracker staining (rapamycin: p = 0.0025, Lsp2GS>Atg5RNAi induction: p = 0.2947, interaction p = 0.0035; n = 12). c, RNAi mediated knock down of Atg5 specifically in the fat body (Lsp2GS > S6KCA;Atg5RNAi) did not affect the enlarged lysosome phenotype of fat body tissue of S6K overexpression flies (Lsp2GS > S6KCA) treated with rapamycin, depicted by lysotracker staining (Lsp2GS>Atg5RNAi induction: p = 0.6766, Lsp2GS > S6KCA induction: p = 6.706e-06, interaction p = 0.5220; n = 12). d, RNAi mediated knock down of Atg5 specifically in the fat body (Lsp2GS>Atg5RNAi) did not affect Relish localisation in old fat bodies treated with rapamycin (rapamycin: p = 8.676e-10, Lsp2GS>Atg5RNAi induction: p = 0.6189, interaction p = 0.9932; n = 14). e, RNAi mediated knock down of Atg5 specifically in the fat body (Lsp2GS>Atg5RNAi) did not block lifespan extension upon rapamycin treatment (rapamycin: p = 4.14e-15, Lsp2GS>Atg5RNAi induction: p = 0.4130, interaction p = 0.4320; n = 200). For box plot, the centre is the median, the lower and upper bounds correspond to the first and third quartiles, the whiskers extend up to 1.5 times the interquartile range, and the minima and maxima are the observed minima and maxima. Each data point represents an average value per fat body. Two-sided linear mixed model followed by Tukey’s multiple comparison test (a-d). Log-rank test and CPH analysis (e). Representative survival curve of one independent assay (e). Scale bar, 10 μm.
Extended Data Fig. 7
Extended Data Fig. 7. Syx13 regulates lysosomal morphology and inflammageing in the fly fat body.
a, Overexpression of constitutively active S6K (Lsp2GS > S6KCA) increased total S6K level. Co-overexpression of Syx13 with S6K did not affect the effect of S6K overexpression on the total S6K level in fly fat body (Lsp2GS > S6KCA induction: p = 0.0007, Lsp2GS>Syx13 induction: p = 0.1955, interaction p = 0.8240; n = 3). b, Overexpression of constitutively active S6K (Lsp2GS > S6KCA) induced enlarged lysosomes in the fat body of young flies. Overexpression of Syx13 (Lsp2GS > S6KCA;Syx13) rescued the enlarged lysosomes of flies over-expressing S6K (Lsp2GS > S6KCA) (Lsp2GS > S6KCA induction: p = 0.0046, Lsp2GS>Syx13 induction: p = 0.2417, interaction p = 0.0002; n = 14). c, Overexpression of constitutive active S6K specifically in the fat body (Lsp2GS > S6KCA) blocked the effect of rapamycin on the age-related nuclear localisation of Relish (rapamycin: p = 0.0065, Lsp2GS > S6KCA induction: p = 2.075e-05, interaction p = 0.0052; n = 14). Co- overexpression of Syx13 and S6K (Lsp2GS > S6KCA;Syx13) repressed the age-related nuclear localisation of Relish. Rapamycin treatment did not further suppress the effect of Syx13 and S6K co-overexpression on the age-related nuclear localisation of Relish (rapamycin: p = 0.0061, Lsp2GS > S6KCA;Syx13 induction: p = 0.0014, interaction p = 0.0090; n = 14). Data are displayed as mean ± s.e.m. (a). For box plot (b-c), the centre is the median, the lower and upper bounds correspond to the first and third quartiles, the whiskers extend up to 1.5 times the interquartile range, and the minima and maxima are the observed minima and maxima. Each data point represents an average value per five fat bodies (a) or per fat body (b-c). Two-sided two-way ANOVA with log transformation followed by Tukey’s multiple comparison test (a). Two-sided linear mixed model followed by Tukey’s multiple comparison test for comparison of all conditions (b) or within each genotype separately (c). Two-sided linear mixed model for comparison between S6KCA and S6KCA;Syx13 control groups (c). Scale bar, 10 μm.
Extended Data Fig. 8
Extended Data Fig. 8. Reduced inflammageing with lowered TORC1-S6K activity is independent of bacterial load.
a, Infection with Ecc15 induced nuclear accumulation of Relish in young fat body cells. RNAi-mediated knockdown of S6K (Lsp2GS > S6KRNAi) did not affect the infection-induced localisation of Relish to the nucleus (infection: p = 0.0013, Lsp2GS > S6KRNAi induction: p = 0.3499, interaction p = 0.3151; n = 12). b, Colony forming unit (CFU) assay confirmed effective bacterial growth repression by the antibiotic treatment with tetracycline and ampicillin (n = 5). c, Rapamycin treatment suppressed accumulation of Relish in the nucleus in the fat body of old flies treated with antibiotic. Overexpression of constitutively active S6K (Lsp2GS > S6KCA) blocked the effect of rapamycin on Relish localisation (rapamycin: p = 0.0264, Lsp2GS > S6KCA induction: p = 7.826e-07, interaction p = 0.1300; n = 14). d, Rapamycin treatment suppressed DptA expression in old fat body cells. Overexpression of constitutively active S6K (Lsp2GS > S6KCA) induced DptA expression of flies treated with rapamycin and antibiotics (n = 6). For box plot (a, c), the centre is the median, the lower and upper bounds correspond to the first and third quartiles, the whiskers extend up to 1.5 times the interquartile range, and the minima and maxima are the observed minima and maxima. Data are displayed as mean ± s.e.m. (b, d). Each data point represents an average value per fat body (a, c), per whole fly (b), or per five fat bodies (d). Two-sided linear mixed model followed by Tukey’s multiple comparison test (a, c). Mann-Whitney test (b). Two-sided Student’s t-test with log transformation (d). Scale bar, 10 μm.
Extended Data Fig. 9
Extended Data Fig. 9. Reduced TORC1-S6K signalling lowers inflammageing and increases lifespan in female flies, but not in males.
a, Fat body-specific adult-onset over-expression of constitutively active S6K induced enlarged lysosomes in response to rapamycin treatment in both females (rapamycin: p = 7.968e-10, Lsp2GS > S6KCA induction: p = 5.785e-07, interaction p = 0.0053; n = 12) and males (rapamycin: p = 3.334e-07, Lsp2GS > S6KCA induction: p = 4.931e-05, interaction p = 0.0786; n = 12). b, The aged fat body cells of male flies had lower age-related Relish localisation in comparison to female flies (n = 14). Rapamycin treatment suppressed the age- related nuclear localisation of Relish in old fat body cells of female flies. Overexpression of constitutive active S6K specifically in the fat body (Lsp2GS > S6KCA) blocked the effect of rapamycin on the age-related nuclear localisation of Relish in female flies (rapamycin: p = 0.0124, Lsp2GS > S6KCA induction: p = 0.0213, interaction p = 0.0024; n = 14), but not in males (rapamycin: p = 0.0070, Lsp2GS > S6KCA induction: p = 0.6618, interaction p = 0.7530; n = 14). For box plot, the centre is the median, the lower and upper bounds correspond to the first and third quartiles, the whiskers extend up to 1.5 times the interquartile range, and the minima and maxima are the observed minima and maxima. Each data point represents an average value per fat body. Two-sided linear mixed model for comparison between male and female control groups. Two-sided linear mixed model followed by Tukey’s multiple comparison test for comparison within each gender separately. Scale bar, 10 μm.
Extended Data Fig. 10
Extended Data Fig. 10. Schematic of the findings.
S6K in the fly fat body plays a crucial role in rapamycin-related longevity. Mechanistically, S6K modulates the endolysosomal system by regulating the expression of the SNARE family protein Syx13. This regulation is vital for mitigating rPGRP-LC-induced inflammageing. The positive impact on inflammageing in the fly fat body leads to enhanced immune function and prolonged lifespan in aged flies.

Similar articles

Cited by

References

    1. Laplante M, Sabatini DM. mTOR signaling in growth control and disease. Cell. 2012;149:274–293. doi: 10.1016/j.cell.2012.03.017. - DOI - PMC - PubMed
    1. Robida-Stubbs S, et al. TOR signaling and rapamycin influence longevity by regulating SKN-1/Nrf and DAF-16/FoxO. Cell Metab. 2012;15:713–724. doi: 10.1016/j.cmet.2012.04.007. - DOI - PMC - PubMed
    1. Bjedov I, et al. Mechanisms of life span extension by rapamycin in the fruit fly Drosophila melanogaster. Cell Metab. 2010;11:35–46. doi: 10.1016/j.cmet.2009.11.010. - DOI - PMC - PubMed
    1. Harrison DE, et al. Rapamycin fed late in life extends lifespan in genetically heterogeneous mice. Nature. 2009;460:392–395. doi: 10.1038/nature08221. - DOI - PMC - PubMed
    1. Sengupta S, Peterson TR, Laplante M, Oh S, Sabatini DM. mTORC1 controls fasting-induced ketogenesis and its modulation by ageing. Nature. 2010;468:1100–1104. doi: 10.1038/nature09584. - DOI - PubMed

LinkOut - more resources