. 2024 Apr;6(4):687-696.
doi: 10.1038/s42255-024-00994-0. Epub 2024 Feb 27.

PMF-seq: a highly scalable screening strategy for linking genetics to mitochondrial bioenergetics

Affiliations

PMF-seq: a highly scalable screening strategy for linking genetics to mitochondrial bioenergetics

Tsz-Leung To et al. Nat Metab. 2024 Apr.

Abstract

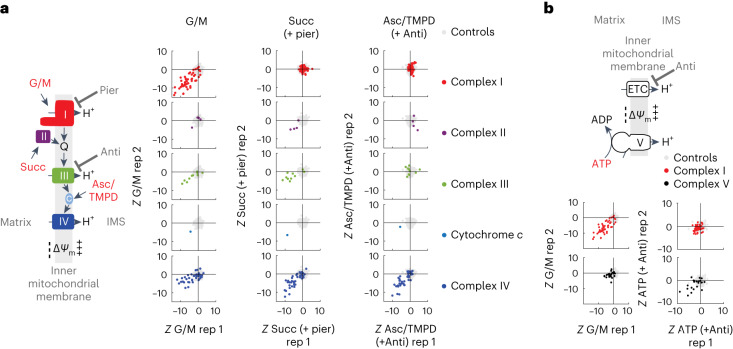
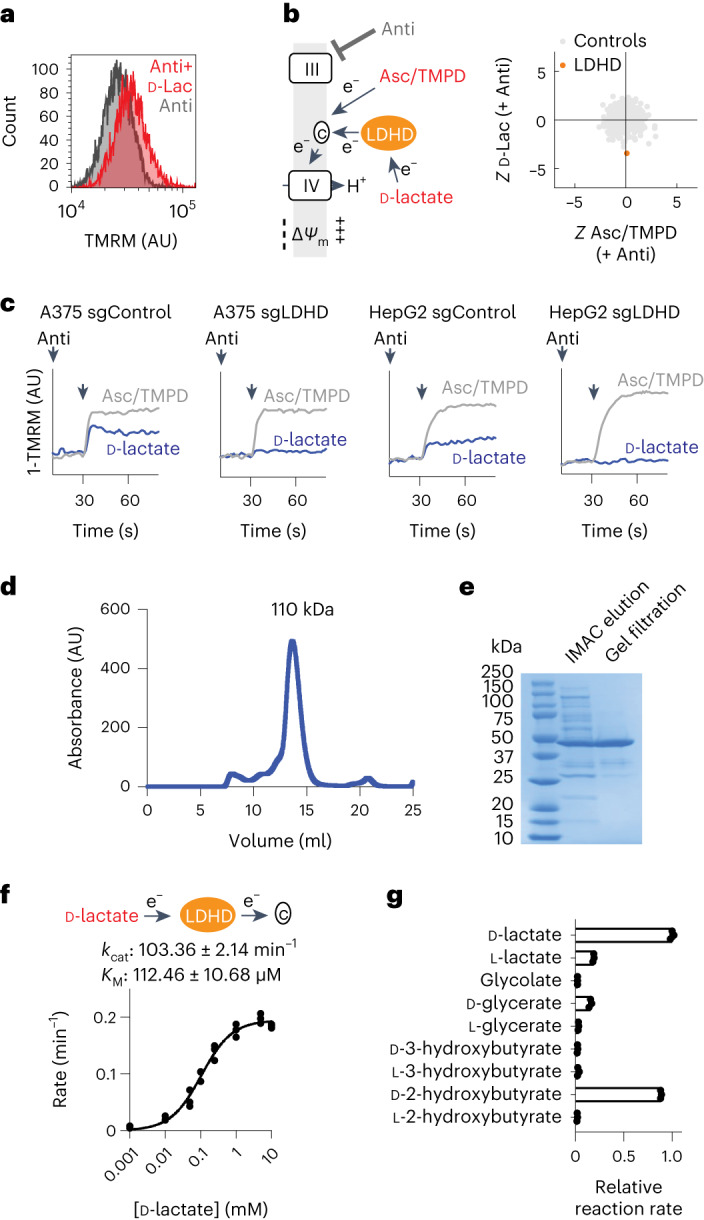
Our current understanding of mitochondrial organelle physiology has benefited from two broad approaches: classically, cuvette-based measurements with suspensions of isolated mitochondria, in which bioenergetic parameters are monitored acutely in response to respiratory chain substrates and inhibitors1-4, and more recently, highly scalable genetic screens for fitness phenotypes associated with coarse-grained properties of the mitochondrial state5-10. Here we introduce permeabilized-cell mitochondrial function sequencing (PMF-seq) to combine strengths of these two approaches to connect genes to detailed bioenergetic phenotypes. In PMF-seq, the plasma membranes within a pool of CRISPR mutagenized cells are gently permeabilized under conditions that preserve mitochondrial physiology, where detailed bioenergetics can be probed in the same way as with isolated organelles. Cells with desired bioenergetic parameters are selected optically using flow cytometry and subjected to next-generation sequencing. Using PMF-seq, we recover genes differentially required for mitochondrial respiratory chain branching and reversibility. We demonstrate that human D-lactate dehydrogenase specifically conveys electrons from D-lactate into cytochrome c to support mitochondrial membrane polarization. Finally, we screen for genetic modifiers of tBID, a pro-apoptotic protein that acts directly and acutely on mitochondria. We find the loss of the complex V assembly factor ATPAF2 acts as a genetic sensitizer of tBID's acute action. We anticipate that PMF-seq will be valuable for defining genes critical to the physiology of mitochondria and other organelles.


Conflict of interest statement

V.K.M. is a paid advisor to 5am Ventures. T.-L.T. and V.K.M. are listed as inventors on a provisional patent application filed by the Broad Institute on PMF-seq technology. The other authors declare no competing interests.

Figures

Fig. 1
Fig. 1. Schematic overview of PMF-seq.
a, Schematic diagram of how substrates can feed into the respiratory chain to support the membrane potential. b, OCR of permeabilized A375 cells as measured by Seahorse analyser with glutamate/malate (left), succinate (middle) or ascorbate/TMPD (right) as the substrate. c, Kinetics of ΔΨm measured as TMRM fluorescence in permeabilized A375 cells with glutamate/malate (left), succinate (middle) or ascorbate/TMPD (right) as the substrate. d, Endpoint ΔΨm of permeabilized A375 cells measured as TMRM fluorescence by a flow cytometer with glutamate/malate (left), succinate (middle) or ascorbate/TMPD (right) as the substrate. e, Experimental workflow of PMF-seq in permeabilized A375 cells. IMS, intermembrane space; G/M, glutamate/malate; Succ, succinate; Pier, piericidin A; Anti, antimycin A; Oligo, oligomycin A; Bam, BAM15; CCCP, carbonyl cyanide m-chlorophenyl hydrazone; AU, arbitrary units. Source data
Fig. 2
Fig. 2. Genetic dissection of OXPHOS branching and reversibility.
a, Scatterplots of Z-scores of the specified respiratory chain components when glutamate/malate (first column), succinate (second column), or ascorbate/TMPD (third column) was used as the respiratory chain substrate in permeabilized A375 cells. b, Scatterplots of Z-scores of complex I (red) or complex V (black) when glutamate/malate (first column) or ATP (second column) was used as the substrate. Data from biological duplicates are shown. A highly negative Z-score indicates the enrichment of sgRNAs for a given gene in the low tail of the TMRM distribution, suggesting the dependency on that gene for membrane potential generation. Source data
Fig. 3
Fig. 3. PMF-seq reveals LDHD is required for utilization of d-lactate as a respiratory chain fuel in human cells.
a, Endpoint ΔΨm measured as TMRM fluorescence by a flow cytometer for permeabilized A375 cells with d-lactate as the substrate. b, Scatterplot of Z-scores of LDHD when ascorbate/TMPD or d-lactate was used as the substrate. c, Kinetics of ΔΨm, measured as TMRM fluorescence, in permeabilized control and LDHD KO cells for A375 (left and middle left) and HepG2 (middle right and right). Ascorbate/TMPD (grey line) or d-lactate (blue line) was added as the substrate after antimycin A treatment, as indicated by the second arrow. d, Size exclusion chromatography profile of purified human LDHD. e, SDS–PAGE analysis of purified human LDHD visualized with Coomassie stains. f, Reaction scheme and in vitro steady-state enzyme kinetics of LDHD-catalysed cytochrome c reduction by d-lactate. g, Relative initial reaction rates of LDHD-catalysed cytochrome c reduction by 10 mM of the specified substrates. Shown in e is a representative gel image from a purification that has been performed five times. Shown are n = 3 individual replicates in f and g. Source data
Fig. 4
Fig. 4. PMF-seq reveals ATPAF2 loss as a sensitizer of acute tBID action.
a, Schematic diagram of acute targeting of tBID to mitochondria. b, Endpoint ΔΨm as measured by a flow cytometer in permeabilized A375 cells treated with 100 nM tBID (red) or 100 nM tBID + 4 mM ADP (light pink) compared with the G/M baseline (dark grey). Distributions of TMRM fluorescence values are shown at t = 10 min post treatment on flow cytometry. c, Scatterplots of Z-scores of specific hits under the tBID (left) or tBID + ADP (right) treatment. d, Scatterplots of Z-scores as in c, with all complex V structural subunits and assembly factors marked in red. e, Seahorse oxygen consumption rate measurements in intact cells in A375 control and ATPAF2 KO cells. Shown are averages ± s.d. for n = 16 biological replicates. f, Real-time PCR-based measurement of mtDNA relative to nDNA in A375 control and ATPAF2 KO cells. Average ± s.d. and individual data points are presented for n = 12 (control) or n = 16 (ATPAF2 KO) replicates. For e and f, ****P = 2.7 × 10−11 or **P = 0.0018 indicates P values for from two-tailed Student’s t-test. g, Representative kinetics of ΔΨm, measured as TMRM fluorescence, in permeabilized A375 control and ATPAF2 KO cells (±100 nM tBID). h, Representative transmission electron microscopy images in A375 control (left) or ATPAF2 KO cells (right, ±100 nM tBID, +4 mM ADP). Representative mitochondria with outer membrane breakage (red arrowhead), herniation (red arrow) or highly dilated cristae with interconnected intracristal space and contracted matrix (red asterisk) are noted. Scale bars, 600 nm. For each condition in h, at least 15 electron micrographs were collected, with four independent images from each condition shown in Extended Data Fig. 6. ETC, electron transport chain; IMM, inner mitochondrial membrane; OMM, outer mitochondrial membrane. Source data
Extended Data Fig. 1
Extended Data Fig. 1. Specificity across PMF-seq screens.
OXPHOS gene sets are annotated in the MitoCarta3.0 database and the cumulative distribution function of each selected gene set (red curve) is plotted against that of all genes (black curve) within the MitoPlus library in PMF-seq experiments using glutamate/malate (left column), succinate (middle column), or ascorbate/TMPD (right column) as substrates in A375 cells (Fig. 2a). Source data
Extended Data Fig. 2
Extended Data Fig. 2. Genetic basis of branching at coenzyme Q.
a, Kinetics of mitochondrial membrane potential measured as TMRM fluorescence in permeabilized K562 cells with glycerol 3-phosphate (G3P) as the substrate. b, Endpoint mitochondrial membrane potential measured as TMRM fluorescence by a flow cytometer in permeabilized K562 cells with G3P as the substrate. c, Scatterplots of Z-scores of the specified respiratory chain components when succinate (first column), or glycerol 3-phosphate (second column) was used as the respiratory chain substrate in permeabilized K562 cells. Data from biological duplicates are shown. A highly negative Z-score indicates the enrichment of sgRNAs for a given gene in the low tail of the TMRM distribution, suggesting the dependency on that gene for membrane potential generation. d. Mean Z scores for GPD2 across screens. G3P, glycerol 3-phosphate; IMS, intermembrane space; G/M, glutamate/malate; Succ, succinate; Pier, piericidin A; Anti, antimycin A. Source data
Extended Data Fig. 3
Extended Data Fig. 3. Additional data related to Fig. 2a.
a, The 147 ‘Mitopathways’ gene sets are defined in the MitoCarta 3.0 database. The heatmap displays log base 10 p-values for each pathway, derived from overlap based on cumulative hypergeometric test statistics with a Z-score cutoff of −2 in PMF-seq experiments using glutamate/malate (left panel), succinate (middle panel), or ascorbate/TMPD (right panel) as substrates in A375 cells (Fig. 2a). b, Top hits in PMF-seq experiments as determined by the lowest mean Z scores from both replicates. Source data
Extended Data Fig. 4
Extended Data Fig. 4. Additional data related to Fig. 2b.
a, Kinetics of mitochondrial membrane potential measured as TMRM fluorescence in permeabilized A375 cells with ATP as the substrate. b, Endpoint mitochondrial membrane potential measured as TMRM fluorescence by a flow cytometer in permeabilized A375 cells with ATP as the substrate. Anti: antimycin A; Oligo: oligomycin A. Source data
Extended Data Fig. 5
Extended Data Fig. 5. LDHD loss does not greatly increase sensitivity to methylglyoxal toxicity.
a, Mean Z scores for LDHD across screens. b, Cell counts of control and LDHD KO cells in A375 after 3 days of methylglyoxal treatment at the indicated dose. c, Viability of control and LDHD KO cells in the same samples as in (b). Shown is the mean +/- SD, n = 3. **p = 0.0016 indicates P values for the specified comparisons from two-way ANOVA after adjustment for multiple comparisons (Tukey’s). Source data
Extended Data Fig. 6
Extended Data Fig. 6. Additional data related to Fig. 4.
Transmission electron microscopy (TEM) images of A375 control cells (top) and ATPAF2 KO cells (bottom). Both control and ATPAF2 KO cells were permeabilized and subjected to treatment with either blank buffer (-tBID) or 100 nM tBID (+tBID), as indicated. Presented here are four distinct frames of view for each condition. Representative mitochondria with outer membrane breakage (red arrowhead), herniation (red arrow), or highly dilated cristae with interconnected intracristal space and contracted matrix (red asterisk) are noted. Scale bar = 600 nm. For each condition, at least 15 electron micrographs were collected, with four independent images being displayed.

References

    1. Chance B, Williams GR. Respiratory enzymes in oxidative phosphorylation. I. Kinetics of oxygen utilization. J. Biol. Chem. 1955;217:383–393. doi: 10.1016/S0021-9258(19)57189-7. - DOI - PubMed
    1. Chance B, Hollunger G. The interaction of energy and electron transfer reactions in mitochondria. I. General properties and nature of the products of succinate-linked reduction of pyridine nucleotide. J. Biol. Chem. 1961;236:1534–1543. doi: 10.1016/S0021-9258(18)64210-3. - DOI - PubMed
    1. Mitchell P, Moyle J. Respiration-driven proton translocation in rat liver mitochondria. Biochem. J. 1967;105:1147–1162. doi: 10.1042/bj1051147. - DOI - PMC - PubMed
    1. Nicholls, D. G. & Ferguson, S. J. Bioenergetics 4th edn (Elsevier, 2013).
    1. Tzagoloff A, Dieckmann CL. PET genes of Saccharomyces cerevisiae. Microbiol. Rev. 1990;54:211–225. doi: 10.1128/mr.54.3.211-225.1990. - DOI - PMC - PubMed

Publication types

MeSH terms