. 2024 Apr;6(4):697-707.
doi: 10.1038/s42255-024-00992-2. Epub 2024 Feb 27.

Histone butyrylation in the mouse intestine is mediated by the microbiota and associated with regulation of gene expression

Affiliations

Histone butyrylation in the mouse intestine is mediated by the microbiota and associated with regulation of gene expression

Leah A Gates et al. Nat Metab. 2024 Apr.

Abstract

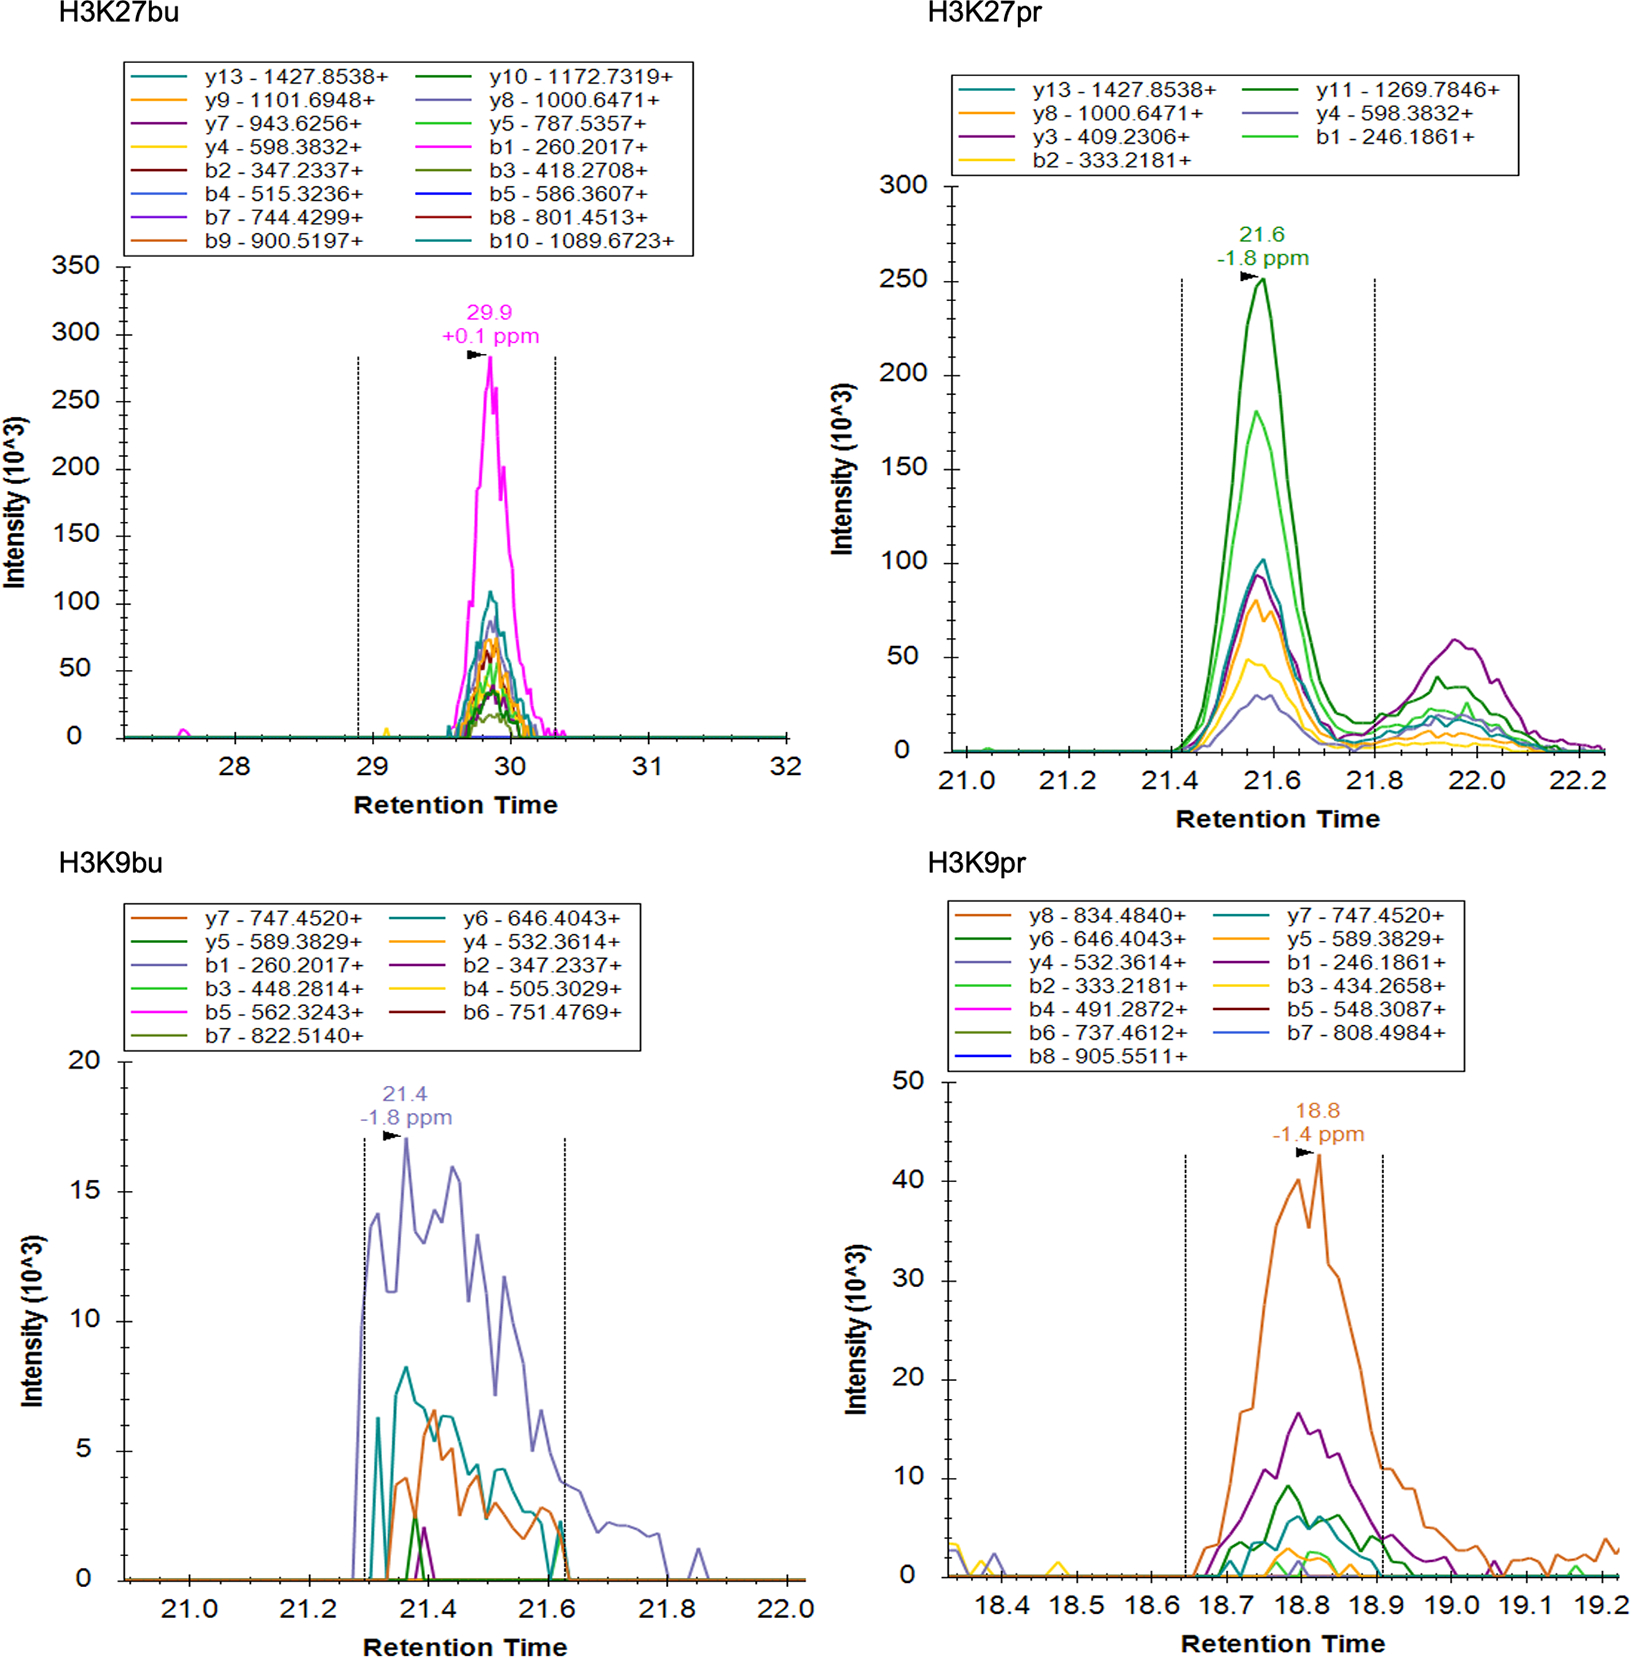
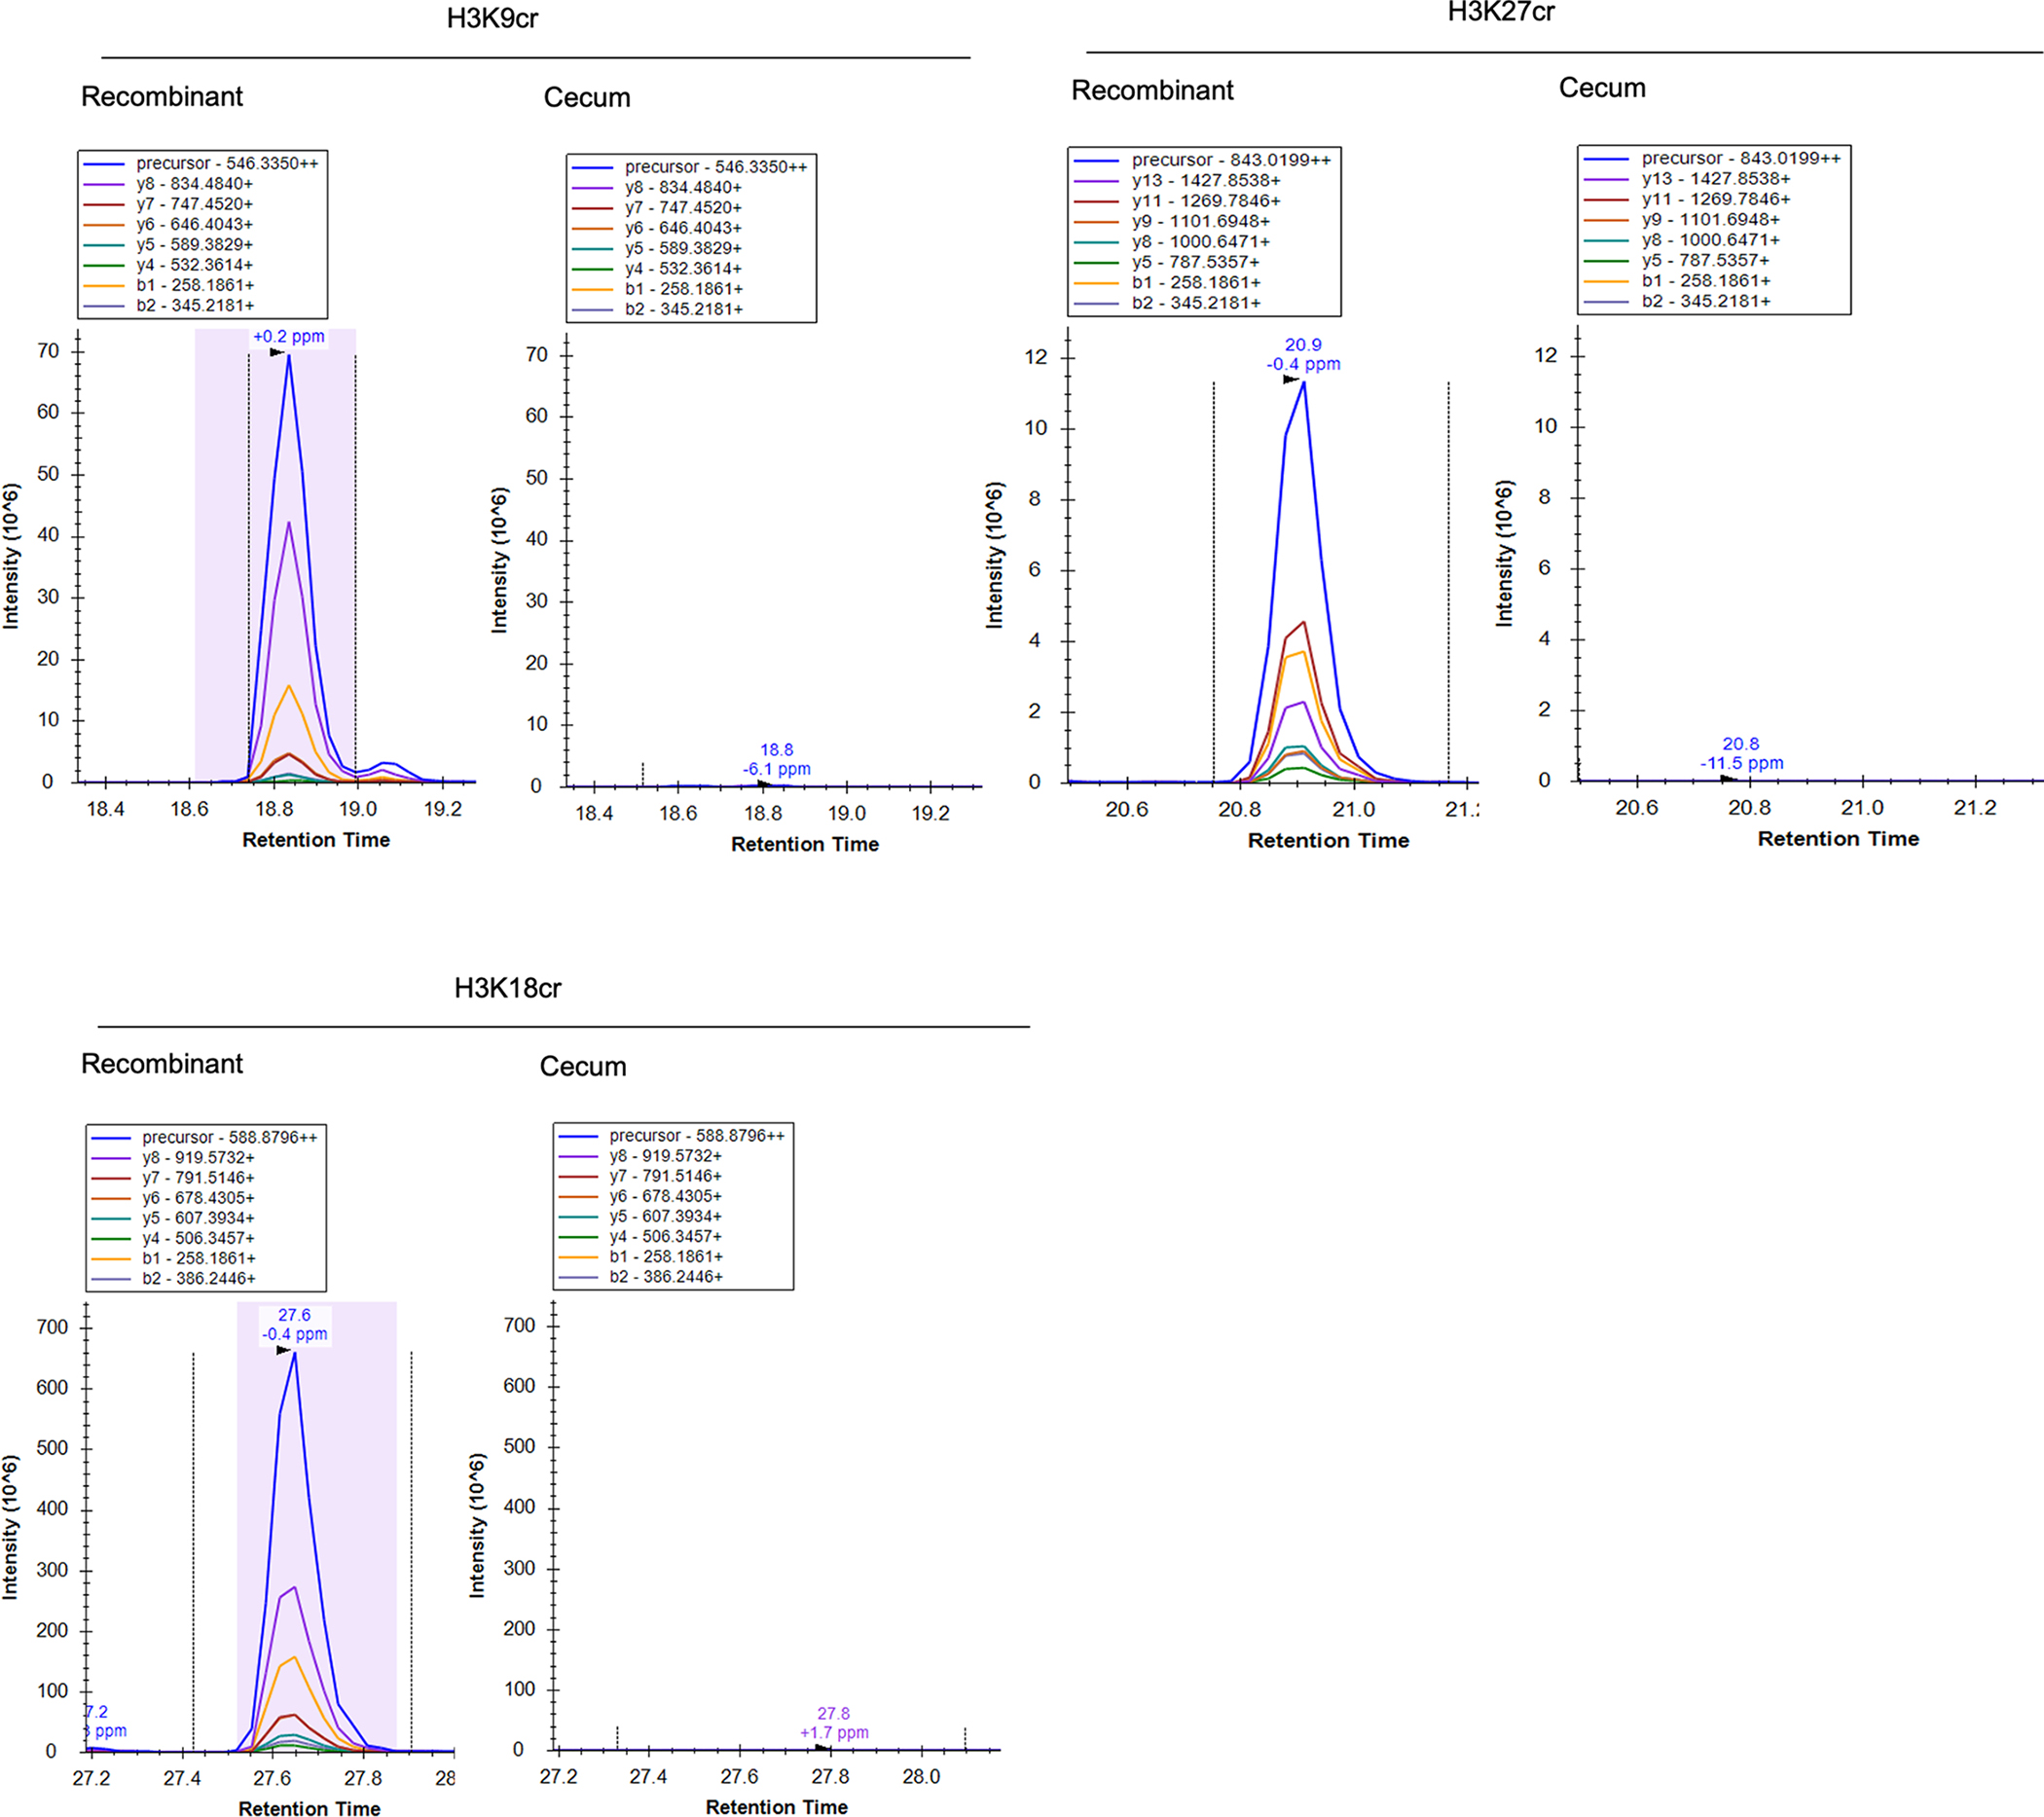
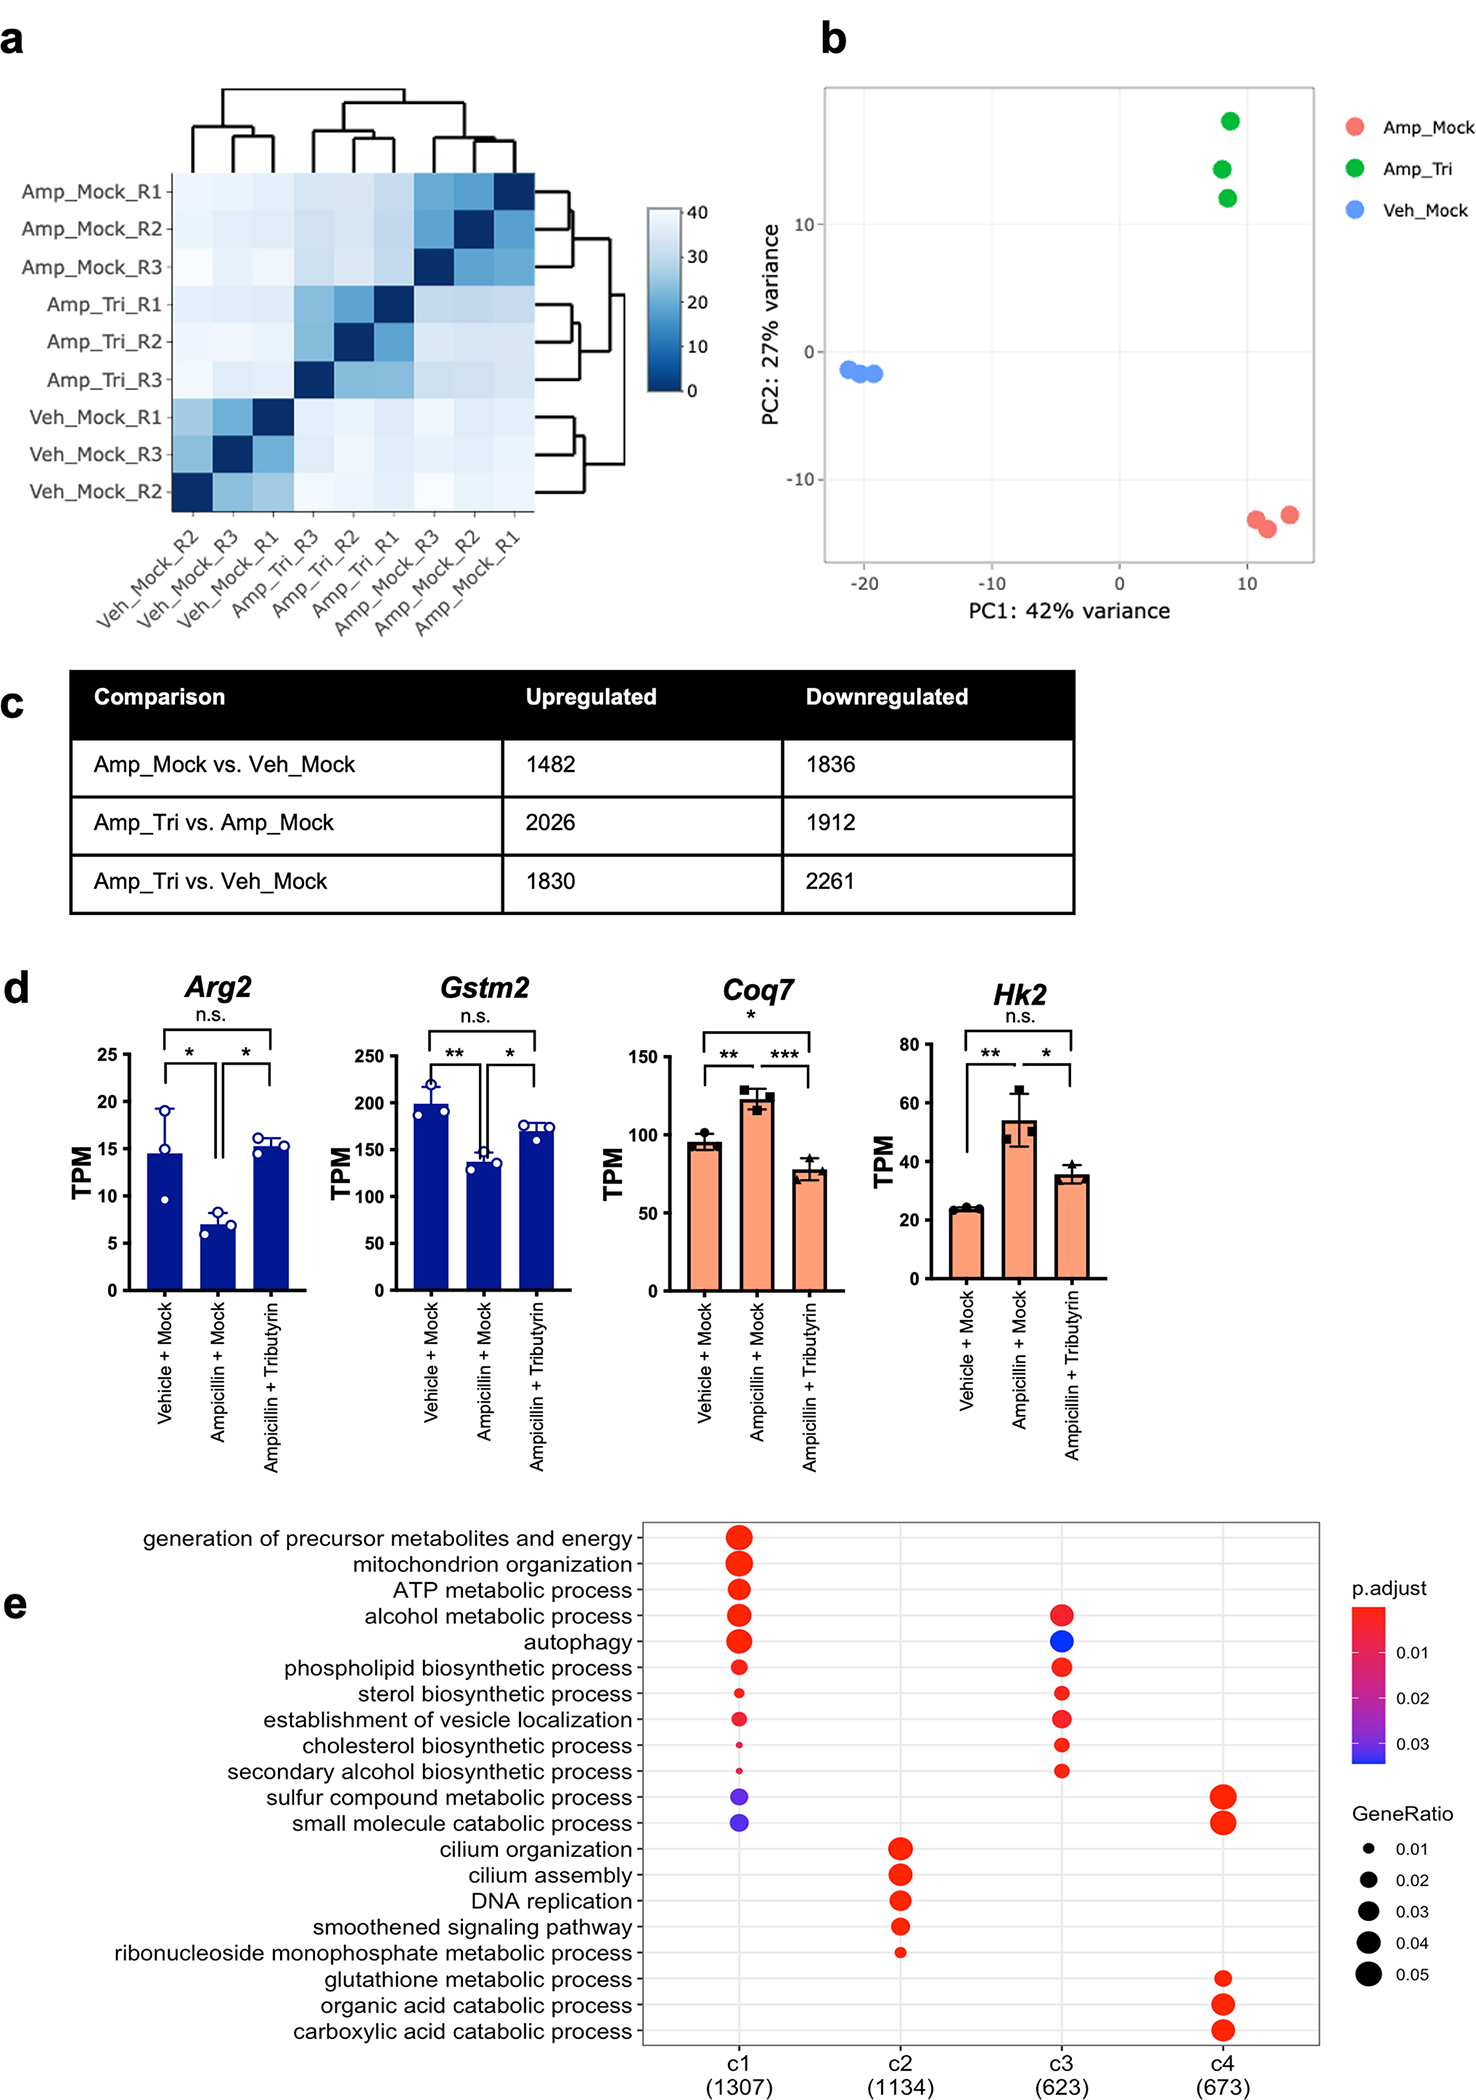
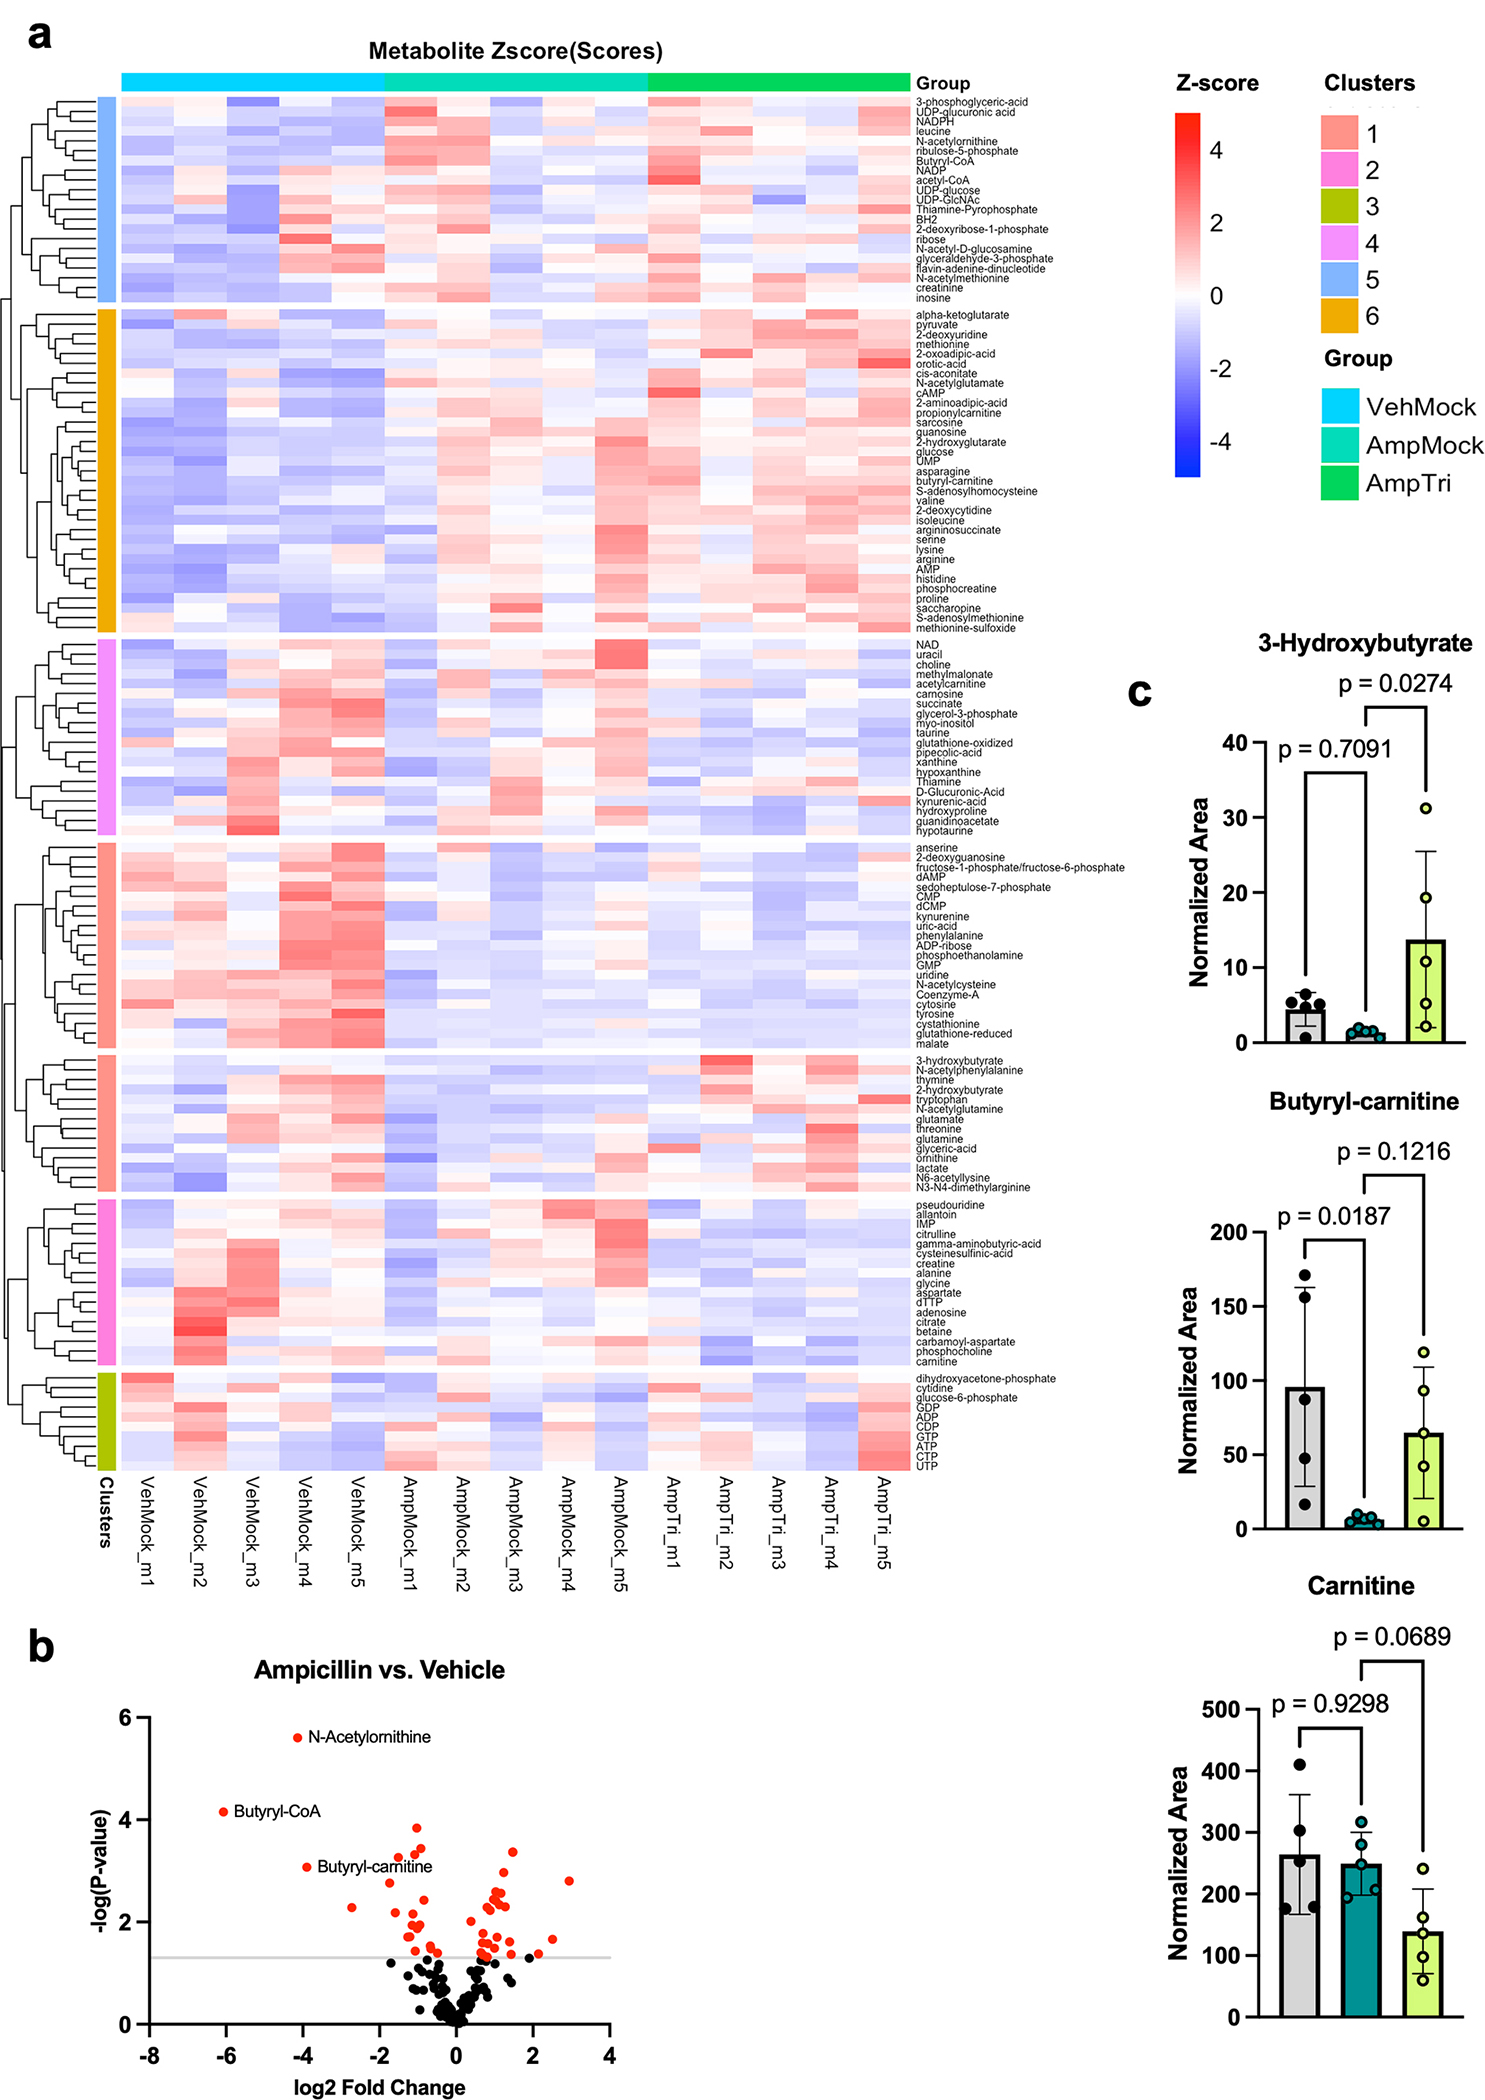
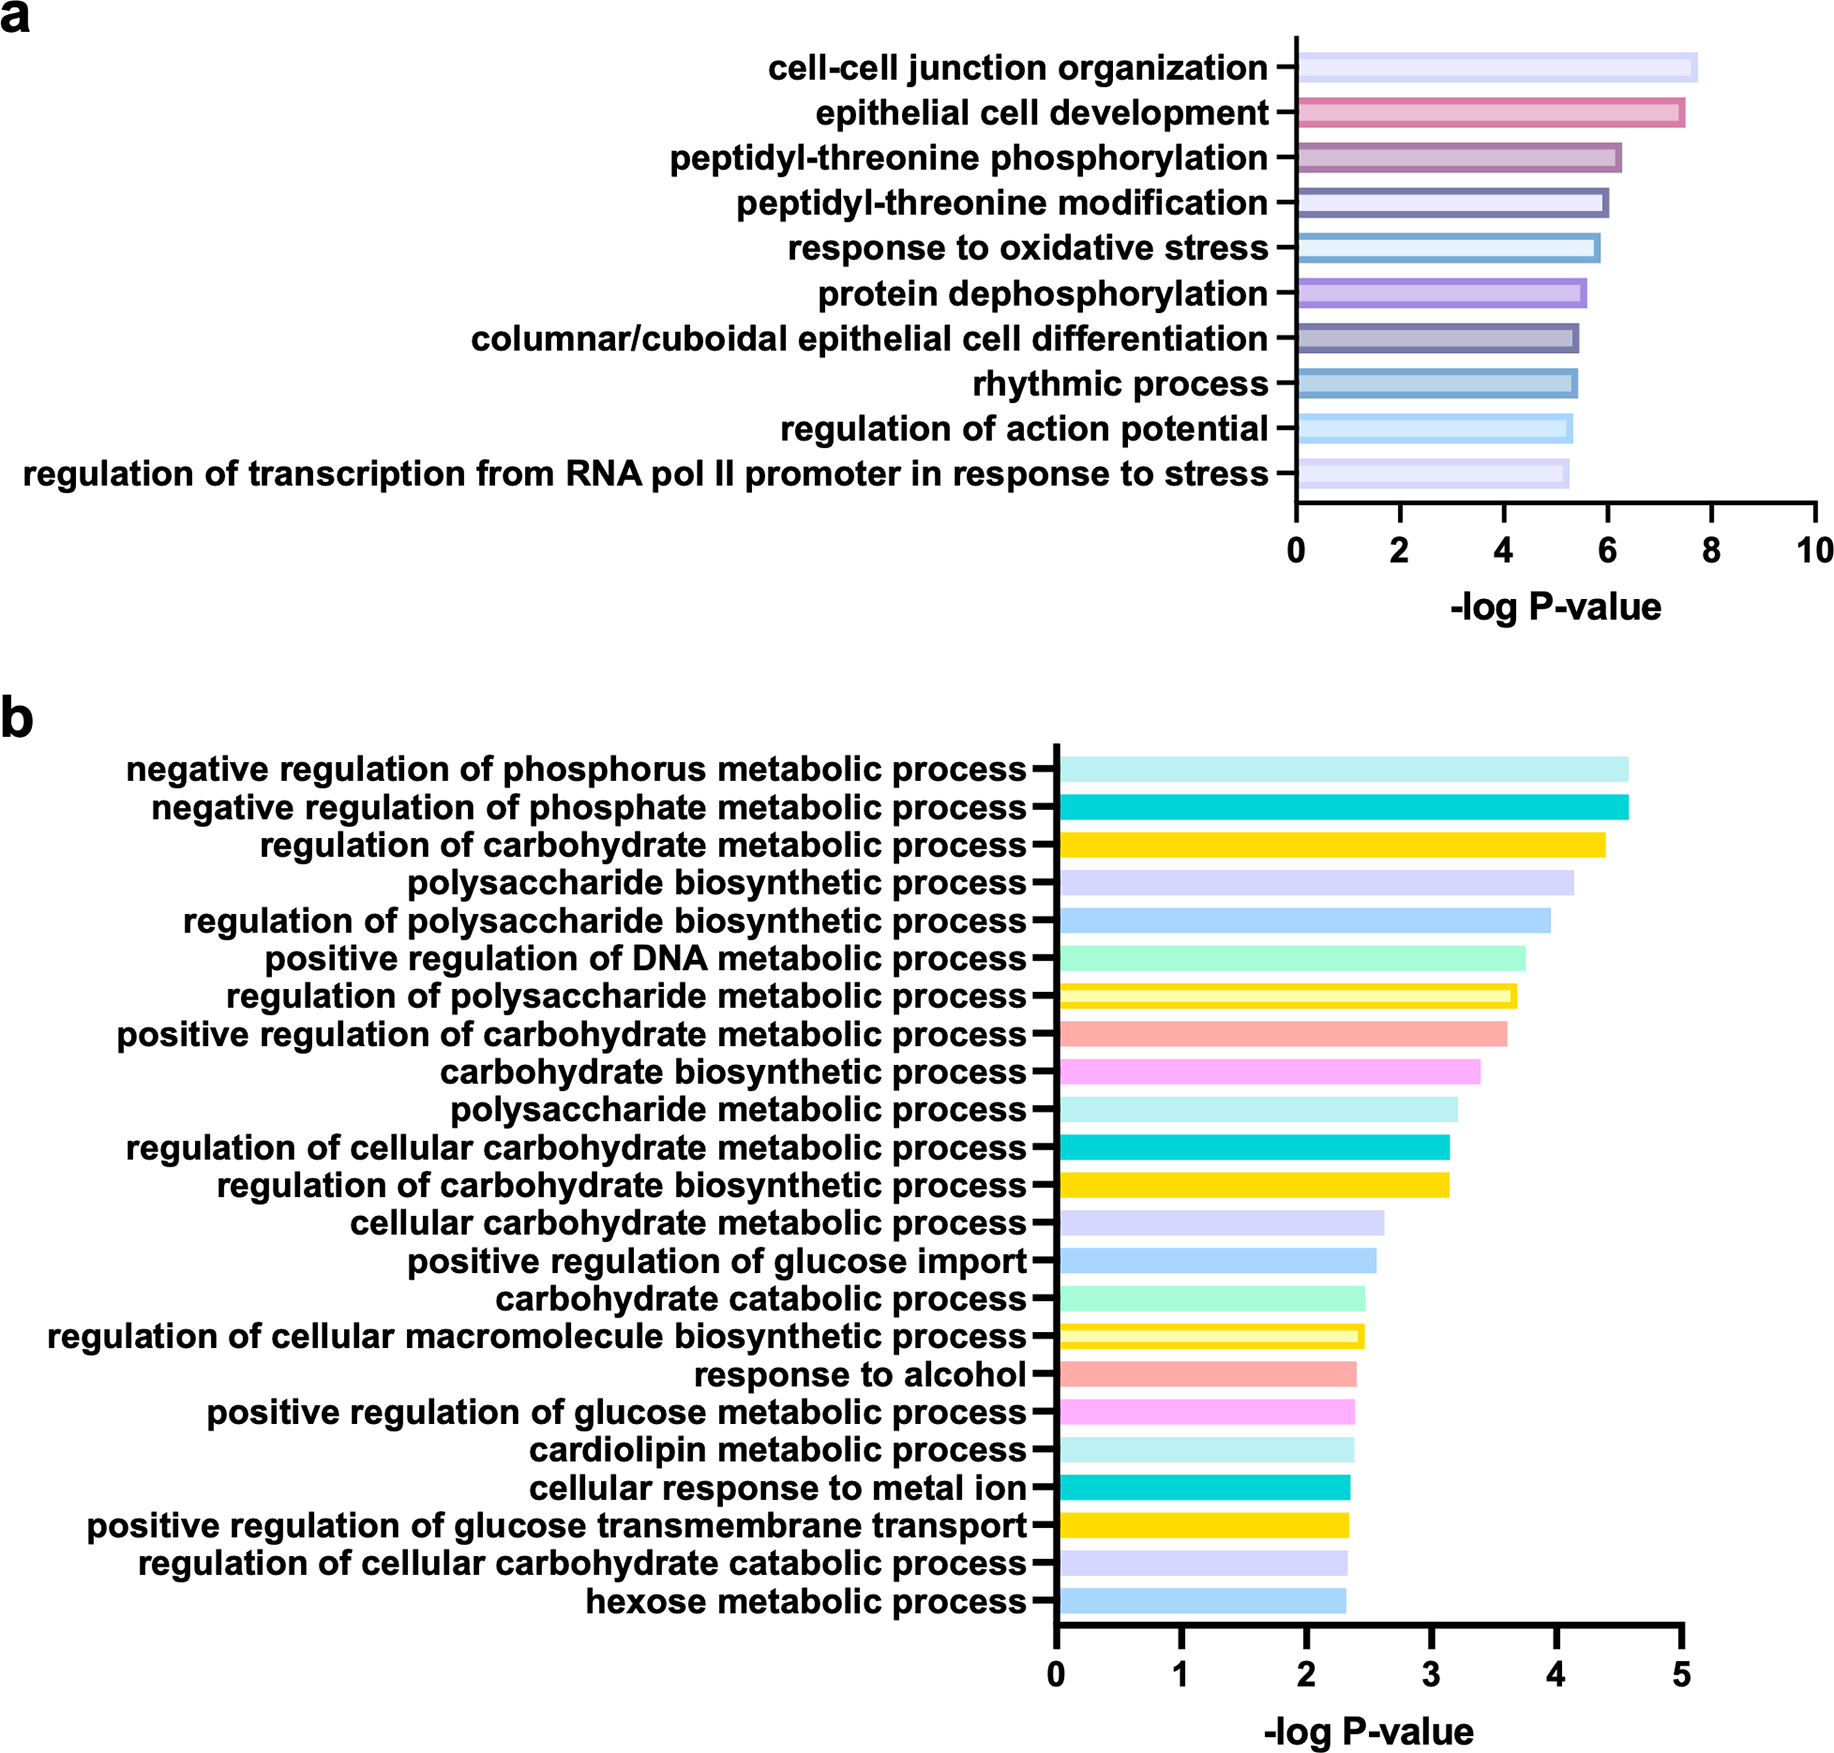
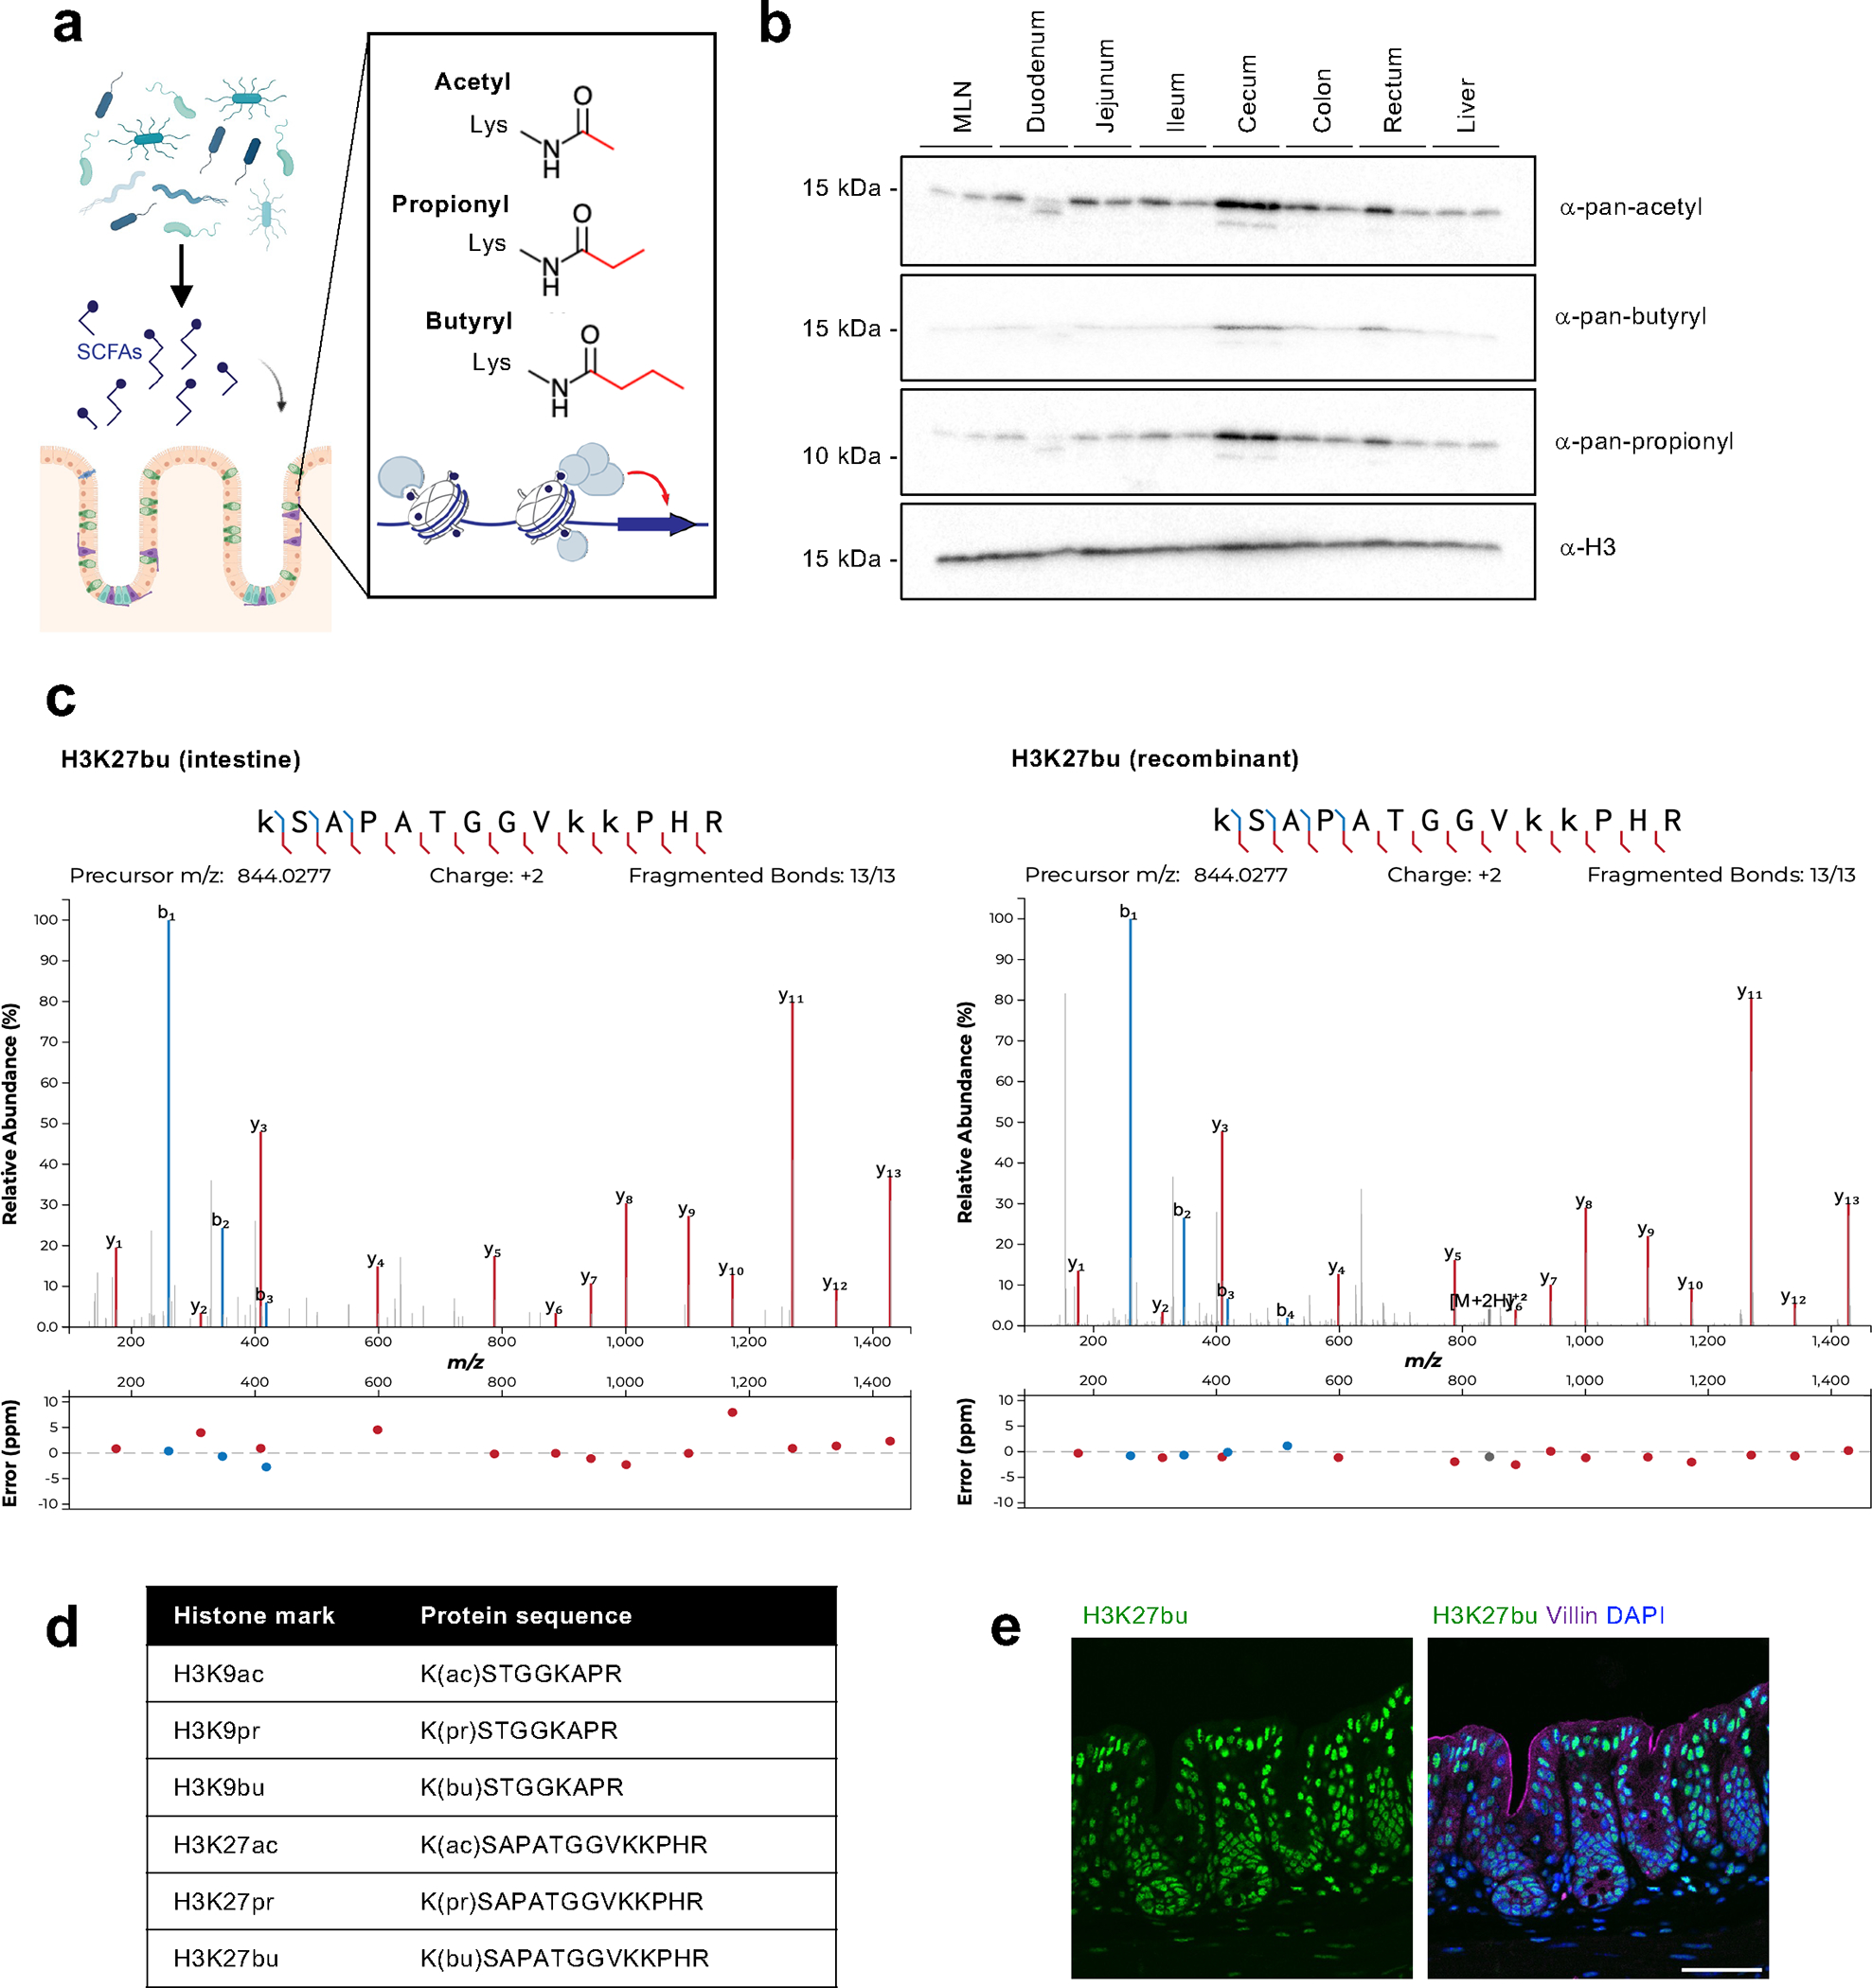
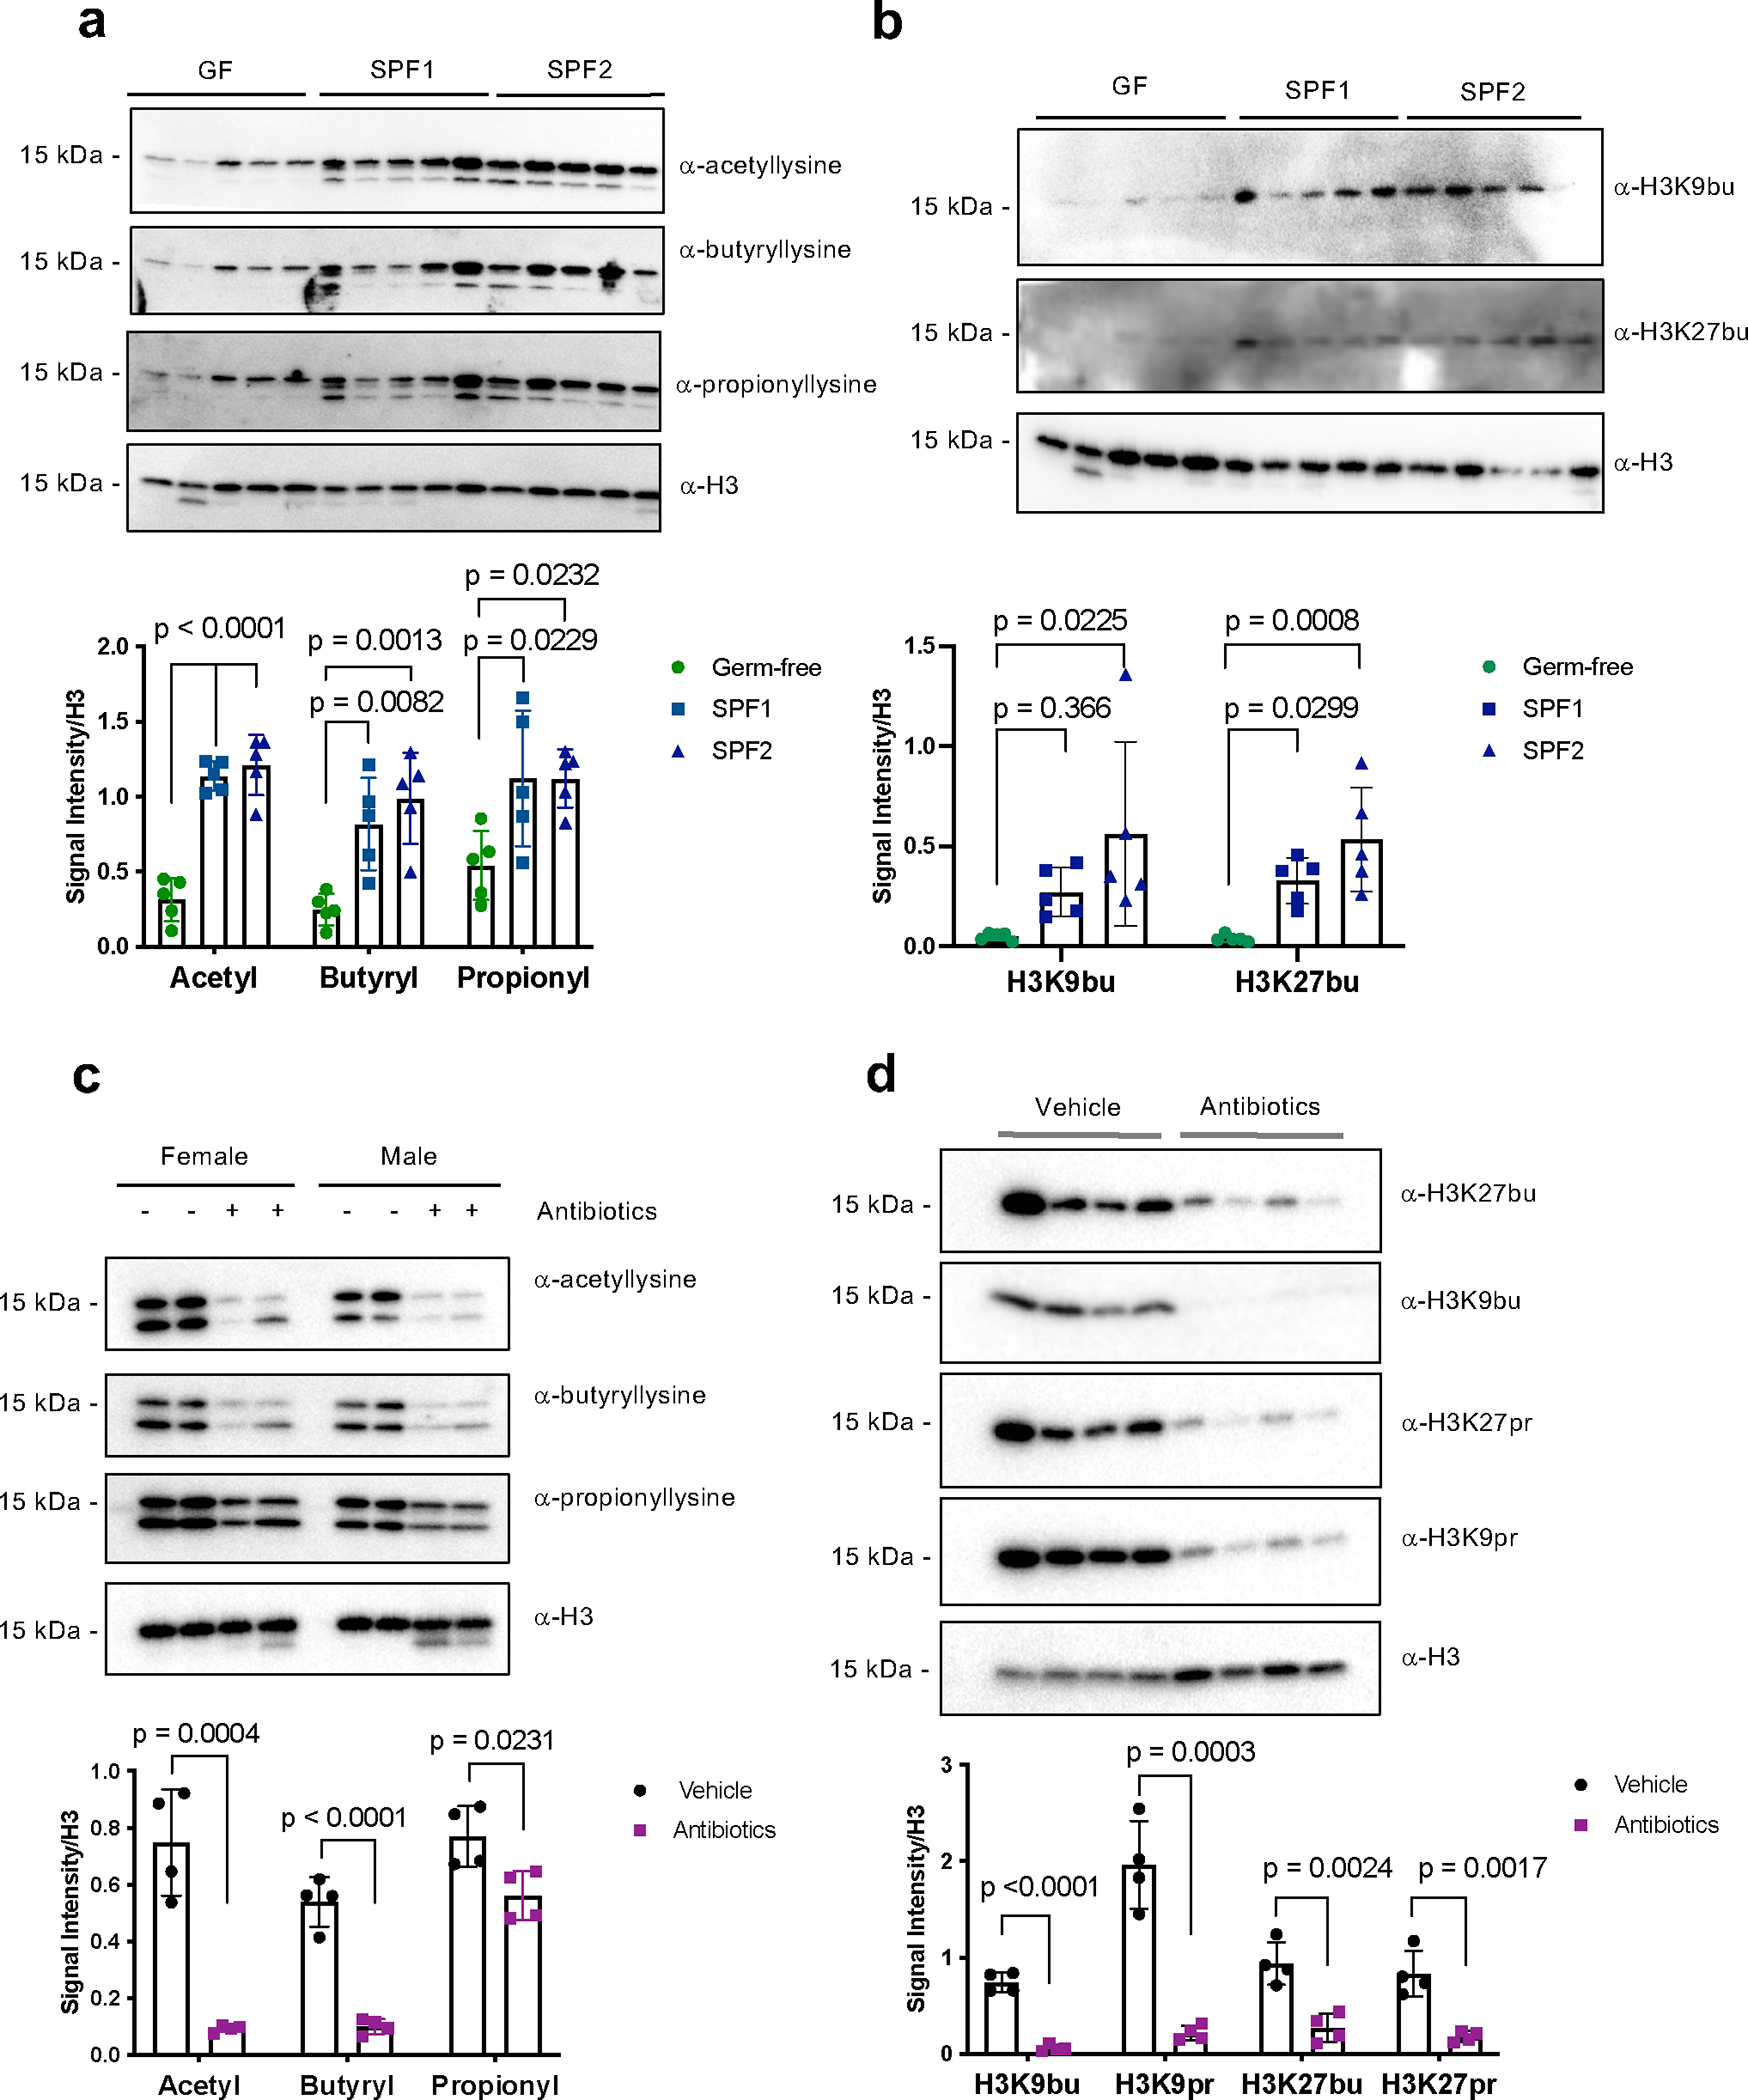
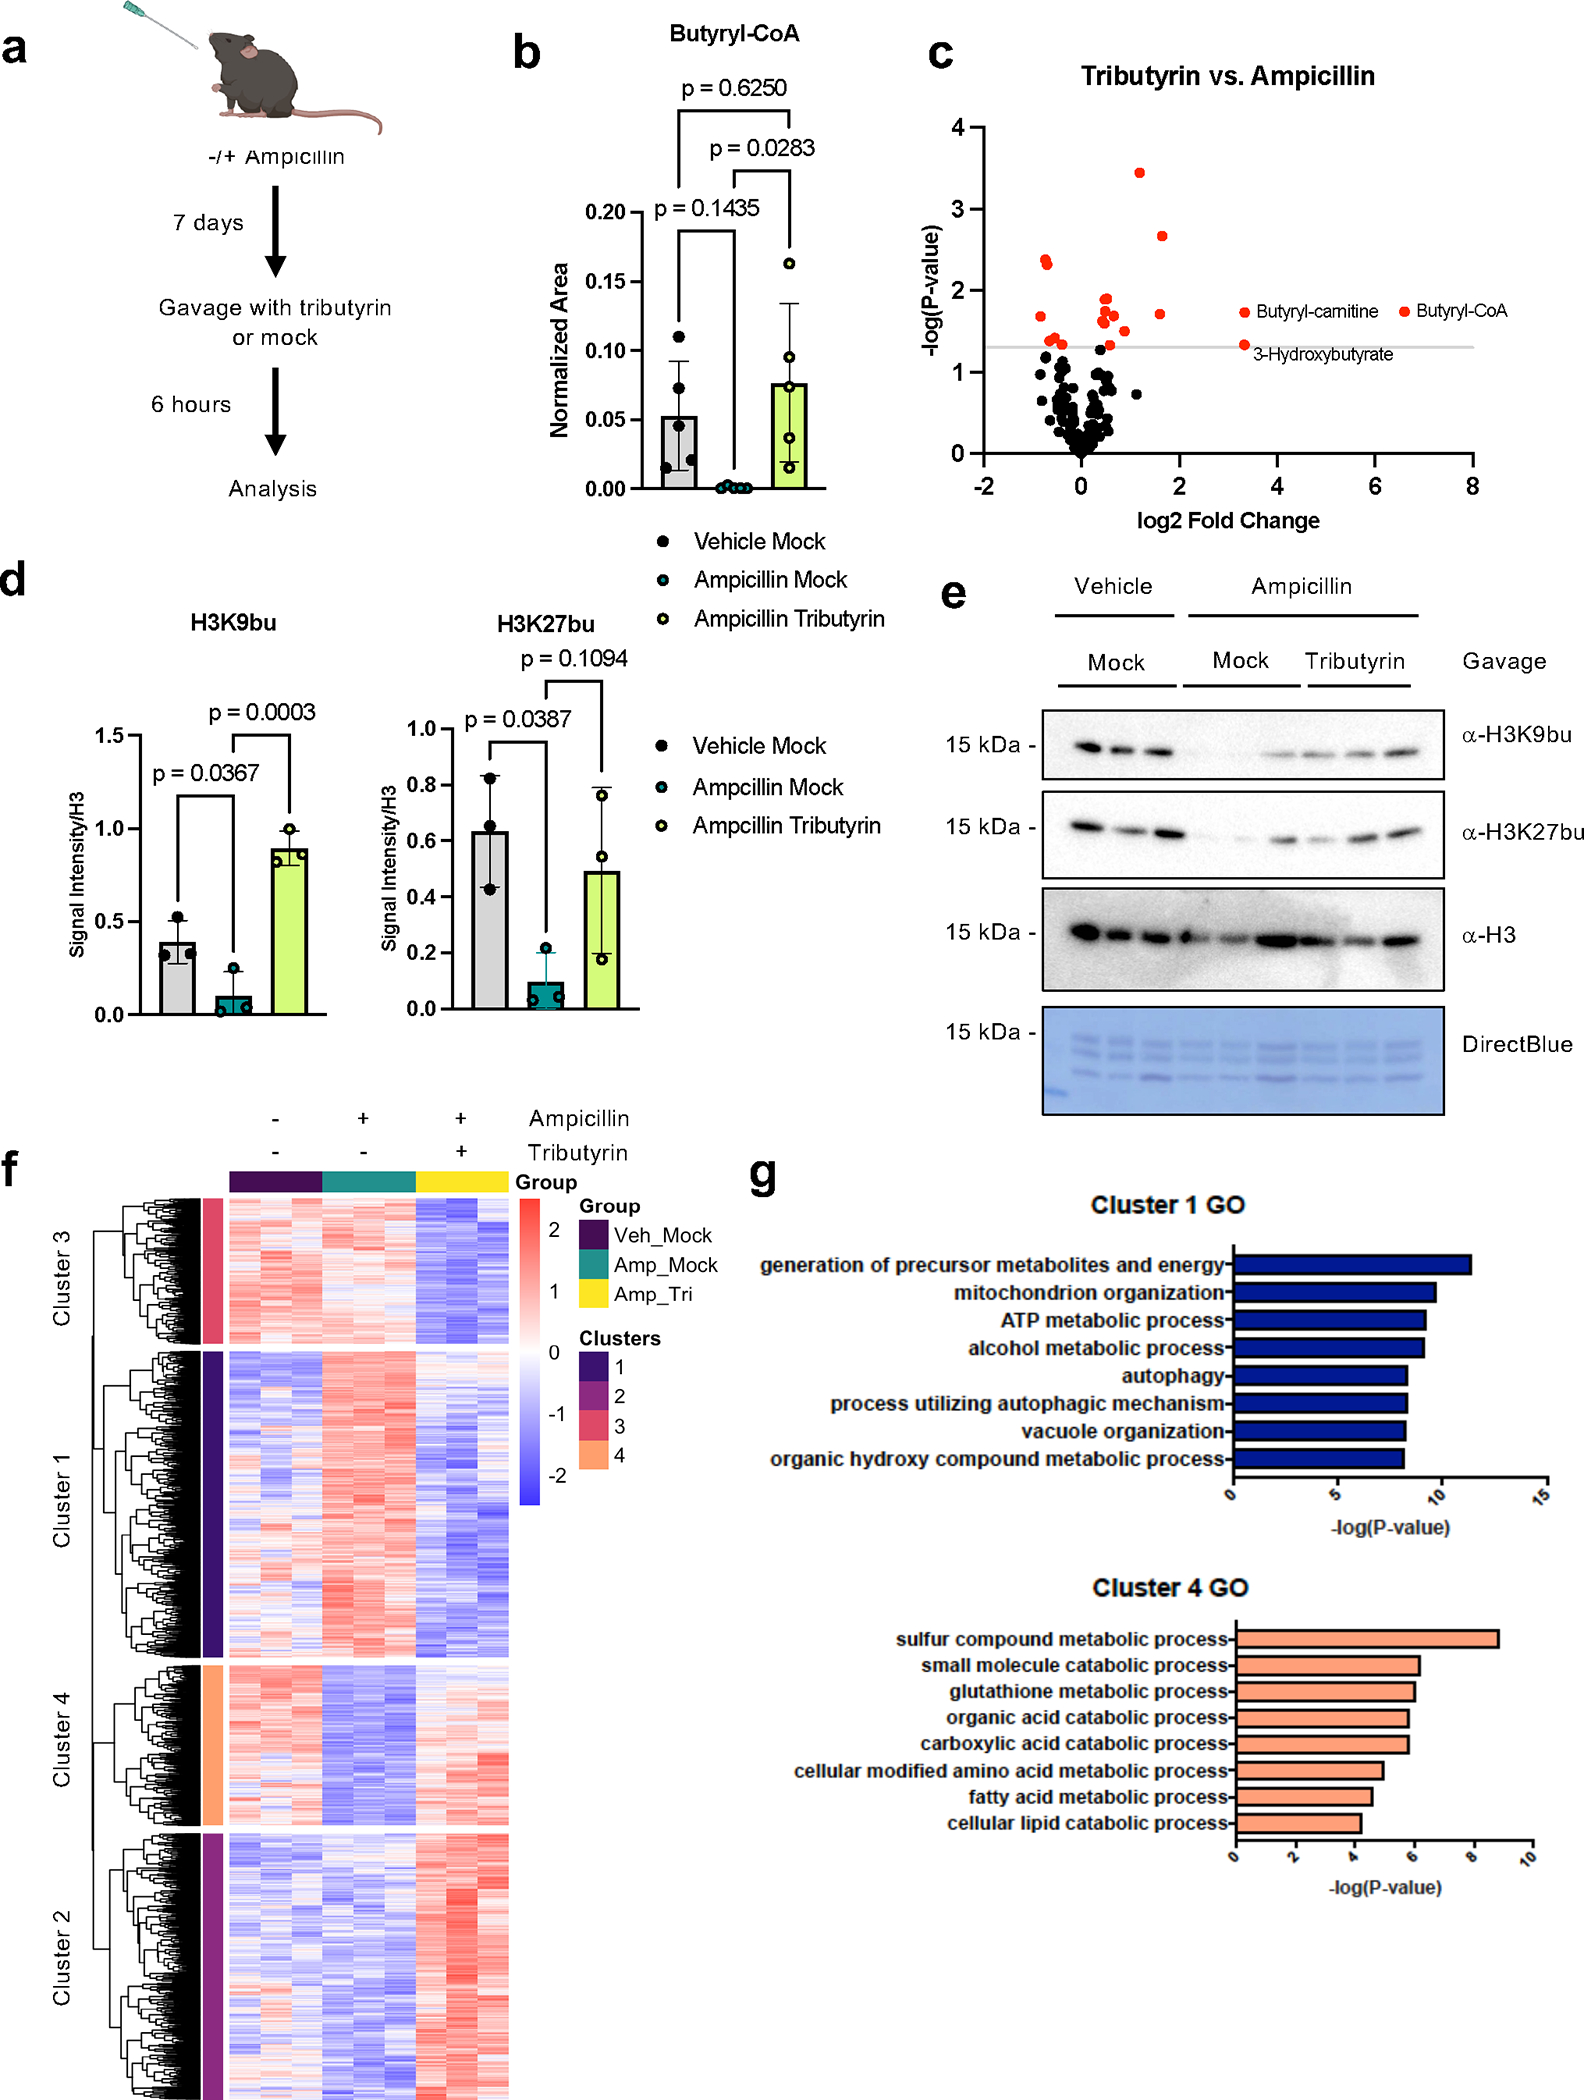
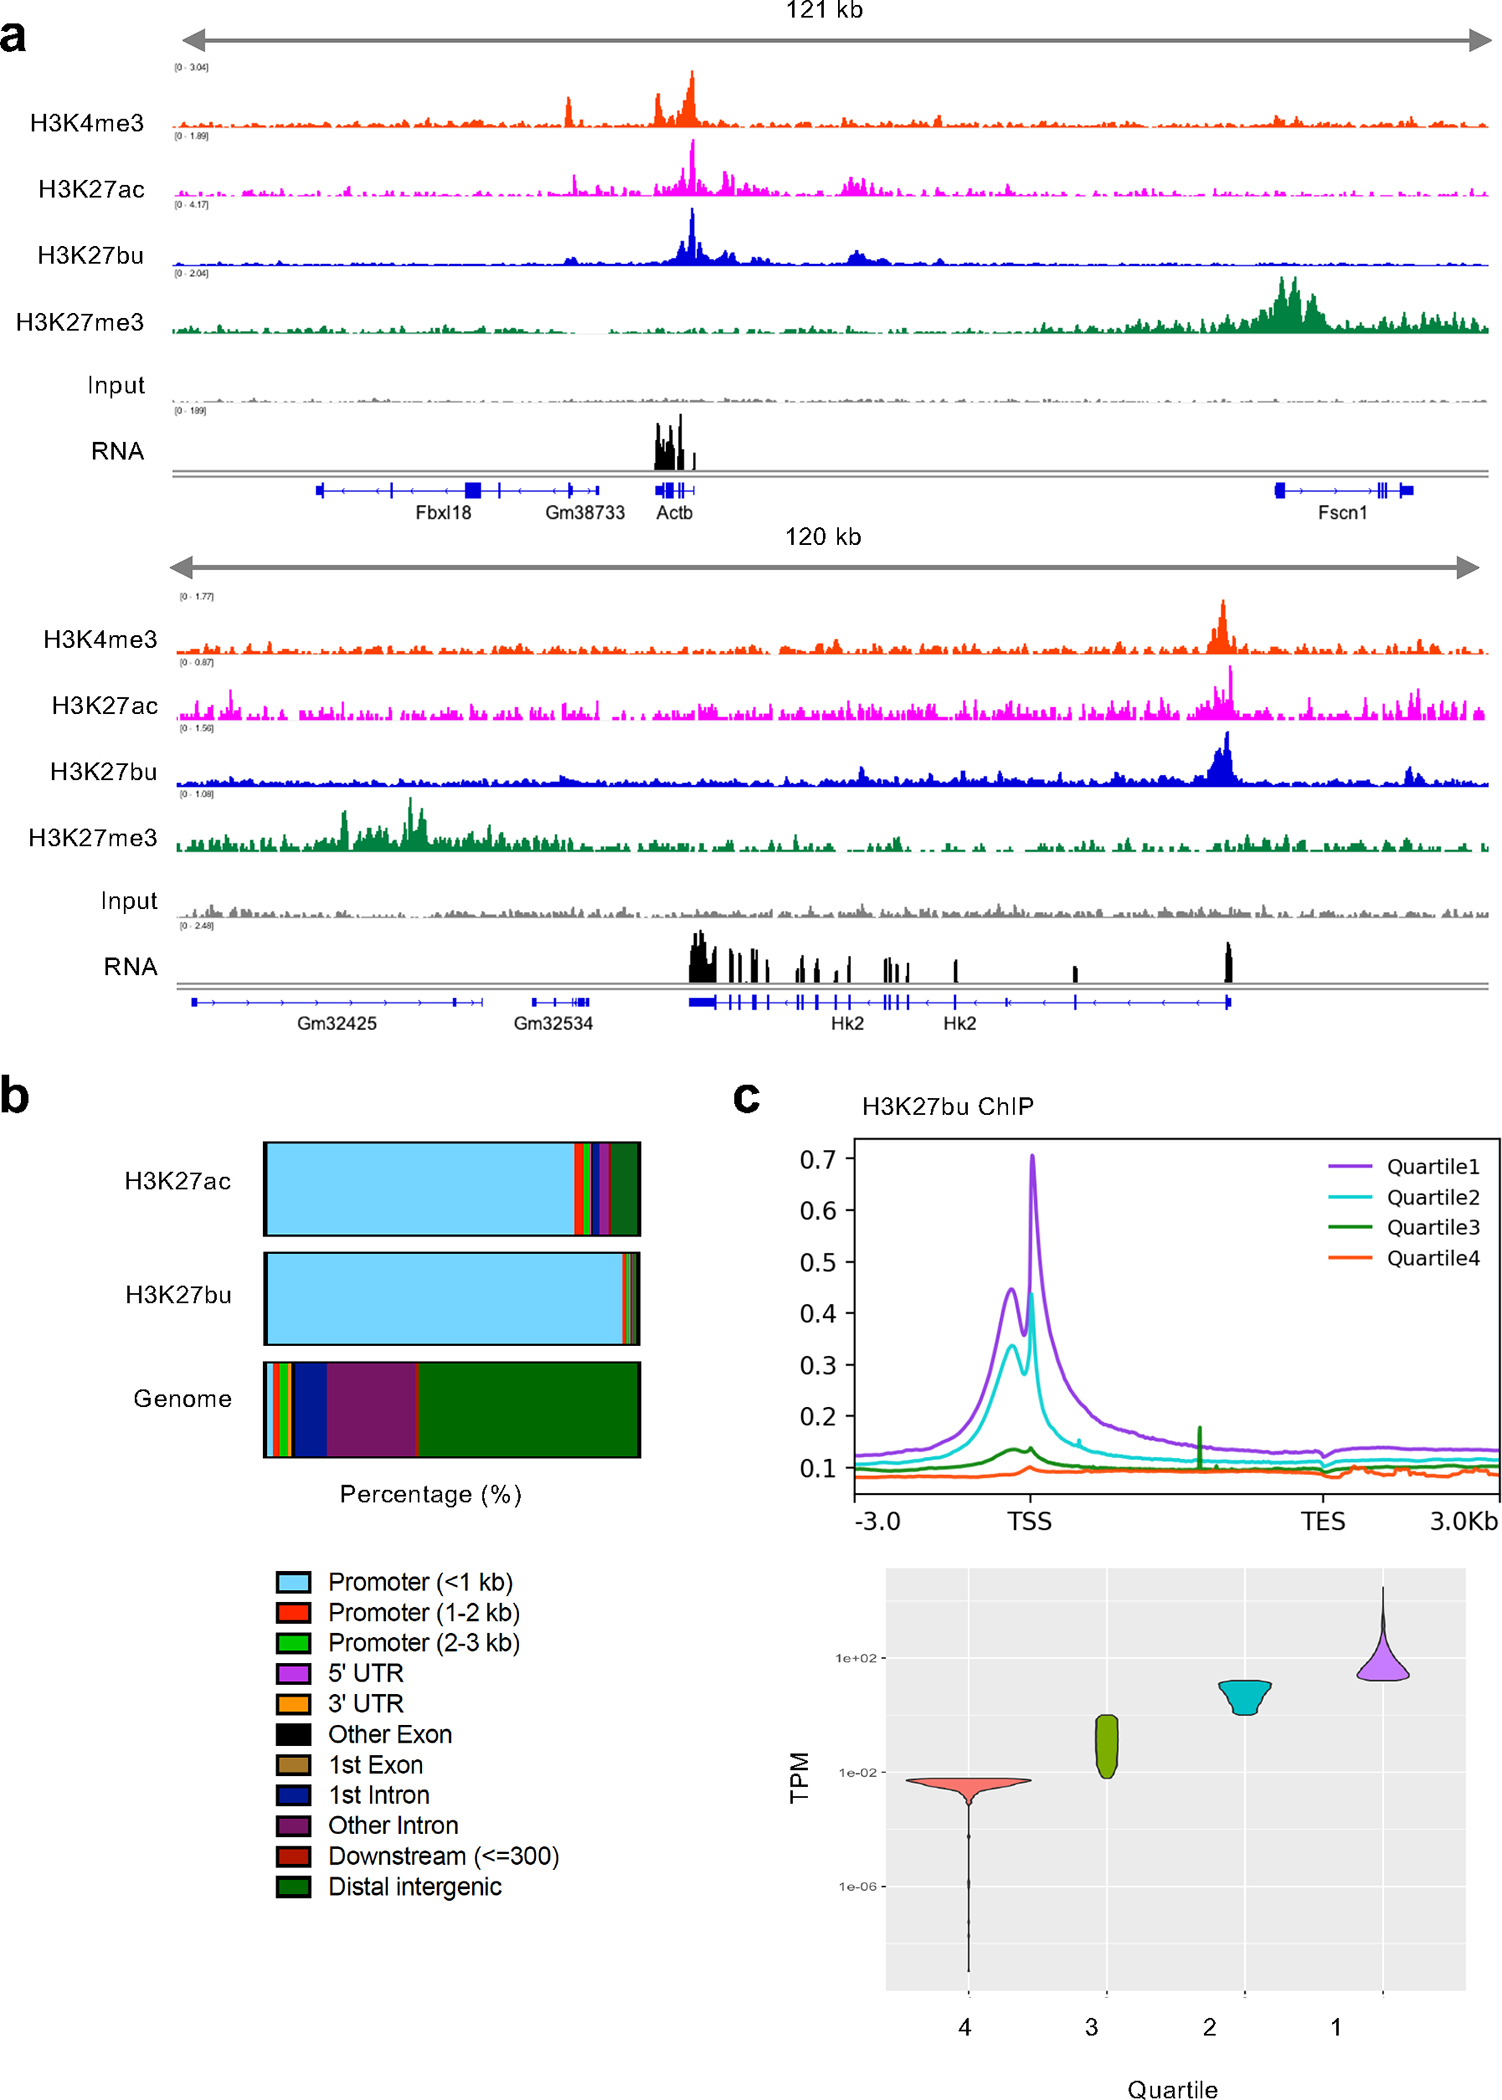
Post-translational modifications (PTMs) on histones are a key source of regulation on chromatin through impacting cellular processes, including gene expression1. These PTMs often arise from metabolites and are thus impacted by metabolism and environmental cues2-7. One class of metabolically regulated PTMs are histone acylations, which include histone acetylation, butyrylation, crotonylation and propionylation3,8. As these PTMs can be derived from short-chain fatty acids, which are generated by the commensal microbiota in the intestinal lumen9-11, we aimed to define how microbes impact the host intestinal chromatin landscape, mainly in female mice. Here we show that in addition to acetylation, intestinal epithelial cells from the caecum and distal mouse intestine also harbour high levels of butyrylation and propionylation on lysines 9 and 27 of histone H3. We demonstrate that these acylations are regulated by the microbiota and that histone butyrylation is additionally regulated by the metabolite tributyrin. Tributyrin-regulated gene programmes are correlated with histone butyrylation, which is associated with active gene-regulatory elements and levels of gene expression. Together, our study uncovers a regulatory layer of how the microbiota and metabolites influence the intestinal epithelium through chromatin, demonstrating a physiological setting in which histone acylations are dynamically regulated and associated with gene regulation.


Conflict of interest statement

Competing Interests Statement

The authors declare no competing interests.

Figures

Extended Data Fig. 1:
Extended Data Fig. 1:. Chromatograms of histone acylations in the mouse intestine by mass spectrometry.
(A) Chromatograms of fragment ions from precursor histone peptides with acyl marks from female C57BL/6J mouse cecum. Representative traces are shown out of n = 3 mice.
Extended Data Fig. 2:
Extended Data Fig. 2:. Fragmentation spectra and comparison of histone acylations.
(A) Fragmentation spectra of unmodified peptides and peptides with H3K27pr, H3K9bu, and H3K9pr. All representative spectra are from histones extracted from female C57BL/6J mouse cecal samples. Representative traces are shown out of n = 3 mice. (B) Butyrylated peptides are not as readily detected as acetylated peptides at low relative abundances. Concomitant serial dilution of recombinant human nucleosomes with acetylated and butyrylated H3K9 and H3K27 nucleosomes into unmodified nucleosomes were analyzed by mass spectrometry.
Extended Data Fig. 3:
Extended Data Fig. 3:. Targeted mass spectrometry for crotonylated histones in the mouse cecum.
Chromatograms of fragment ions from precursor histone peptides from recombinant standards with crotonylated residues (left) or female C57BL/6J mouse cecum (right). Representative traces are shown out of n = 9 mice.
Extended Data Fig. 4:
Extended Data Fig. 4:. Characterization of site-specific butyryl antibodies.
Abbreviations are as follows: ac = acetyl, bu = butyryl, and cr = crotonyl. Testing of antibody specificity using recombinant nucleosomes. 30 or 100 ng recombinant human nucleosomes were run on an SDS-PAGE gel and subjected to immunoblotting. A representative blot is shown from two independent experiments.
Extended Data Fig. 5:
Extended Data Fig. 5:. Gut microbial composition is altered following antibiotic treatments.
C57BL/6J female mice were treated either with vehicle (10 g/l Splenda, n = 4 and n = 5), an antibiotic cocktail of 1 g/l ampicillin, 1 g/l neomycin, 0.5 g/l vancomycin, and 0.5 g/l metronidazole (n = 4) or ampicillin alone (n = 5). (A) Cecal weights are increased upon antibiotic treatment. Mice and intact ceca were weighed and the ratio of cecal weight to bodyweight is displayed. Statistical significance was determined by Student’s t-test. Graphs display mean and standard error. (B) Treatment with antibiotics causes alterations in the gut microbiota. 16S sequencing was performed on DNA extracted from mouse feces and the top ten bacterial families detected are shown.
Extended Data Fig. 6:
Extended Data Fig. 6:. Supplemental RNA-seq data.
C57BL/6J female mice were divided into three different groups (n = 3 biologically independent animals per group): vehicle treated and mock gavaged (Veh_Mock), Ampicillin treated and mock gavaged (Amp_Mock), and Ampicillin treated with tributyrin gavage (Amp_Tri). Cecal IECs were isolated for RNA sequencing. (A) Heatmap of correlation between samples. Pearson correlation was performed of gene expression measurements across samples using DEseq2. (B) Principal component analysis of RNA-seq samples. (C) Table of significant differential gene expression across groups. Gene expression changes were identified using DEseq2 and p-values less than 0.05 were considered significant. The Wald test was used as part of the DESeq2 package for differential gene analysis, along with multiple testing correction using Benjamini-Hochberg false discovery rate to get the padj value. (D) Visualization of expression of select genes in clusters 1 (blue) and 4 (red). Graphs display mean and standard error. * p-value = < 0.05, ** p-value = < 0.01, *** p-value = < 0.001 by one-way ANOVA and adjusted for multiple comparisons. (E) Gene ontology analysis of all clusters of differential gene expression. Over Representation Analysis was performed using a one-sided version of Fisher’s exact test in the clusterProfiler package.
Extended Data Fig. 7:
Extended Data Fig. 7:. Metabolic profiling of cecal tissues following treatments.
C57BL/6J female mouse cecal tissue was processed for polar metabolomics analysis by mass spectrometry. (A) Metabolomics heatmap of all metabolites detected. Heatmap displays z-scores of normalized area under the curve for each metabolite across different samples (n=5 biologically independent animals per group) and treatments. List of individual metabolites can be found in Supplementary Table 2. (B) Volcano plots displaying changes in metabolites comparing ampicillin treated mice to vehicle control. Red dots are metabolites that are significantly changed (p-value < 0.05 by unpaired two-tailed Student’s t-test) and grey line indicates significance threshold. (C) Metabolites related to butyrate metabolism are changing with ampicillin or tributyrin treatments in mice. Metabolites related to butyrate metabolism (3-hydroxybutyrate and butyryl-carnitine) are altered following mouse treatments, while carnitine serves as an example of a metabolite that is largely unchanging and does not follow the same pattern. Graphs display mean and standard error. Statistical significance was determined by one-way ANOVA and adjusted for multiple comparisons (n=5 biologically independent animals per group).
Extended Data Fig. 8:
Extended Data Fig. 8:. Gene ontology of top H3K27bu ChIP-seq peaks.
The top 10% of H3K27bu peaks from female C57BL/6J mouse cecal intestinal epithelial cells were analyzed for enrichment of gene ontology categories. The peak counts of each of two replicate ChIP-seq experiments from biologically independent mice were averaged, and then the top 10% used for analysis. Over Representation Analysis was performed using a one-sided version of Fisher’s exact test in the clusterProfiler package. (A) Top 10 most significantly enriched GO categories are displayed. (B) All GO categories related to cellular metabolism, excluding any related to oxidative stress, are displayed.
Fig. 1:
Fig. 1:. The intestine is an environment that harbors a variety of histone acyl marks.
(A) Schematic of overall hypothesis and the structure of select histone acylations. Created with BioRender.com. (B) Tissue distribution of histone acylations. Histones were purified from tissues from female C57BL/6 mice (n = 2 shown) using acid extraction and then subject to immunoblotting with pan-lysine antibodies targeting different acylation modifications. H3 serves as a loading control. (C) Characterization of specific sites of histone acylation. LC-MS/MS analysis of extracted histone from the mouse cecum. Representative fragmentation spectra are shown for endogenous H3K27bu in the intestine (left) and for recombinant H3K27bu on modified nucleosomes (right). (D) Table summarizing the different histone acyl marks detected in the mouse cecum. (E) H3K27bu displays bright staining in the intestinal epithelium. Representative immunofluorescence images of H3K27bu, Villin (marker of epithelium), and DAPI in mouse cecal sections, n = 5 female C57BL/6 mice. Scale bar = 50 μm.
Fig. 2:
Fig. 2:. Histone acyl marks, including select non-acetyl acyl marks, are dependent on the microbiota.
Immunoblotting (top) and quantification of signal intensity relative to histone H3 (bottom). Histones were extracted from the cecum and each lane represents an individual mouse. Quantification was performed in ImageJ and H3 serves as a loading control. All graphs depict mean and standard error. (A) Pan-acylations and (B) specific histone acylations are reduced in germ-free mice. Germ-free (GF) mice (n = 5), conventional mice (SPF = specific pathogen free, SPF1 = C57BL/6NTac, n = 5, SPF2 = C57BL/6J, n =5, all mice in A-B are female). Statistical significance was determined by one-way ANOVA and adjusted for multiple comparisons using Dunnett’s test. (C) Pan-acylations and (D) specific histone acylations are reduced in antibiotic-treated mice. C57BL/6J mice were treated with (n = 4) or without (n = 4) antibiotics (ampicillin, vancomycin, neomycin, and metronidazole) for seven days. Panel C shows results from both male and female mice (indicated), and panel D shows results from only female mice. Statistical significance was determined using the two-tailed Student’s t-test.
Fig. 3:
Fig. 3:. Microbial metabolites regulate select histone acyl marks and gene expression.
(A) Schematic of experimental system. Mice are treated with or without Ampicillin for seven days, followed by gavage with vehicle or tributyrin. Created with BioRender.com. (B) Intracellular butyryl-CoA is altered upon antibiotic and tributyrin treatment. Cecal tissues from mice were subject to metabolomic analysis by LC-MS, n = 5 female mice per group. Graph displays mean and standard error; statistical significance was determined by one-way ANOVA and adjusted for multiple comparisons. (C) Volcano plots displaying changes in polar metabolites across different conditions. Red dots are metabolites that are significantly changed (p-value < 0.05 by unpaired two-tailed Student’s t-test) and grey line indicates significance threshold. (D-E) Histone butyrylation dynamically changes in cecal tissues with butyrate treatment. Immunoblotting quantification (D) and image (E) showing levels of histone butyrylation in the cecum with different treatments. Representative experiment shown, n = 3 female mice per group. Quantification was performed in ImageJ and H3 serves as a loading control. Graphs depict mean and standard error; statistical significance was determined by one-way ANOVA and adjusted for multiple comparisons. (F) Heatmap of significant genes changing with tributyrin treatment by RNA-seq in cecal IECs. Significant genes changing between mice treated with ampicillin plus tributyrin vs. ampicillin with mock gavage, padj < 0.05 by pairwise test, are shown. The Wald test was used as part of the DESeq2 package for differential gene analysis, along with multiple testing correction using Benjamini-Hochberg false discovery rate to get the padj value. Hierarchical clustering was performed after determining optimal number of clusters using the elbow method. The heatmap intensity corresponds to the rlog counts as shown in the legend. Individual mice serve as biological replicates, n = 3 per group. (G) Gene ontology (GO) of significant differentially expressed genes in clusters 1 and 4. Top eight most significantly enriched categories are shown. Over Representation Analysis was performed using a one-sided version of Fisher’s exact test in the clusterProfiler package.
Fig. 4:
Fig. 4:. Histone butyrylation on H3K27 is associated with active gene regulatory elements and gene expression in intestinal epithelial cells.
(A) Representative tracks of ChIP-seq data in cecal intestinal epithelial cells from female C57BL/6J mice. At least two biological replicates were performed for each ChIP. A representative RNA-seq track is also shown (n = 3). ChIP and RNA signal on a representative housekeeping gene Actb (top) and tributyrin-regulated gene Hk (bottom). (B) Genomic localization of both H3K27ac and H3K27bu consensus peaks of two replicates each and genomic localizations (Genome). X-axis depicts percentage of sites. (C) H3K27bu localizes to highly expressed genes. Meta plots of a representative H3K27bu ChIP signal shown above violin plot displaying the quartiles of gene expression.

References

    1. Allis CD & Jenuwein T The molecular hallmarks of epigenetic control. Nat Rev Genet 17, 487–500 (2016). - PubMed
    1. Sabari BR et al. Intracellular Crotonyl-CoA Stimulates Transcription through p300-Catalyzed Histone Crotonylation. Molecular Cell 58, 203–215 (2015). - PMC - PubMed
    1. Sabari BR, Zhang D, Allis CD & Zhao Y Metabolic regulation of gene expression through histone acylations. Nature Reviews Molecular Cell Biology 18, 90–101 (2016). - PMC - PubMed
    1. Zhang D et al. Metabolic regulation of gene expression by histone lactylation. Nature 574, 575–580 (2019). - PMC - PubMed
    1. Wellen KE et al. ATP-Citrate Lyase Links Cellular Metabolism to Histone Acetylation. Science 324, 1076–1080 (2009). - PMC - PubMed

Publication types