. 2024 Apr;43(7):1351-1383.
doi: 10.1038/s44318-024-00059-8. Epub 2024 Feb 27.

Rewiring of the phosphoproteome executes two meiotic divisions in budding yeast

Affiliations

Rewiring of the phosphoproteome executes two meiotic divisions in budding yeast

Lori B Koch et al. EMBO J. 2024 Apr.

Abstract

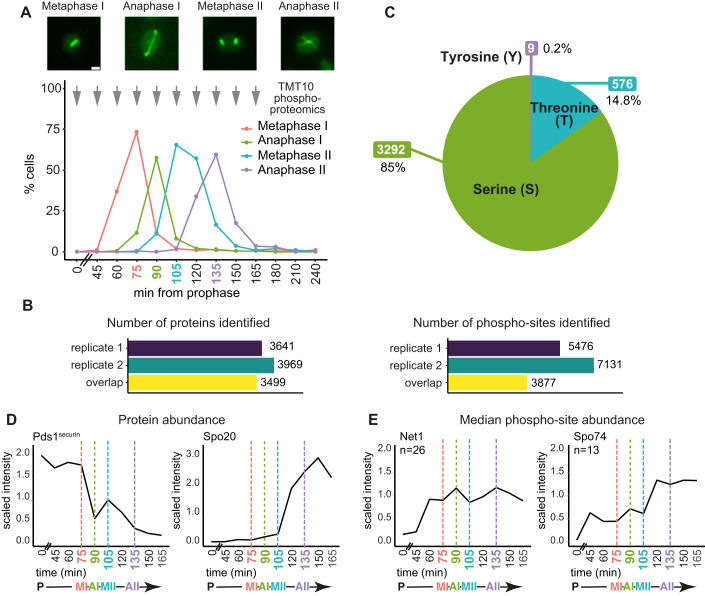
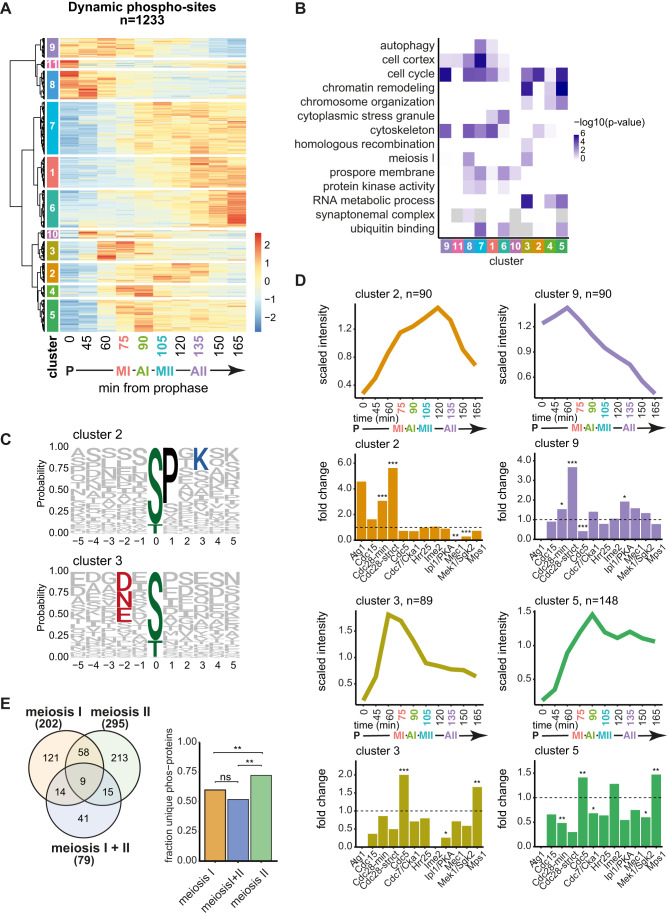
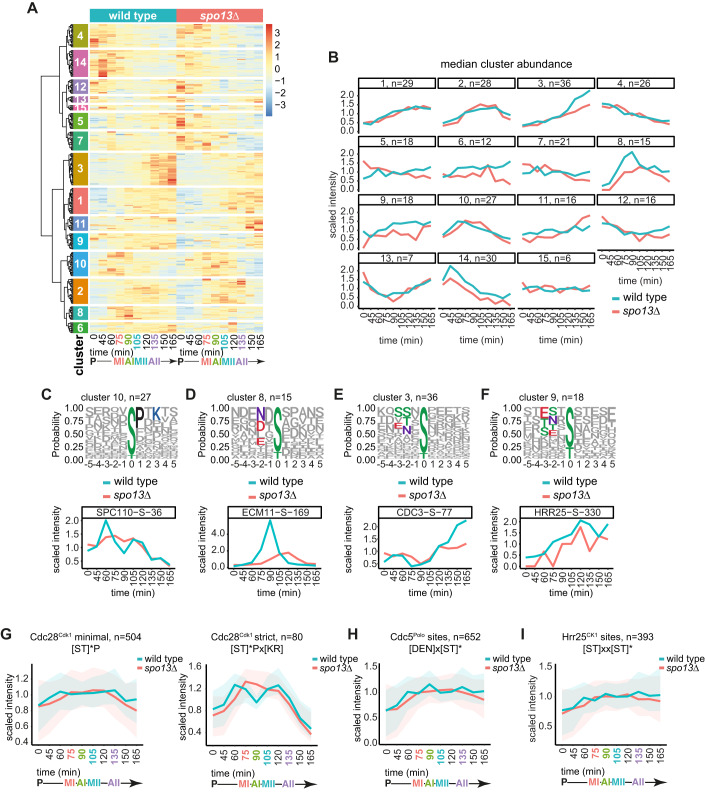
The cell cycle is ordered by a controlled network of kinases and phosphatases. To generate gametes via meiosis, two distinct and sequential chromosome segregation events occur without an intervening S phase. How canonical cell cycle controls are modified for meiosis is not well understood. Here, using highly synchronous budding yeast populations, we reveal how the global proteome and phosphoproteome change during the meiotic divisions. While protein abundance changes are limited to key cell cycle regulators, dynamic phosphorylation changes are pervasive. Our data indicate that two waves of cyclin-dependent kinase (Cdc28Cdk1) and Polo (Cdc5Polo) kinase activity drive successive meiotic divisions. These two distinct phases of phosphorylation are ensured by the meiosis-specific Spo13 protein, which rewires the phosphoproteome. Spo13 binds to Cdc5Polo to promote phosphorylation in meiosis I, particularly of substrates containing a variant of the canonical Cdc5Polo motif. Overall, our findings reveal that a master regulator of meiosis directs the activity of a kinase to change the phosphorylation landscape and elicit a developmental cascade.

Keywords: Cell Cycle; Kinases; Meiosis; Phosphorylation; Proteomics.


Conflict of interest statement

The authors declare no competing interests.

Figures

Figure 1
Figure 1. Phosphoproteomics of a synchronous meiotic division cycle.
(A) Example images and quantification of spindle immunofluorescence at the indicated timepoints after release of wild-type cells from a prophase I block. (n = 200 cells per timepoint). Arrows indicate time of harvesting for TMT10 proteomics and phosphoproteomics. Scale bar equals 2 μm. (B) Total number of proteins (left) and phospho-sites (right) quantified for each of two biological replicate wild-type TMT10 timecourses and those common to both timecourses (overlap). (C) The proportion of phospho-sites centred on serine, threonine or tyrosine. (D) Median protein abundance across the timecourse for selected proteins Pds1securin and Spo20. (E) Median abundance of all detected phospho-sites of the proteins Net1 and Spo74. n = number of phospho-sites. Source data are available online for this figure.
Figure 2
Figure 2. Protein dynamics across a synchronous meiotic division cycle.
(A) Hierarchical clustering of abundances of dynamic proteins across the timecourse. See Dataset EV2 for list of proteins included in each cluster. (B) Median trend of proteins in each cluster from (A). (C) GO term enrichment of proteins in each cluster from (A, B). Data information: Statistics: cumulative hypergeometric test followed by correction for multiple testing (gprofiler2 R package gost function default settings). Source data are available online for this figure.
Figure 3
Figure 3. The landscape of phosphorylation across the meiotic divisions.
(A) Hierarchical clustering of dynamic phospho-sites. See Dataset EV4 for list of phospho-sites included in each cluster. (B) GO term enrichment of clusters. Data information: Statistics: Cumulative hypergeometric test followed by correction for multiple testing (gprofiler2 R package gost function default settings). (C) Motif logos of selected clusters. (D) Median lineplots of selected clusters with kinase motif enrichment analysis bar graph. Data information: Statistics: Fisher’s exact test. *P < 0.05, **P < 0.01, ***P < 0.001. See Table 1 for motif list. (E) Venn diagram of meiosis I and meiosis II phospho-proteins grouped by clustering. Bar graph of fraction unique phospho-proteins in each group. Data information: Statistics: Fisher’s exact test. **P < 0.01. Source data are available online for this figure.
Figure 4
Figure 4. Cdc5Polo kinase motif phosphorylation is decreased during the meiotic divisions in spo13Δ cells.
(A) Proportion of phospho-sites which significantly vary between wild type and spo13Δ at matched timepoints. See Dataset EV7 for list of phospho-sites. (B) IceLogos showing enrichment of specific residues surrounding the phospho-sites decreased in spo13Δ. Bar charts below show percent motif matches in the indicated groups of sites. Data information: Statistics: Fisher’s exact test. *P < 0.05. (C) IceLogo showing enrichment of specific residues surrounding the phospho-sites increased in spo13Δ. Bar chart below shows percent motif matches in the indicated groups of sites. Data information: Statistics: Fisher’s exact test. *P < 0.05. Source data are available online for this figure.
Figure 5
Figure 5. Cdc28Cdk1, Cdc5Polo, and Hrr25CK1 phosphorylation is disrupted in spo13Δ cells.
(A) Hierarchical clustering of the 305 phospho-sites which significantly vary between wild type and spo13Δ at matched timepoints. See Dataset EV8 for phospho-site identities in each cluster. (B) Median lineplots of cluster abundances from (A). (C) Motif logo of cluster 10 contains Cdc28Cdk1 consensus, [ST]*Px[KR], matches (top). Abundance of S*PxK site Spc110-S36 phosphorylation across the timecourse (bottom). (D) Motif logo of cluster 8 contains Cdc5Polo consensus, [DEN]x[ST]*, matches (top). Abundance of NxS* site Ecm11-S169 phosphorylation across the timecourse (bottom). (E) Motif logo of cluster 3 contains Hrr25CK1 consensus, [ST]xx[ST]* matches as well as acidic or phospho-acceptor residues at −2, +2, and +3 that are recognised by casein kinases (top). Abundance of SSxS* site Cdc3-S77 phosphorylation across the timecourse (bottom). (F) Motif logo of cluster 9 contains Hrr25CK1 consensus, [ST]xx[ST]* and Cdc5Polo consensus, [DEN]x[ST]* matches (top). Abundance of DNxS* site Hrr25-S330 phosphorylation across the timecourse (bottom). (G) Abundance of phospho-sites matching the Cdc28Cdk1 minimal [ST]*P (left) or strict [ST]*Px[KR] (right) consensus among sites detected in both replicates of wild-type and spo13Δ across the timecourse. (H) Abundance of phospho-sites matching the Cdc5Polo, [DEN]x[ST]*, consensus among sites detected in both replicates of wild-type and spo13Δ across the timecourse. (I) Abundance of phospho-sites matching the Hrr25CK1, [ST]xx[ST]*, consensus among sites detected in both replicates of wild-type and spo13Δ across the timecourse. Source data are available online for this figure.
Figure 6
Figure 6. Cyclin Clb1 interacts with Cdc5Polo and its phosphorylation depends on Spo13.
(A) Volcano plot comparing proteins that co-immunoprecipitate with Cdc5-V5 (“wild type”) vs no tag control. (B) Volcano plot comparing proteins co-immunoprecipitated with Cdc5-V5 in wild-type and spo13∆ strains. (C) Abundance of Clb1 protein co-immunoprecipitated with anti-V5 in no tag, Cdc5-V5 (“wild type”), and spo13∆ Cdc5-V5 strains. Values are log2 transformed and mean-centred by protein, calculated by subtracting the mean abundance of the given protein across all samples from the abundance in a given sample. Error bars represent the 95% confidence interval around the mean. (D) Volcano plot comparing phospho-sites co-immunoprecipitated with Cdc5-V5 in wild-type and spo13∆ strains. (E) Abundance of Clb1 phospho-sites co-immunoprecipitated with anti-V5 in no tag, Cdc5-V5 (“wild type”), and spo13∆ Cdc5-V5 strains. Values are log2 transformed and mean-centred by phospho-site, calculated by subtracting the mean abundance across all samples from the abundance in a given sample. Error bars represent the 95% confidence interval around the mean. Data information for (AE): Data from n = 3 biological replicates. Statistics: DEP R package function test_diff, which tests for differential expression by empirical Bayes moderation of a linear model on the predefined contrasts. Source data are available online for this figure.
Figure 7
Figure 7. At metaphase I, Cdc5Polo kinase phosphorylation is decreased in spo13∆ and spo13-m2 cells.
(A) Proportion of proteins and phospho-sites which significantly vary between wild-type and spo13∆ in metaphase I-arrested cells. See also Datasets EV10 and EV12. (B) Proportion of proteins and phospho-sites which significantly vary between wild-type and spo13-m2 in metaphase I-arrested cells. See also Datasets EV11 and EV13. (C) IceLogo of motifs enriched surrounding phospho-sites decreased in spo13Δ in metaphase I-arrested cells. Bar charts below show percent motif matches in the indicated groups of sites. Data information: Statistics: Fisher’s exact test. ***P < 0.001. (D) IceLogo of motifs enriched surrounding phospho-sites decreased in spo13-m2 in metaphase I-arrested cells. Bar charts below show percent motif matches in the indicated groups of sites. Data information: Statistics: Fisher’s exact test. ***P < 0.001, *P < 0.05. (E) IceLogo of motifs enriched surrounding [DEN]x[ST]* phospho-sites decreased in spo13Δ in metaphase I-arrested cells. Bar charts below show percent motif matches in the indicated groups of sites. Data information: Statistics: Fisher’s exact test. ***P < 0.001, **P < 0.01. (F) IceLogo of motifs enriched surrounding [DEN]x[ST]* phospho-sites decreased in spo13-m2 in metaphase I-arrested cells. Bar charts below show percent motif matches in the indicated groups of sites. Data information: Statistics: Fisher’s exact test. **P < 0.01. Source data are available online for this figure.
Figure 8
Figure 8. Spo13 promotes [DEN]x[ST]*F phosphorylation in metaphase I.
(A) Bar graph of selected GO terms enriched among proteins with phosphorylated [DEN]x[ST]* sites with significantly different abundance between wild type and spo13∆ in the metaphase I arrest dataset. Data information: Statistics: Cumulative hypergeometric test followed by correction for multiple testing (gprofiler2 R package gost function default settings). (B) Bar graph of selected GO terms enriched among proteins with phosphorylated [DEN]x[ST]*F sites in the metaphase I arrest dataset. Data information: Statistics: Cumulative hypergeometric test followed by correction for multiple testing (gprofiler2 R package gost function default settings). (C) Proportion of phosphoproteins with phosphorylated [DEN]x[ST]*F motifs detected in the wild-type timecourse, spo13∆ timecourse, and both wild type and spo13∆ in the metaphase I arrest experiment. (D) Percent [DEN]x[ST]* motif matches in the indicated groups of sites. Clusters refer to wild-type phospho-site clustering in Figs. 3 and EV2. Data information: Statistics: Fisher’s exact test. ***P < 0.001, **P < 0.01, *P < 0.05. (E) Percent [DEN]x[ST]*F motif matches in the indicated groups of sites. Clusters refer to wild-type phospho-site clustering in Figs. 3 and EV2. Data information: Statistics: Fisher’s exact test. ***P < 0.001. (F) Abundance of phospho-sites matching the indicated motifs among sites detected in both replicates of wild-type and spo13Δ across the timecourse. Source data are available online for this figure.
Figure EV1
Figure EV1. Protein dynamics at the metaphase-to-anaphase transition in meiosis I and II.
(A) Fold change in protein abundance of proteins that significantly change from metaphase I to anaphase I. (B) Fold change in protein abundance of proteins that significantly change from metaphase II to anaphase II. (C) GO term analysis of proteins from (A). Data information: Statistics: Cumulative hypergeometric test followed by correction for multiple testing (gprofiler2 R package gost function default settings). (D) GO term analysis of proteins from (B). Data information: Statistics: Cumulative hypergeometric test followed by correction for multiple testing (gprofiler2 R package gost function default settings). Source data are available online for this figure.
Figure EV2
Figure EV2. Enrichment of kinase consensus motifs for clusters of dynamic phosphorylation sites.
Median lineplots of all clusters from Fig. 3A and kinase motif enrichment analysis bar graphs. Asterisks represent p value from Fisher’s exact test **P < 0.01; *P < 0.05). Source data are available online for this figure.
Figure EV3
Figure EV3. Phosphorylation dynamics at the metaphase-to-anaphase transitions in meiosis I and II.
(A) Motifs matching phospho-sites that significantly decrease (left) or increase (right) at the metaphase I to anaphase I transition. (B) Motifs matching phospho-sites that significantly decrease (left) or increase (right) at the metaphase II to anaphase II transition. (C) Median change of motif-matching phospho-sites decreasing (left) or increasing (right) from metaphase I to anaphase I. Abundance scaled to 75 min (metaphase I). (D) Median change of motif-matching phospho-sites decreasing (left) or increasing (right) from metaphase II to anaphase II. Abundance scaled to 120 min (metaphase II). (E) Motif logo of phospho-sites that are increased after metaphase II from (B) (right), which do not match any of the selected motifs, from the “other” category n = 95. (F) Abundance of Hrr25CK1 protein rises in meiosis II. Source data are available online for this figure.
Figure EV4
Figure EV4. Strict Cdk consensus site phosphorylation is the best predictor of Cdc28Cdk1 kinase activity.
(A) Fisher tests comparing the frequency of matching the indicated motifs among all sites detected in the indicated samples. Data information: Statistics: Fisher’s exact test, *P < 0.05. (B) Analysing only phospho-sites detected in both cdc28-as and wild-type, pie charts of the proportion of no change, increased or decreased sites when comparing cdc28-as and wild type in either the meiosis I samples (left) or meiosis II samples (right). (C) Icelogo comparing phospho-sites decreased in cdc28-as vs wild type in meiosis I and sites that are not significantly changed. (D) Fisher tests comparing the enrichment of motifs in the indicated groups of phospho-sites (same groups as in pie chart in (B, left)). Data information: Statistics: Fisher’s exact test, **P < 0.01. (E) Icelogo comparing phospho-sites decreased in cdc28-as vs wild type in meiosis II and sites that are not significantly changed. (F) Fisher tests comparing the enrichment of motifs in the indicated groups of phospho-sites (same groups as in pie chart in (B, right)). Data information: Statistics: Fisher’s exact test, **P < 0.01, ***P < 0.001. Source data are available online for this figure.
Figure EV5
Figure EV5. Comparison of Cdc5Polo kinase motif phosphorylation between wild type and spo13∆.
(A) Proportion of [DEN]x[ST]* motif-matching phospho-sites with significantly different abundance in spo13∆ versus wild type in metaphase I-arrested cells. (B) Proportion of [DEN]x[ST]* motif-matching phospho-sites with significantly different abundance in spo13∆ versus wild type in the meiotic timecourse experiments. (C) GO terms enriched among proteins with significantly different phosphorylation in spo13Δ or spo13-m2 versus wild type. Data information: Statistics: Cumulative hypergeometric test followed by correction for multiple testing (gprofiler2 R package gost function default settings). (D) Abundance of phospho-sites matching the [DEN]x[ST]*[FG] motif among sites detected in both replicates of wild type and spo13Δ across the timecourse. Source data are available online for this figure.
Figure EV6
Figure EV6. [DEN]x[ST]* and [DEN]x[ST]*F motif phosphorylation depends on Cdc5Polo.
(A) Pie chart showing the proportion of increased, decreased and no change sites between cdc5-as and wild type in prometaphase. (B) IceLogo comparing amino acid frequency between sites that were decreased in cdc5-as compared to no change sites. (C) IceLogo comparing amino acid frequency between sites that were increased in cdc5-as compared to no change sites. (D) Fisher tests comparing the number of the indicated motif-matching sites between the groups of sites that were decreased in cdc5-as (purple) or no change (grey). Data information: Statistics: Fisher’s exact test, **P < 0.01, ***P < 0.001. Source data are available online for this figure.

Similar articles

Cited by

References

    1. Abbasi M, Julner A, Lim YT, Zhao T, Sobota RM, Menéndez-Benito V. Phosphosites of the yeast centrosome component Spc110 contribute to cell cycle progression and mitotic exit. Biol Open. 2022;11:bio059565. doi: 10.1242/bio.059565. - DOI - PMC - PubMed
    1. Almawi AW, Langlois-Lemay L, Boulton S, Rodríguez González J, Melacini G, D’Amours D, Guarné A. Distinct surfaces on Cdc5/PLK Polo-box domain orchestrate combinatorial substrate recognition during cell division. Sci Rep. 2020;10:3379. doi: 10.1038/s41598-020-60344-4. - DOI - PMC - PubMed
    1. Argüello-Miranda O, Zagoriy I, Mengoli V, Rojas J, Jonak K, Oz T, Graf P, Zachariae W. Casein kinase 1 coordinates cohesin cleavage, gametogenesis, and exit from M phase in meiosis II. Dev Cell. 2017;40:37–52. doi: 10.1016/j.devcel.2016.11.021. - DOI - PubMed
    1. Argunhan B, Leung W-K, Afshar N, Terentyev Y, Subramanian VV, Murayama Y, Hochwagen A, Iwasaki H, Tsubouchi T, Tsubouchi H. Fundamental cell cycle kinases collaborate to ensure timely destruction of the synaptonemal complex during meiosis. EMBO J. 2017;36:2488–2509. doi: 10.15252/embj.201695895. - DOI - PMC - PubMed
    1. Barton RE, Massari LF, Robertson D, Marston AL. Eco1-dependent cohesin acetylation anchors chromatin loops and cohesion to define functional meiotic chromosome domains. eLife. 2022;11:e74447. doi: 10.7554/eLife.74447. - DOI - PMC - PubMed

MeSH terms