. 2024 Apr;16(4):945-965.
doi: 10.1038/s44321-024-00037-x. Epub 2024 Feb 27.

Improved gene therapy for spinal muscular atrophy in mice using codon-optimized hSMN1 transgene and hSMN1 gene-derived promotor

Affiliations

Improved gene therapy for spinal muscular atrophy in mice using codon-optimized hSMN1 transgene and hSMN1 gene-derived promotor

Qing Xie et al. EMBO Mol Med. 2024 Apr.

Abstract

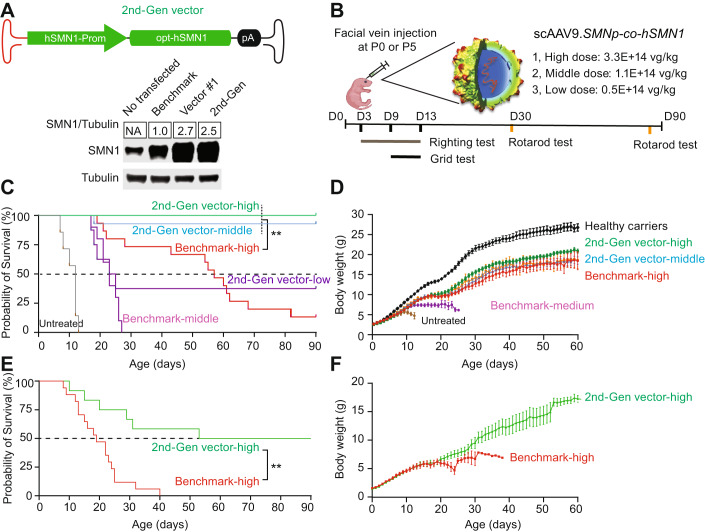
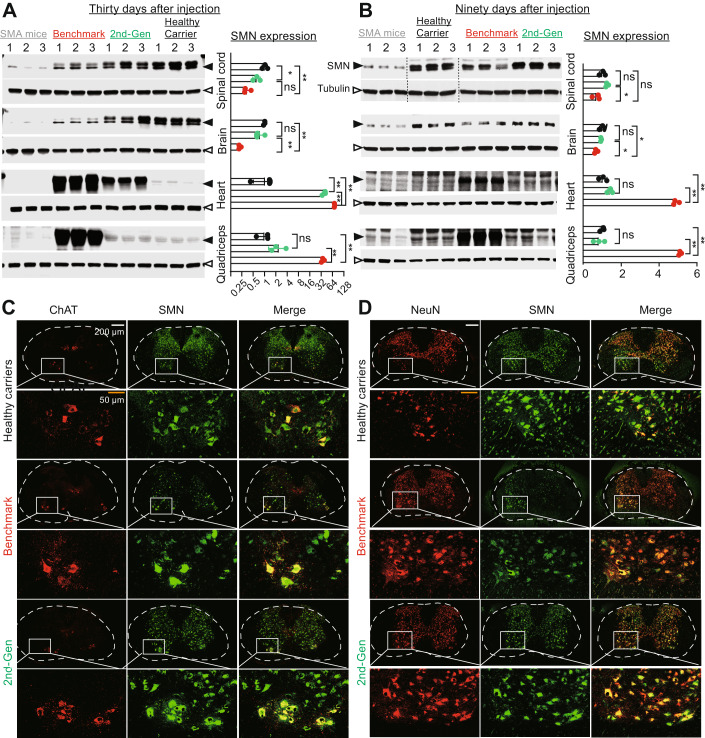
Physiological regulation of transgene expression is a major challenge in gene therapy. Onasemnogene abeparvovec (Zolgensma®) is an approved adeno-associated virus (AAV) vector gene therapy for infants with spinal muscular atrophy (SMA), however, adverse events have been observed in both animals and patients following treatment. The construct contains a native human survival motor neuron 1 (hSMN1) transgene driven by a strong, cytomegalovirus enhancer/chicken β-actin (CMVen/CB) promoter providing high, ubiquitous tissue expression of SMN. We developed a second-generation AAV9 gene therapy expressing a codon-optimized hSMN1 transgene driven by a promoter derived from the native hSMN1 gene. This vector restored SMN expression close to physiological levels in the central nervous system and major systemic organs of a severe SMA mouse model. In a head-to-head comparison between the second-generation vector and a benchmark vector, identical in design to onasemnogene abeparvovec, the 2nd-generation vector showed better safety and improved efficacy in SMA mouse model.

Keywords: AAV; Endogenous Promoter; Gene Therapy; SMA; SMN1.


Conflict of interest statement

QX, HM, GG, and JX are inventors of a patent application filed by the University of Massachusetts Chan Medical School on SMA gene therapy. GG is a scientific co-founder of Voyager Therapeutics, Adrenas Therapeutics, AAVAA Therapeutics, and Aspa Therapeutics and holds equity in these companies. PT, GG, and JX are inventors of patents related to AAV-based gene therapy, some of which were licensed to commercial entities. YM, LJ, FW, JY, and ZK are employees of CANbridge Pharmaceuticals. YM, LJ, GC, JY, and ZK hold equity and/or stock options in CANbridge Pharmaceuticals. The other authors declare no competing interests.

Figures

Figure 1
Figure 1. Supraphysiological levels of SMN contributes to hepatoxicity in mice.
(A) Schematic representation of the designed plasmids. A vector genome identical to onasemnogene abeparvovec was produced as the benchmark vector. A codon-optimized human SMN1 gene (co-hSMN1) was synthesized and incorporated into a scAAV genome with the cytomegalovirus enhancer/chicken β-actin promoter (CMVen/CB-hSMN1) in the presence or absence of a synthetic intron as Vector 1 and Vector 2, respectively. (B) A representative image of Western blot (n = 3) of Neuro2a cells transfected with the plasmids in (A). (C) Kaplan-Meier survival curves of homozygous SMNΔ7 mice injected at P0 via the facial vein at three different doses (3.3E + 14 vg/kg, n = 12; 1.1E + 14 vg/kg, n = 7; 0.5E + 14 vg/kg, n = 5). The benchmark vector was injected as a reference at a dose of 3.3E + 14 vg/kg (n = 13). Non-injected SMNΔ7 mice (n = 4) were used as controls. (D) Western blot analysis of SMN expression in mouse liver 8 days after injection of Vector 1 and the benchmark vector. (E) Photographs of neonatal mice 8 days after injection. (F) H&E staining was performed to show liver pathology. Bar = 200 μm. (G) Both SMA mice and healthy carriers were injected at P0 with 3.3E + 14 vg/kg of Vector 1 or the benchmark vector. Liver histopathology was analyzed by H&E staining for each animal 8 days post-injection. Animals with damaged livers were counted. (H) The rAAV-cohSMN1 vector construct with reduced SMN expression in liver contains three copies of a liver-specific, miR-122 binding site in the Vector 1 genome and is packaged in AAV9 (top). SMA mice were treated at P0 by facial vein injection at a dose of 3.3E + 14 vg/kg, and at eight days post-injection, mouse livers were harvested for Western blot analysis (bottom). (I) Animal weights were measured daily during the 8-day study period (n = 8 in the PBS group; n = 10 in Vector #3 group and n = 7 in Vector #1 group). Error bars, s.d. (J) Pathological evaluation of liver, by H&E staining was conducted to determine the number of animals with liver damage, and (K) vector genome copy number (n = 5 in each group). Student’s t-test. **P < 0.01. Error bars, s.d. Source data are available online for this figure.
Figure 2
Figure 2. The 2nd-generation vector greatly improved the lifespan and body weight gain of SMA mice.
(A) The 2nd-generation vector containing the endogenous hSMN1 promoter and codon-optimized human SMN1 coding sequence (co-hSMN1) (top). Western blot analysis of SMN expression in Neuro2a cells transfected with the benchmark vector, Vector 1, and the 2nd-generation vector plasmid (bottom), n = 3. (B) Schematic diagram of the animal study. SMA mice were injected via the facial vein with the 2nd-generation vector at three different doses (high, 3.3E + 14 vg/kg, n = 10; middle, 1.1E + 14 vg/kg, n = 13; low, 0.5E + 14 vg/kg, n = 8) or benchmark vector at 3.3E + 14 vg/kg (n = 15) or 1.1E + 14 vg/kg (n = 10) at P0. The surface righting tests were performed on Days 3–13, the grid tests were conducted on Days 9–11, and the rotarod tests were conducted on Days 30 and 90 for all surviving mice. (C, D) Survival and body weight gain of SMA mice injected at P0. Non-injected healthy carriers were used as controls (n = 12). (E, F) Survival and body weight gain of SMA mice injected at P5 (n = 17 in the benchmark group and n = 12 in the 2nd-generation vector group). Body weight data represent the mean ± S.E.M. Survival curve statistical analysis was performed using a Mantel-Cox test. **P < 0.01 Source data are available online for this figure.
Figure 3
Figure 3. The 2nd-generation vector improved motor function in SMA mice.
(A) Surface righting reflex of treated SMA animals (n = 7 in the benchmark group and n = 7 in 2nd-Gen vector group) with healthy littermates (n = 8) and non-injected SMA mice (n = 10) as controls. (B) Grid tests of treated SMA animals (n = 5 in the benchmark group and n = 7 in 2nd-Gen vector group) with healthy littermates (n = 8) and non-injected SMA mice (n = 6) as controls. (C) Rotarod testing of SMA mice treated at P0 (n = 16 in the healthy littermate group; n = 6 in both the benchmark and 2nd-Gen vector group on day 30. On day 90, n = 8 in the healthy littermate group; n = 3 in the benchmark group and n = 6 in the 2nd-Gen vector group) and P5 (n = 8 in the healthy littermate group and n = 3 in the benchmark group). Bars denote the median. (D) NMJ evaluation of mice at 12 days of age. TVA muscles were isolated from Day 12 postnatal mice for immunostaining. Neurofilament (NF) was stained using the Alex 488 fluorescence antibody (green), and neuromuscular junctions were visualized by the Alexa Fluor™ 594 conjugated α-bungarotoxin (BTX) reagent (red). The yellow arrows indicate accumulation of neurofilament, the yellow dashed circle indicates a collapsed NMJ structure, and the blue dashed circle indicates a partially innervated NMJ structure. (E) Quantification of the frequency of innervated, partially innervated, and denervated NMJs among the indicated groups. Five animals were included for each vector-treated group, and three animals were included for untreated SMA mice. Data represents the mean ± SD. (F) NMJ evaluation of mice at 2-3 months of age. One-way ANOVA. *P < 0.05; **P < 0.01; ns, not significant. Source data are available online for this figure.
Figure 4
Figure 4. The 2nd-generation vector improved cardiac and respiratory function without liver toxicity.
(A) Echocardiographic assessment of P0-treated SMA mice, using a dose of 3.3E14 vg/kg of the benchmark (n = 9) or 2nd-generation vector (n = 8), 30 days post-administration. Age-matched healthy carriers were used as controls (n = 5). (B) M-mode tracings of representative transthoracic echocardiograms of the left ventricle. The yellow arrowheads indicate premature ventricular contractions. (C) H&E staining of mouse hearts showing enlargement of the left ventricle in BMK-treated mice. (D) Serum aspartate aminotransferase (AST), and alanine aminotransferase (ALT) levels were measured on Day 30, as biomarkers of liver toxicity (n = 10 in both the benchmark and 2nd-generation vector groups; n = 11 in the healthy carrier group). (E) Western blot analysis of SMN protein in mouse liver on Days 3, 8, 12, 30, and 90 post-injections of either the benchmark or 2nd-generation vector. (F) Quantitative analysis of (E). Band intensities were averaged, expressed as a ratio to β-tubulin, and normalized to healthy carriers. Age-matched healthy carriers were used as a reference. Untreated SMA mice were harvested at two weeks of age as a control. n = 3 animals. Bars represent the mean and error bars represent SD. One-way ANOVA. **P < 0.01; ns, not significant. Source data are available online for this figure.
Figure 5
Figure 5. The 2nd-generation vector reduced disease manifestations in peripheral tissues.
(AC) The frequency of necrotic pinna, watery eyes, and diarrhea in the benchmark vector or 2nd-generation vector-treated SMA mice throughout the 90-day study period. (D) Photograph of P0-treated SMA mice that received the 2nd-generation vector at different doses and healthy carrier mice on Day 150. Fischer’s exact test, **P < 0.01; ns, not significant. Source data are available online for this figure.
Figure 6
Figure 6. The 2nd-generation vector was preferentially expressed in the CNS compared to peripheral tissues.
(A, B) SMN protein expression analysis. SMA neonates were injected with vectors via the facial vein with a dose of 3.3E + 14 vg/kg on P0. On (A) Day 30 and (B) Day 90, mouse brain, spinal cord, heart, and quadricep muscles were harvested for Western blot analysis. Age-matched healthy carriers were used as a reference. Untreated SMA mice were harvested at two weeks of age as a control. Quantitative analysis is on the right side. SMN expression shown as a ratio to β-tubulin and normalized to healthy carriers. (C) Immunostaining analysis in mouse lumbar spinal cord at 30 days. ChAT (red, a motor neuron marker), SMN (green), and merged (yellow). (D) Immunostaining of mouse lumbar spinal cord at 30 days. NeuN (red, a neuronal marker), SMN (green), and merged (yellow). Data represent the mean ± SD. One-way ANOVA, *P < 0.05; **P < 0.01; ns, not significant. Source data are available online for this figure.
Figure EV1
Figure EV1. Survival of SMA mice injected at P0 with Vector 2 at three different doses.
Non-injected SMA mice were used as a control.
Figure EV2
Figure EV2. Respiratory function assessment by plethysmography in SMA-treated mice and healthy carriers.
On Day 30, respiratory function was assessed by tidal volume, peak inspiratory flow, and respiratory rate. Bars represent the mean and error bars represent SD. One-way ANOVA, *P < 0.05; **P < 0.01; ns, not significant.
Figure EV3
Figure EV3. Heart H&E staining on Day 90 of SMA injected at P0 with the benchmark and 2nd-generation vectors.
Healthy littermates were used as a control.
Figure EV4
Figure EV4. Immunostaining of mouse lumbar spinal cord on Day 30.
(A) GFAP (red, an astrocyte marker), SMN (green), and merged (yellow). (B) Immunostaining of mouse lumbar spinal cord on Day 30. Iba1 (red, a microglial marker), SMN (green) and merged (yellow).

References

    1. Baranello G, Darras BT, Day JW, Deconinck N, Klein A, Masson R, Mercuri E, Rose K, El-Khairi M, Gerber M, et al. Risdiplam in type 1 spinal muscular atrophy. N Engl J Med. 2021;384:915–923. doi: 10.1056/NEJMoa2009965. - DOI - PubMed
    1. Bernabo P, Tebaldi T, Groen EJN, Lane FM, Perenthaler E, Mattedi F, Newbery HJ, Zhou H, Zuccotti P, Potrich V, et al. In vivo translatome profiling in spinal muscular atrophy reveals a role for SMN protein in ribosome biology. Cell Rep. 2017;21:953–965. doi: 10.1016/j.celrep.2017.10.010. - DOI - PMC - PubMed
    1. Besse A, Astord S, Marais T, Roda M, Giroux B, Lejeune FX, Relaix F, Smeriglio P, Barkats M, Biferi MG. AAV9-mediated expression of SMN restricted to neurons does not rescue the spinal muscular atrophy phenotype in mice. Mol Ther. 2020;28:1887–1901. doi: 10.1016/j.ymthe.2020.05.011. - DOI - PMC - PubMed
    1. Bischof M, Lorenzi M, Lee J, Druyts E, Balijepalli C, Dabbous O. Matching-adjusted indirect treatment comparison of onasemnogene abeparvovec and nusinersen for the treatment of symptomatic patients with spinal muscular atrophy type 1. Curr Med Res Opin. 2021;37:1719–1730. doi: 10.1080/03007995.2021.1947216. - DOI - PubMed
    1. Buss N, Lanigan L, Zeller J, Cissell D, Metea M, Adams E, Higgins M, Kim KH, Budzynski E, Yang L, et al. Characterization of AAV-mediated dorsal root ganglionopathy. Mol Ther Methods Clin Dev. 2022;24:342–354. doi: 10.1016/j.omtm.2022.01.013. - DOI - PMC - PubMed