. 2024 Feb 27;8(1):53.
doi: 10.1038/s41698-024-00550-9.

Zebrafish tumour xenograft models: a prognostic approach to epithelial ovarian cancer

Affiliations

Zebrafish tumour xenograft models: a prognostic approach to epithelial ovarian cancer

Gabriel Lindahl et al. NPJ Precis Oncol. .

Abstract

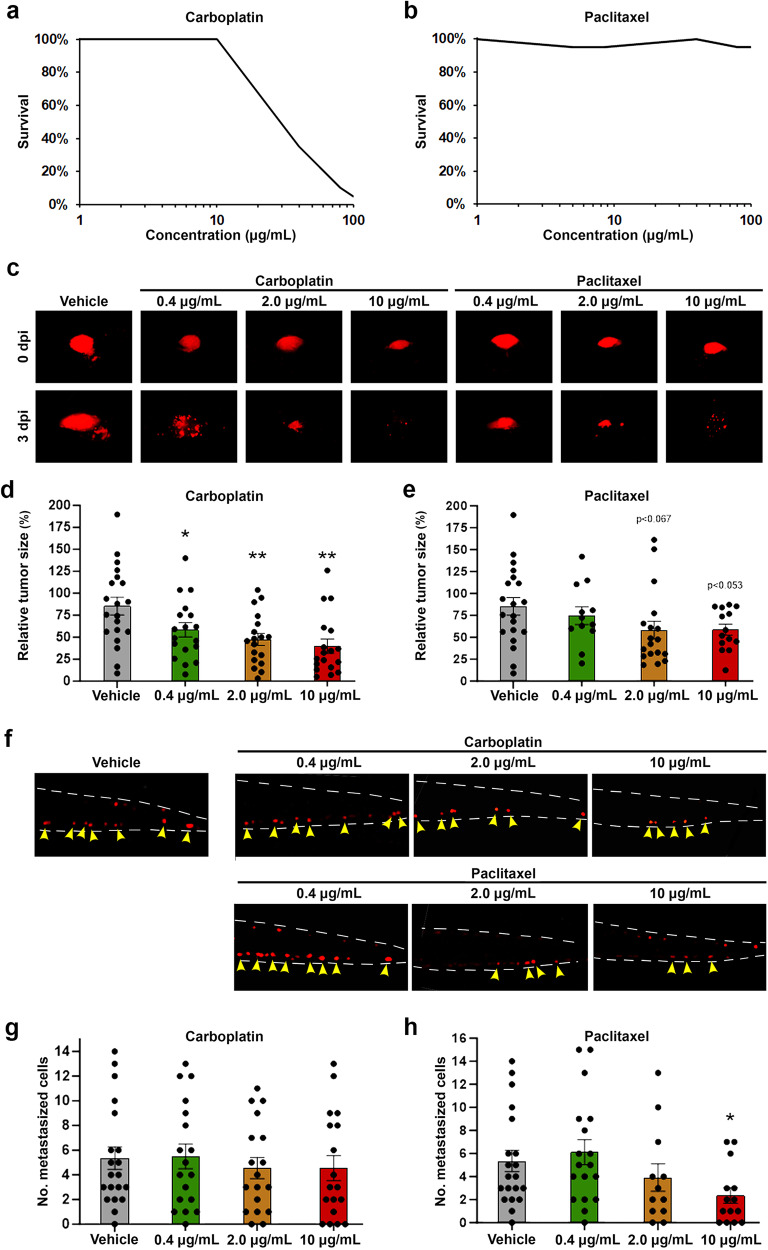
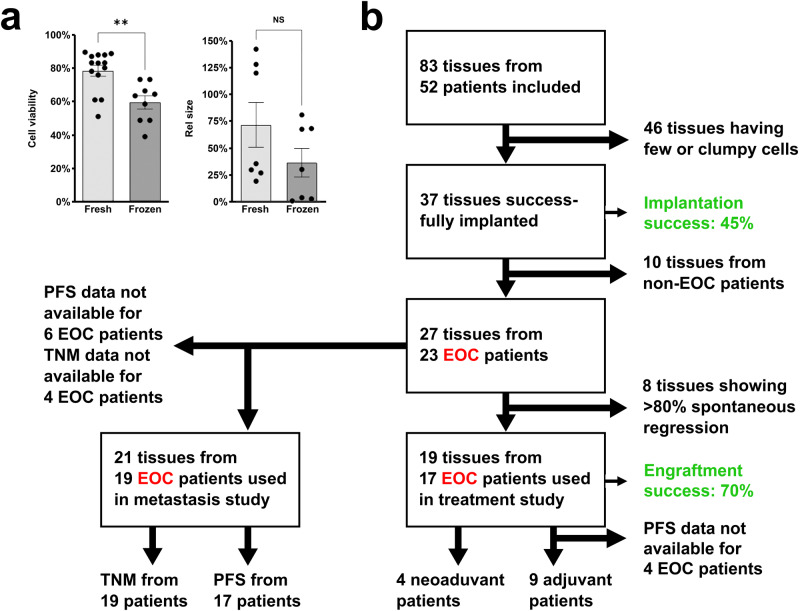
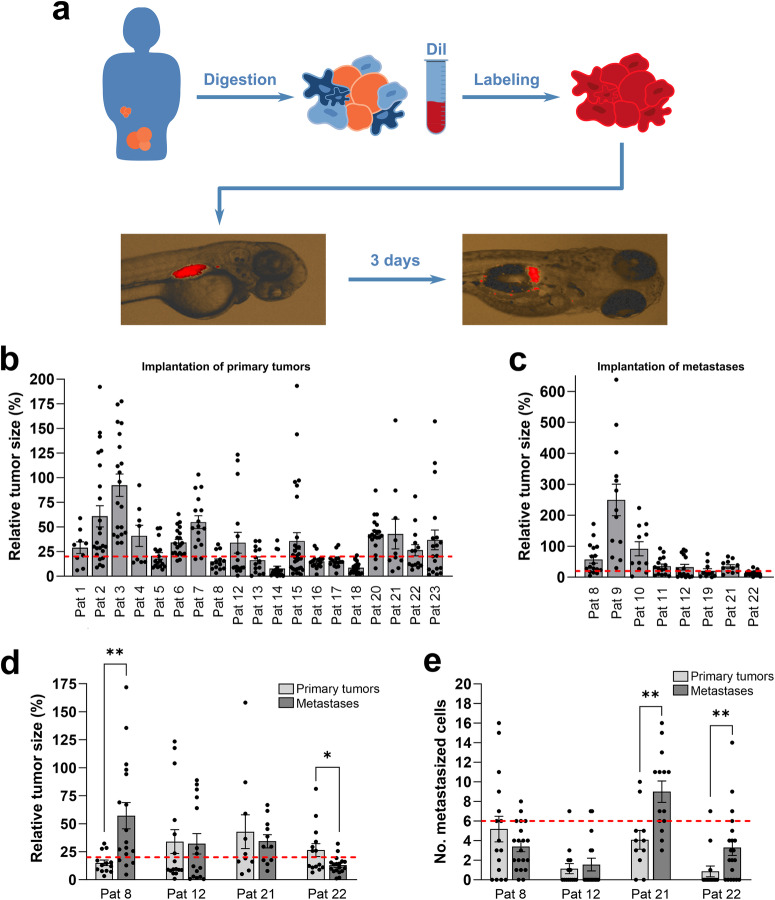
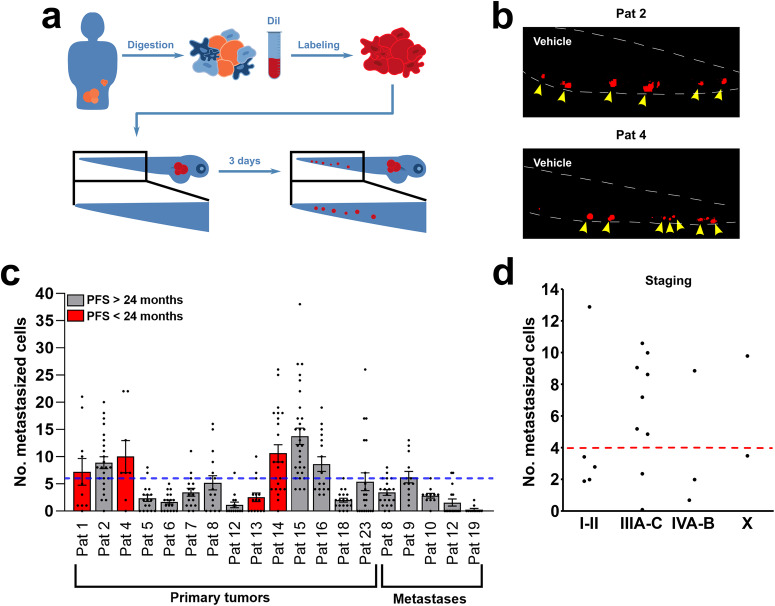
Epithelial ovarian cancer (EOC) is the gynaecological malignancy with highest mortality. Although adjuvant treatment with carboplatin and paclitaxel leads to an objective response in ~80% of these patients, a majority will relapse within two years. Better methods for assessing long-term treatment outcomes are needed. To address this, we established safe and efficacious doses of carboplatin and paclitaxel using IGROV-1 zebrafish-CDX models. Then fluorescently-labelled cell suspensions from 83 tumour biopsies collected at exploratory laparotomy of women with suspected EOC were generated and 37 (45%) were successfully implanted in zebrafish larvae. Among these 19 of 27 pathology-confirmed EOC samples (70%) engrafted. These zebrafish patient-derived tumour xenograft (ZTX) models were treated with carboplatin or paclitaxel and tumour growth/regression and metastatic dissemination were recorded. In a subgroup of nine patients, four ZTX models regressed during carboplatin treatment. All four corresponding patients had >24 months PFS. Furthermore, both ZTX models established from two patients having <24 months PFS failed to regress during carboplatin treatment. Seven of eight models seeding <6 metastatic cells were established from patients having >24 months PFS. In eleven of fourteen patients, FIGO stage I + II or III tumours gave rise to ZTX models seeding <4 or >4 metastatic cells, respectively. In conclusion, ZTX models predicted patients having >24 or <24 months PFS, based on response/no response to carboplatin. Furthermore, high metastatic dissemination in ZTX models correlated to shorter PFS and more advanced disease at diagnosis. These preliminary results suggest that ZTX models could become a useful prognostic tool in EOC treatment planning.


Conflict of interest statement

S.F., M.V., R.A., Z.A., G.V.R., A.E., A.F., and L.J. were or are employees or shareholders in BioReperia AB, a company that is developing ZTX models for diagnosis and prognosis of cancer patients. The other authors declare no conflicts of interest related to this work.

Figures

Fig. 1
Fig. 1. Carboplatin and paclitaxel demonstrate concentration-dependent safety and anti-cancer efficacy in IGROV-1 EOC models.
a, b Curves showing the proportion of embryos surviving treatment with the indicated concentrations of carboplatin (a) or paclitaxel (b) for three days at 36 °C between 2- and 5-days post fertilization. N = 20 embryos per group in three technical replicates. c Representative fluorescent micrographs showing the primary implantation site after fluorescently-labelled IGROV-1 tumour cells (red) were implanted into 2-day-old zebrafish larvae, treated with 0.4–10 µM carboplatin or paclitaxel at 36 °C and imaged at 0 days post implantation (dpi) or 3 dpi. d, e Quantification of relative tumour sizes of IGROV-1 tumour-bearing larvae treated with carboplatin (d) or paclitaxel (e) from the experiment shown in (c). n = 12–20 embryos per group in three technical replicates. *p < 0.05, **p < 0.01. f Representative fluorescent micrographs showing fluorescently-labelled IGROV-1 tumour cells (red) in the metastatic site in the caudal hematopoietic plexus of 5-day-old zebrafish larvae treated with 0.4–10 µM carboplatin or paclitaxel at 36 °C and imaged at 3 dpi. g, h Quantification of the number of metastasized IGROV-1 cells after treatment with carboplatin (g) or paclitaxel (h) from the experiment shown in (f). n = 12–20 embryos per group in three technical replicates. *p < 0.05.
Fig. 2
Fig. 2. Inclusion and exclusion criteria and handling of patient samples in the clinical study.
a Quantifications of changes in cell viability and tumour size (rel. size) of cells and xenografts, respectively, generated from either fresh or cryopreserved (frozen) tissue samples. n is shown in each graph. NS: non-significant, **p < 0.01. b Flow diagram depicting the number of patients included/excluded for the different sub-studies. All initially included patients had suspected EOC based on radiological images. EOC: Epithelial ovarian cancer; PFS: Progression-free survival; TNM: Tumour-Node-Metastasis.
Fig. 3
Fig. 3. Implantation of EOC ZTX models in zebrafish larvae.
a Illustration of digestion, staining, implantation, and visualization of EOC tumour samples from primary tumour and metastases transplanted to zebrafish larvae. b Quantification of changes in tumour size (rel. size) between day zero and day three for 19 samples from the primary tumour in 19 patients. Cut-off for included models in further studies was those that decreased less than 80% in size (red dotted line). n is shown as individual dots in the graph. c Quantification of changes in tumour size (rel. size) between day zero and day three for 8 samples from metastatic lesions in 8 patients. Cut-off for including models in further studies were a decrease of less than 80% in size (red dotted line). n is shown as individual dots in the graphs. The experiment was done once. d Comparison of changes in tumour size (rel. size) between samples from primary tumour and samples from metastases transplanted to the zebrafish larvae. The cut-off of less than 80% regression of the tumour size is shown with a red dotted line. *p < 0.05, **p < 0.01. e Comparison of number of cells disseminated to the caudal venous plexus of the zebrafish larvae between samples from primary tumours and samples from metastatic lesions. Red dotted line indicates a cut-off for more or less advanced disease (above or below respectively, see Fig. 4). **p < 0.01. Pat: patient.
Fig. 4
Fig. 4. Dissemination of tumour cells as a tool for prediction of outcome.
a Illustration of digestion, staining, and imaging of disseminated cells to caudal venous plexus (the area in the black box) of the zebrafish larvae. b Representative images of dissemination in the zebrafish larvae with tumour material from primary tumours of Patient 2 and Patient 4. Yellow arrowheads point to metastasized tumour cells (red). c Quantification of number of disseminated cells in the zebrafish larvae from primary tumours (n = 14, experiment done once) and metastatic lesions (n = 5, experiment done once) compared to patients who had a progression-free survival (PFS) of less than 24 months (red bars) with a cut-off value of 6 (blue dotted line). d Quantification of number of disseminated cells in the zebrafish larvae from primary tumours compared to staging with a cut-off value of 4 (red dotted line). n = 5, n = 9, n = 3, n = 2 for Stage I–II, Stage III A–C, Stage IV A–B, and Stage X (an initially unknown stage that was later confirmed to be Stage IV), respectively. All experiments were done once. Pat: patient.
Fig. 5
Fig. 5. Treatment outcome in ZTX models is associated with PFS in the corresponding patients.
a Illustration of tumour samples being labelled and injected into the zebrafish larvae. The patients had either been treated with neoadjuvant cytostatic therapy (NACT) before surgery or treated with primary surgery. b Representative images of change in tumour size between day zero and three compared between vehicle group and either carboplatin (10 μg/mL) or paclitaxel (20 μg/mL) in Patient 2. c, d Comparison of change in tumour size in the zebrafish larvae between vehicle group and groups treated with either carboplatin (10 μg/mL) (c) or paclitaxel (20 μg/mL) in samples from either primary tumours or from metastatic lesions in patients treated with primary debulking surgery (PDS). Patients with a progression-free survival (PFS) of less than 24 months are indicated with a red bar. Control tumour size (100%) is indicated by a blue dashed line. All experiments were done once *p < 0.05, **p < 0.01, ***p < 0.001.
Fig. 6
Fig. 6. Carboplatin and paclitaxel do not inhibit metastasis in patient-derived ZTX models of EOC.
a, b Comparison of changes in average number of disseminated cells (rel. number of metastasized cells) between vehicle and treatment with either carboplatin (10 μg/mL) (a) and paclitaxel (20 μg/mL) (b) in samples from either primary tumours or from metastatic lesions. Patients with a progression-free survival (PFS) of less than 24 months are indicated with a red bar. Dissemination in non-treated controls (100%) is indicated by the blue dashed line. All experiments were done once. *p < 0.05, **p < 0.01, ***p < 0.001. Pat: patient.

References

    1. Reid BM, Permuth JB, Sellers TA. Epidemiology of ovarian cancer: a review. Cancer Biol. Med. 2017;14:9–32. - PMC - PubMed
    1. Lheureux S, Gourley C, Vergote I, Oza AM. Epithelial ovarian cancer. Lancet. 2019;393:1240–1253. - PubMed
    1. McGuire WP, Markman M. Primary ovarian cancer chemotherapy: current standards of care. Br. J. Cancer. 2003;89:S3–8. - PMC - PubMed
    1. Haunschild CE, Tewari KS. The current landscape of molecular profiling in the treatment of epithelial ovarian cancer. Gynecol. Oncol. 2021;160:333–345. - PubMed
    1. Schwaederle M, et al. Impact of precision medicine in diverse cancers: a meta-analysis of phase II clinical trials. J. Clin. Oncol. 2015;33:3817–3825. - PMC - PubMed