

Combined analysis of mRNA and miRNA transcriptomes reveals the regulatory mechanism of Xanthomonas arboricola pv pruni resistance in Prunus persica
- PMID: 38413907
- PMCID: PMC10898114
- DOI: 10.1186/s12864-024-10113-8
Combined analysis of mRNA and miRNA transcriptomes reveals the regulatory mechanism of Xanthomonas arboricola pv pruni resistance in Prunus persica
Abstract
Background: Peach bacterial shot hole, caused by Xanthomonas arboricola pv pruni (Xap), is a global bacterial disease that poses a threat to the yield and quality of cultivated peach trees (Prunus persica).
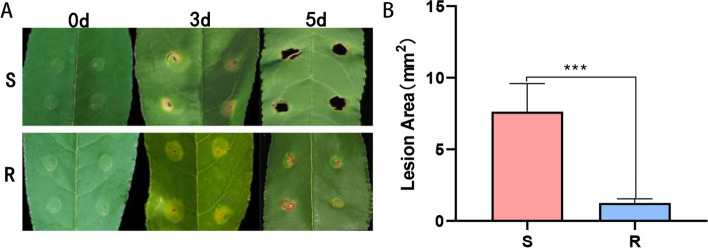
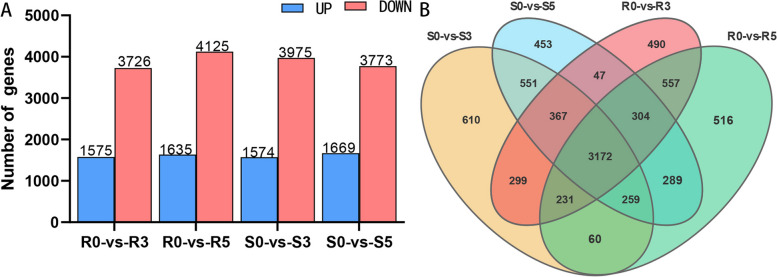
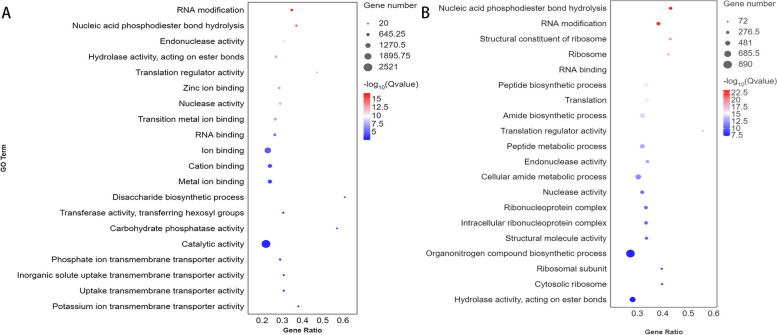
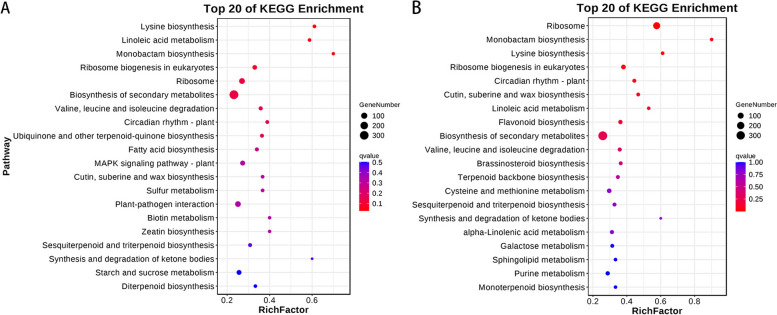
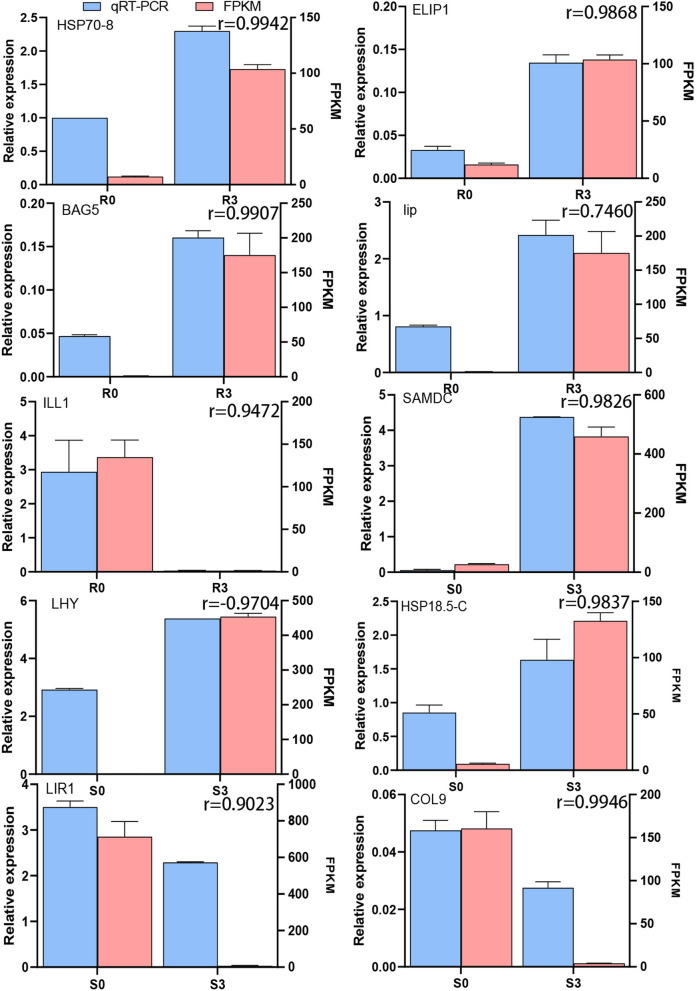
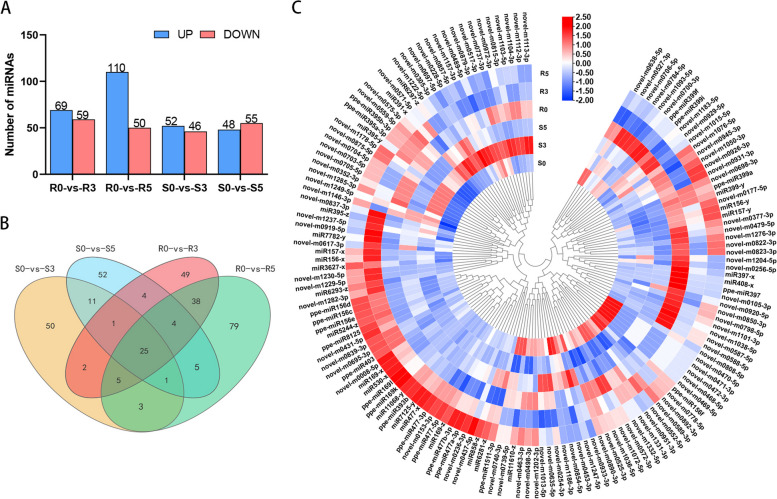
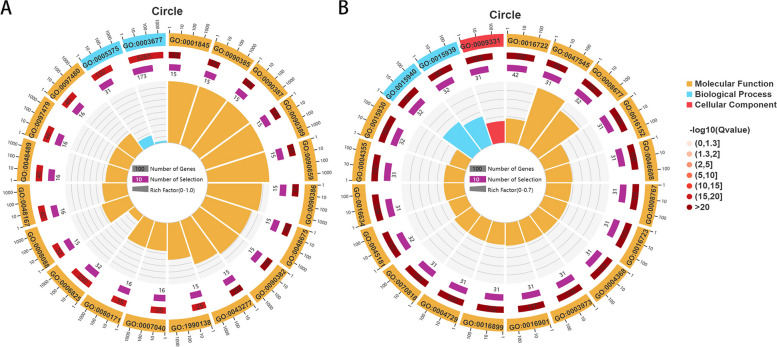
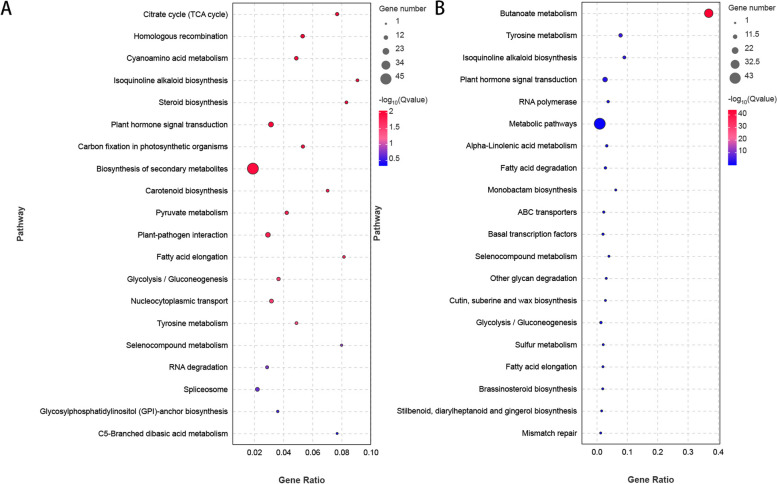
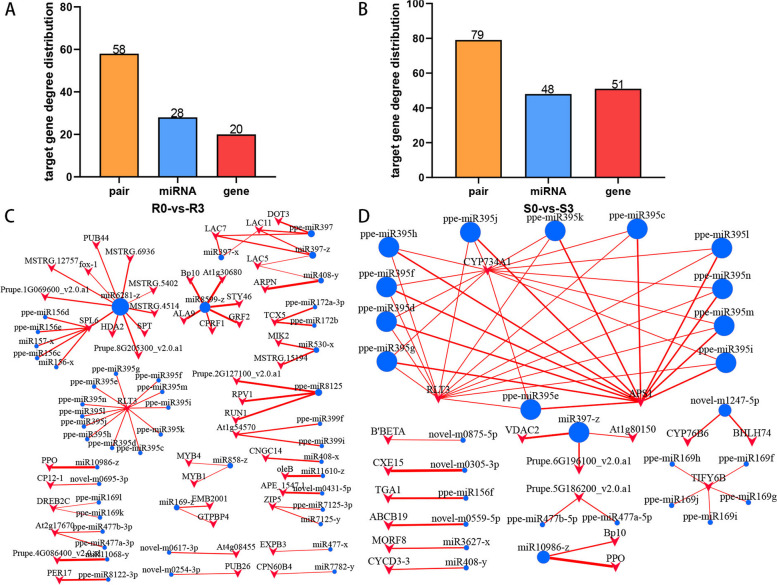
Results: This study compared the mRNA and miRNA profiles of two peach varieties, 'Yanbao' (resistant) and 'Yingzui' (susceptible), after inoculation with Xap to identify miRNAs and target genes associated with peach tree resistance. mRNA sequencing results revealed that in the S0-vs-S3 comparison group, 1574 genes were upregulated and 3975 genes were downregulated. In the R0-vs-R3 comparison group, 1575 genes were upregulated and 3726 genes were downregulated. Through miRNA sequencing, a total of 112 known miRNAs belonging to 70 miRNA families and 111 new miRNAs were identified. Notably, some miRNAs were exclusively expressed in either resistant or susceptible varieties. Additionally, 59 miRNAs were downregulated and 69 miRNAs were upregulated in the R0-vs-R3 comparison group, while 46 miRNAs were downregulated and 52 miRNAs were upregulated in the S0-vs-S3 comparison group. Joint analysis of mRNA and miRNA identified 79 relationship pairs in the S0-vs-S3 comparison group, consisting of 48 miRNAs and 51 target genes. In the R0-vs-R3 comparison group, there were 58 relationship pairs, comprising 28 miRNAs and 20 target genes. Several target genes related to resistance, such as SPL6, TIFY6B, and Prupe.4G041800_v2.0.a1 (PPO), were identified through literature reports and GO/KEGG enrichment analysis.
Conclusion: In conclusion, this study discovered several candidate genes involved in peach tree resistance by analyzing differential expression of mRNA and miRNA. These findings provide valuable insights into the mechanisms underlying resistance to Xap in peach trees.
Keywords: Xanthomonas arboricola pv. pruni; Peach; mRNA; miRNA.
© 2024. The Author(s).
Conflict of interest statement
The authors declare no competing interests.
Figures
Similar articles
-
Transcriptome reprogramming of resistant and susceptible peach genotypes during Xanthomonas arboricola pv. pruni early leaf infection.PLoS One. 2018 Apr 26;13(4):e0196590. doi: 10.1371/journal.pone.0196590. eCollection 2018. PLoS One. 2018. PMID: 29698473 Free PMC article.
-
Prunus persica plant endogenous peptides PpPep1 and PpPep2 cause PTI-like transcriptome reprogramming in peach and enhance resistance to Xanthomonas arboricola pv. pruni.BMC Genomics. 2021 May 18;22(1):360. doi: 10.1186/s12864-021-07571-9. BMC Genomics. 2021. PMID: 34006221 Free PMC article.
-
Copper Tolerance in Xanthomonas arboricola pv. pruni in South Carolina Peach Orchards.Plant Dis. 2022 Jun;106(6):1626-1631. doi: 10.1094/PDIS-05-21-1114-RE. Epub 2022 May 5. Plant Dis. 2022. PMID: 34931900
-
Overwintering Capability of Xanthomonas arboricola pv. pruni Strains with Different Bactericidal Sensitivities on Peach Trees.Phytopathology. 2025 May;115(5):444-453. doi: 10.1094/PHYTO-09-24-0298-R. Epub 2025 May 24. Phytopathology. 2025. PMID: 39903859
-
Ppe.XapF: High throughput KASP assays to identify fruit response to Xanthomonas arboricola pv. pruni (Xap) in peach.PLoS One. 2022 Feb 25;17(2):e0264543. doi: 10.1371/journal.pone.0264543. eCollection 2022. PLoS One. 2022. PMID: 35213640 Free PMC article.
Cited by
-
Genome-Wide Characterization of the BTB Gene Family in Poplar and Expression Analysis in Response to Hormones and Biotic/Abiotic Stresses.Int J Mol Sci. 2024 Aug 21;25(16):9048. doi: 10.3390/ijms25169048. Int J Mol Sci. 2024. PMID: 39201733 Free PMC article.
References
-
- Lamichhane JR. Xanthomonas arboricola diseases of stone fruit, almond, and walnut trees: progress toward understanding and management. Plant Dis. 2014;98(12):1600–1610. - PubMed
MeSH terms
Substances
Supplementary concepts
Grants and funding
LinkOut - more resources
Full Text Sources
