. 2024 Feb 27;22(1):208.
doi: 10.1186/s12967-024-05013-0.

Targeting of mitochondrial fission through natural flavanones elicits anti-myeloma activity

Affiliations

Targeting of mitochondrial fission through natural flavanones elicits anti-myeloma activity

Roberta Torcasio et al. J Transl Med. .

Abstract

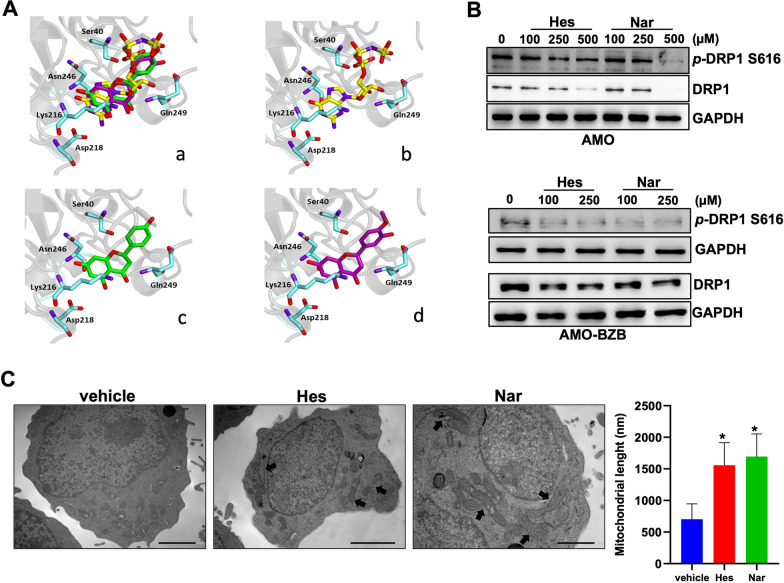
Background: Mitochondrial alterations, often dependent on unbalanced mitochondrial dynamics, feature in the pathobiology of human cancers, including multiple myeloma (MM). Flavanones are natural flavonoids endowed with mitochondrial targeting activities. Herein, we investigated the capability of Hesperetin (Hes) and Naringenin (Nar), two aglycones of Hesperidin and Naringin flavanone glycosides, to selectively target Drp1, a pivotal regulator of mitochondrial dynamics, prompting anti-MM activity.

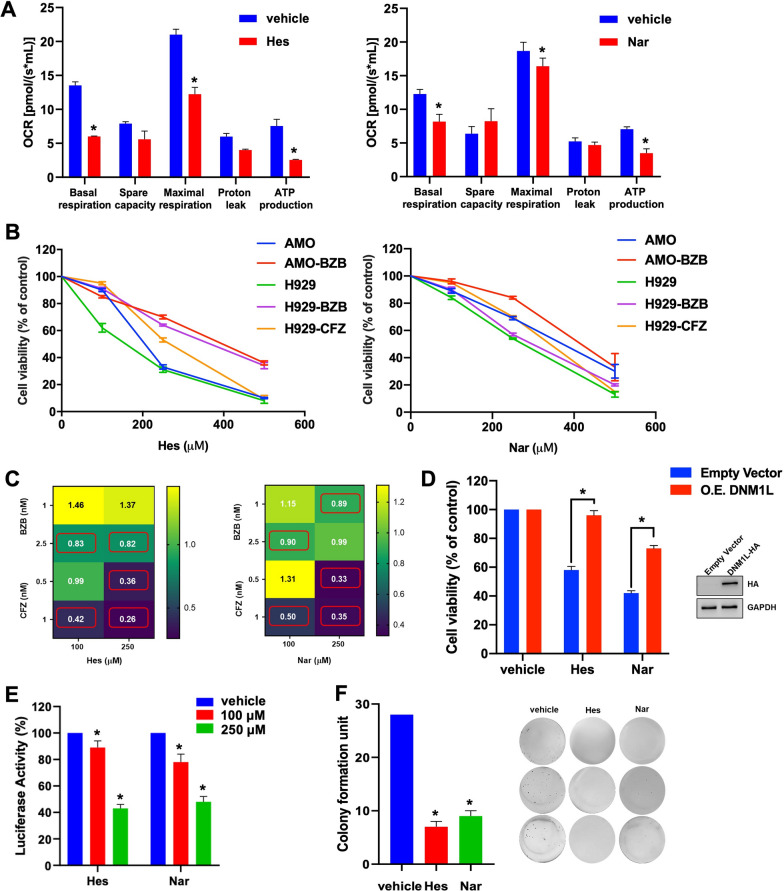
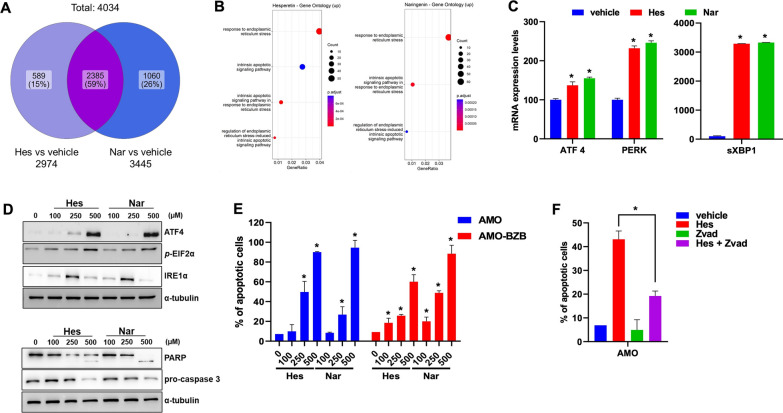
Methods: Molecular docking analyses were performed on the crystallographic structure of Dynamin-1-like protein (Drp1), using Hes and Nar molecular structures. Cell viability and apoptosis were assessed in MM cell lines, or in co-culture systems with primary bone marrow stromal cells, using Cell Titer Glo and Annexin V-7AAD staining, respectively; clonogenicity was determined using methylcellulose colony assays. Transcriptomic analyses were carried out using the Ion AmpliSeq™ platform; mRNA and protein expression levels were determined by quantitative RT-PCR and western blotting, respectively. Mitochondrial architecture was assessed by transmission electron microscopy. Real time measurement of oxygen consumption was performed by high resolution respirometry in living cells. In vivo anti-tumor activity was evaluated in NOD-SCID mice subcutaneously engrafted with MM cells.

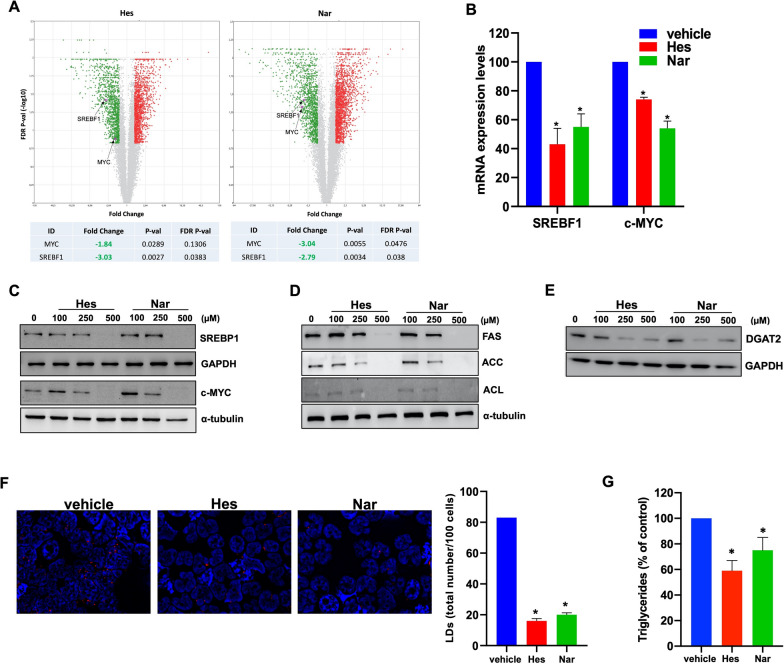
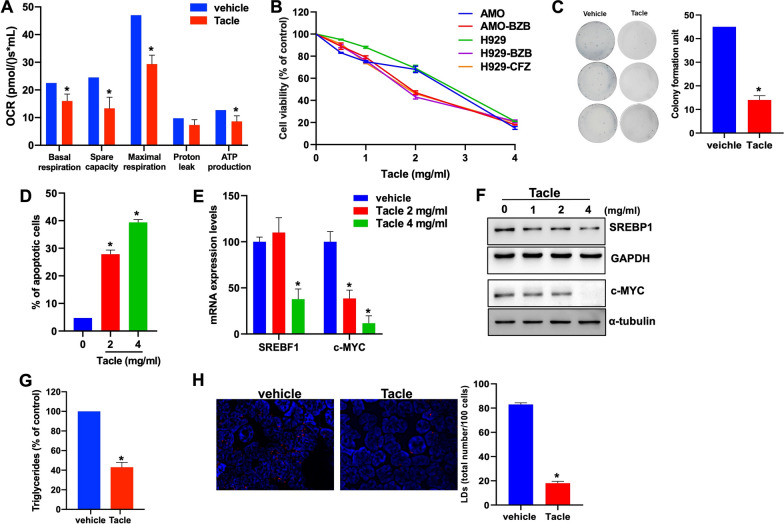
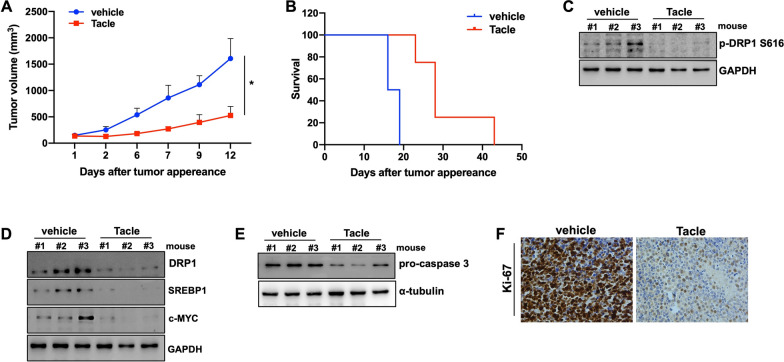
Results: Hes and Nar were found to accommodate within the GTPase binding site of Drp1, and to inhibit Drp1 expression and activity, leading to hyperfused mitochondria with reduced OXPHOS. In vitro, Hes and Nar reduced MM clonogenicity and viability, even in the presence of patient-derived bone marrow stromal cells, triggering ER stress and apoptosis. Interestingly, Hes and Nar rewired MM cell metabolism through the down-regulation of master transcriptional activators (SREBF-1, c-MYC) of lipogenesis genes. An extract of Tacle, a Citrus variety rich in Hesperidin and Naringin, was capable to recapitulate the phenotypic and molecular perturbations of each flavanone, triggering anti-MM activity in vivo.

Conclusion: Hes and Nar inhibit proliferation, rewire the metabolism and induce apoptosis of MM cells via antagonism of the mitochondrial fission driver Drp1. These results provide a framework for the development of natural anti-MM therapeutics targeting aberrant mitochondrial dependencies.

Keywords: Flavanones; Hesperitin; Mitochondrial dynamics; Multiple myeloma; Naringenin.


Conflict of interest statement

The authors declare that they have no competing interests.

Figures

Fig. 1
Fig. 1
Hes and Nar selectively inhibit Drp1. A Ligand-binding pocket of the active site of Drp1. Protein backbone is represented in background as a ribbon, and key protein residues are in blue. (a) Superimposed binding modes of the crystallographic ligand GNP (yellow); Nar (green) and Hes (magenta). The ligands are also shown separately: (b) crystallographic ligand GNP (yellow), (c) NAR and (d) HES. B WB analysis of Drp1 and S616 p-DRP1 was performed in AMO and AMO-BZB cells, 48 h after treatment with increasing doses of Hes, Nar or DMSO as vehicle. GAPDH was used as loading control. C TEM analysis (12000x) of mitochondrial structure and morphology in AMO cell line, 24 h after exposure to 100 µM of Hes or Nar. Representative images are shown; arrows indicate elongated mitochondria
Fig. 2
Fig. 2
Hes and Nar affect the viability of MM cell lines. A Real time Oxygen Consumption Rate (OCR) measurement in closed chambers performed on H929 cell line, 48 h after Hes (250 µM—left panel) or Nar (250 µM—right panel) treatment. Histogram bars report multiple key parameters, including basal respiration, spare capacity, maximal respiration, leak state and ATP production, calculated following consecutive injections of 2 µM Oligomycin, 0.5 µM FCCP and 2 µM Antimycin A. *p < 0.05. B Cell viability was assessed by CTG assay, 48 h after treatment with increasing doses of Hes (left panel) or Nar (right panel), as compared to vehicle (DMSO). Viable cells are reported as percentage of DMSO-treated cells. *p < 0.05. C Heat-map showing combination indexes (CI), determined by Calcusyn software, in AMO cells, 48 h after combined treatment of Hes (100–250 µM; left panel) or Nar (100–250 µM; right panel), with BZB (1–2.5 nM) or CFZ (0.5–1 nM). D Cell viability assessed by CTG assay in AMO cells stably overexpressing DNM1L gene, 72 h after 100 µM Hes or 100 µM Nar exposure. Immunoblot shows protein levels of HA-tagged Drp1 after transduction; GAPDH was used as loading control. *p < 0.05. E Cell viability assessed by Luciferase Glo assay in luciferase-expressing AMO cells, co-cultured in adhesion to BMSCs and exposed to Hes and Nar for 48 h. Cell viability was expressed as percentage of luciferase activity with respect to DMSO-treated cells. Data represent the average ± SD of three independent experiments. *p < 0.05. F Colony formation assay performed on AMO cells exposed to 250 µM Hes or 250 µM Nar for 10 days; DMSO was used as vehicle. Histogram bars represent the mean ± SD of three independent experiments. Representative images of colonies at day 10 are reported
Fig. 3
Fig. 3
Hes and Nar activate ER-stress and apoptosis. A Venn diagram reporting the differentially expressed genes induced by the two treatments and their comparison. B The plot shows the Gene Ontology (GO) enrichment of the upregulated genes after Hes and Nar treatment. The size of the dot indicates the number of upregulated genes enriched in each pathway, while the color of the dot indicates the p-adjusted value. C q-RT-PCR analysis of ATF4, PERK and sXBP1 mRNAs, in AMO cells, 24 h after treatment with 250 µM of either Hes or Nar. Histogram bars represent the average ± SD of mRNA expression levels after normalization with GAPDH and ΔΔCt calculations. D WB analysis of ATF4, IRE1α, p-EIF2α, PARP and Caspase 3 (right panel) proteins in AMO cells, 48 h after Hes or Nar treatment; normalization was performed using GAPDH or α-tubulin as loading controls. E FACS analysis of Annexin V-positive AMO and AMO-BZB cells, 48 h after Hes or Nar exposure. Data are representative of at least three independent biological replicates (n = 3). Histogram bars reported the percentage of total apoptotic cells. *p < 0.05. F FACS analysis of Annexin V-positive cells, 48 h after treatment with Hes (250 µM) alone or in combination with Z-VAD (20 µM). Data are representative of at least three independent biological replicates (n = 3). Histogram bars report the percentage of apoptotic MM cells. *p < 0.05
Fig. 4
Fig. 4
Hes and Nar target the lipogenesis pathway. A Volcano plot representation of differentially expressed genes after Hes (left panel) and Nar (right panel) treatment. The x-axis indicates the expression fold change (FC) and the y-axis indicates the false discovery rate (FDR) (− log10) for each gene versus untreated MM cells. FC threshold |1,5|; FDR ≤ 0.15. Upregulated transcripts (red) and downregulated (green) are shown. Selected representative genes are indicated with black arrows. B q-RT-PCR analysis of SREBF1 and c-MYC mRNA expression levels in AMO cells, 48 h after 250 µM Hes or Nar exposure. Histogram bars represent the average ± SD of mRNA expression levels after normalization with GAPDH and calculation using ΔΔCt method. *p < 0.05. WB analysis of C SREBP1, c-MYC D FAS, ACC, ACL and E DGAT2 protein levels, in AMO cells, 48 h after treatment with Hes or Nar. GAPDH or α-tubulin were used as loading control. F Fluorescence microscopy analysis of lipid droplets labeled with LipidTOX Red probe, 24 h after exposure to 250 µM of Hes or Nar. Representative images (100 × magnification) are reported. Histogram bars report the number of lipid droplets ± SD in at least 100 cells from three different fields. *p < 0.05. G Triglycerides measurement using Triglycerides Glo assay in AMO cells after 250 µM Hes or 250 µM Nar treatment. Luminescence was evaluated at 48 h. *p < 0.05
Fig. 5
Fig. 5
Tacle extract recapitulates Hes and Nar effects in vitro. A Real time OCR measurement in closed chambers performed in H929 cells, 48 h after 2 mg/mL Tacle treatment. Histogram bars report multiple key parameters, including basal respiration, spare capacity, maximal respiration, leak state and ATP production, calculated after consecutive injections of Oligomycin (2 µM), FCCP (0.5 µM) and Antimycin A (2 µM). B Cell viability assessed by CTG assay, 48 h after treatment with increasing doses of Tacle extract or vehicle. Live cells are represented as percentage of vehicle-treated cells. *p < 0.05. C Colony formation assay performed in AMO cells exposed for 10 days to Tacle extract (2 mg/mL), or vehicle as control. Histogram bars reported the mean ± SD of colony formation units of three independent experiments. Representative images of colonies at day 10 are also shown. *p < 0.05. D Flow cytometry evaluation of Annexin V-positive AMO cells, after 48 h of Tacle extract treatment. Data are representative of at least three independent biological replicates (n = 3). *p < 0.05. E q-RT-PCR analysis of SREBF1 and c-MYC mRNA expression levels in AMO cells, 48 h after Tacle exposure. Histogram bars represent the average ± SD of mRNA expression levels after normalization with GAPDH and ΔΔCt calculation method. *p < 0.05. F WB analysis of SREBP1 and c-MYC in AMO cells, 48 h after Tacle treatment. GAPDH or α-tubulin were used as loading control. *p < 0.05. G Triglycerides levels were determined using Triglycerides Glo assay in AMO cells after 2 mg/ml Tacle treatment; luminescence was evaluated at 48 h. *p < 0.05. H Fluorescence microscopy analysis of lipid droplets in AMO cells labeled with LipidTOX Red probe, 24 h after exposure to Tacle (2 mg/ml); representative images (100 × magnification) are reported. Histogram bars represented the average ± SD of the number of lipid droplets in at least 100 cells from three different fields
Fig. 6
Fig. 6
Tacle extract exerts anti-MM activity in vivo. A In vivo tumor growth evaluation of subcutaneous AMO xenografts receiving i.p. Tacle (250 mg/kg), or vehicle as control; administrations were performed 5 days a week for a total of two weeks. Average ± SD of the tumor volume for each group is shown; p-values were obtained using two-tailed t-test. *p < 0.05. B Kaplan–Meier curves relative to i.p. Tacle-treated AMO xenografts compared to control xenografts (log-rank test, *p < 0.05). Survival was evaluated from the first day of treatment until death or sacrifice. Percentage of mice alive is shown. WB analysis of C S616 p-DRP1, D Drp1, SREBP1, c-MYC and E pro-Caspase 3 protein levels in tumors retrieved from Tacle- or vehicle-treated mice. GAPDH was used as loading control. F IHC analysis (20 × magnification) of Ki-67 expression in AMO xenografts retrieved from mice, two weeks after Tacle treatment; representative images are reported

Similar articles

Cited by

References

    1. Kumar SK, Rajkumar V, Kyle RA, van Duin M, Sonneveld P, Mateos M-V, et al. Multiple myeloma. Nat Rev Dis Primers. 2017;3:17046. - PubMed
    1. Mitsiades CS, Hayden PJ, Anderson KC, Richardson PG. From the bench to the bedside: emerging new treatments in multiple myeloma. Best Pract Res Clin Haematol. 2007;20:797–816. - PMC - PubMed
    1. Alsayyah C, Ozturk O, Cavellini L, Belgareh-Touzé N, Cohen MM. The regulation of mitochondrial homeostasis by the ubiquitin proteasome system. Biochimica et Biophysica Acta (BBA) - Bioenergetics. 2020;1861:148302. - PubMed
    1. Nair R, Gupta P, Shanmugam M. Mitochondrial metabolic determinants of multiple myeloma growth, survival, and therapy efficacy. Front Oncol. 2022 doi: 10.3389/fonc.2022.1000106. - DOI - PMC - PubMed
    1. Zhan X, Yu W, Franqui-Machin R, Bates ML, Nadiminti K, Cao H, et al. Alteration of mitochondrial biogenesis promotes disease progression in multiple myeloma. Oncotarget. 2017;8:111213–111224. - PMC - PubMed

Publication types