. 2024 Feb 27;16(1):33.
doi: 10.1186/s13148-024-01641-x.

Reduced representative methylome profiling of cell-free DNA for breast cancer detection

Affiliations

Reduced representative methylome profiling of cell-free DNA for breast cancer detection

Qingmo Yang et al. Clin Epigenetics. .

Abstract

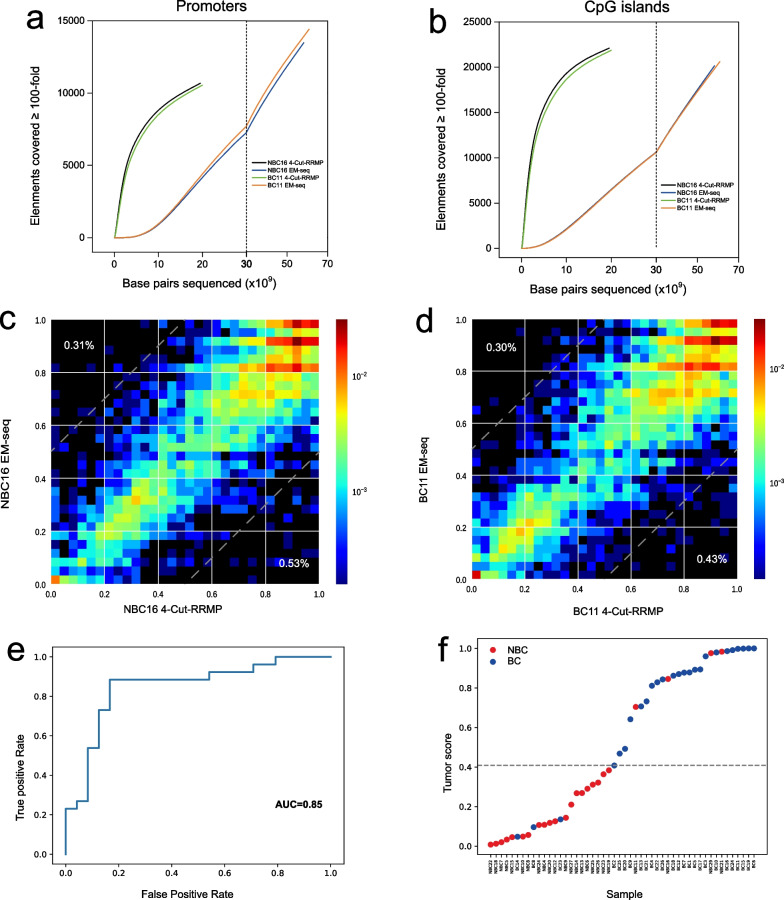
Background: Whole-genome methylation sequencing of cfDNA is not cost-effective for tumor detection. Here, we introduce reduced representative methylome profiling (RRMP), which employs restriction enzyme for depletion of AT-rich sequence to achieve enrichment and deep sequencing of CG-rich sequences.

Methods: We first verified the ability of RRMP to enrich CG-rich sequences using tumor cell genomic DNA and analyzed differential methylation regions between tumor cells and normal whole blood cells. We then analyzed cfDNA from 29 breast cancer patients and 27 non-breast cancer individuals to detect breast cancer by building machine learning models.

Results: RRMP captured 81.9% CpG islands and 75.2% gene promoters when sequenced to 10 billion base pairs, with an enrichment efficiency being comparable to RRBS. RRMP allowed us to assess DNA methylation changes between tumor cells and whole blood cells. Applying our approach to cfDNA from 29 breast cancer patients and 27 non-breast cancer individuals, we developed machine learning models that could discriminate between breast cancer and non-breast cancer controls (AUC = 0.85), suggesting possibilities for truly non-invasive cancer detection.

Conclusions: We developed a new method to achieve reduced representative methylome profiling of cell-free DNA for tumor detection.


Conflict of interest statement

Chen is the founder of Vangenes, Inc., X. Zhu, Y. Liu, Z. He, H. Xu, H. Zheng, Z. Huang, D. Wang, Z. Huang and X. Lin are employees of Vangenes, Inc. P. Guo is an employee of Huazao Biotechnology CO., LTD. The authors have filed a patent application on methods described in this manuscript (CN 113943779 A). The remaining authors declare no competing financial interests.

Figures

Fig. 1
Fig. 1
A reduced representative methylome profiling method. a Schematic representation of RRMP. b Genome plot for the GBGT1 gene locus compares read coverage between 1-cut RRMP (K562) and public WGBS (K562) and RRBS (SW1353) datasets. Boxes represent reads, and unmethylated (blue) and methylated (red) CpGs are indicated. CpG islands are indicated. c Genome plot for the GBGT1 gene locus shows distribution of 1-cut RRMP reads and MseI targeted sites in both Watson and Crick strand. d, e Plot shows the average coverage depth as a function of distance between the upstream and downstream enzyme recognition sites in both Watson (d) and Crick (e) strand
Fig. 2
Fig. 2
RRMP analysis of methylation in CpG island and promoters. a, b Plots show the number of CpG islands (a) or promoters (b) with at least 100-fold combined coverage as a function of sequencing depth (x axis) for 1-cut RRMP (K562), XRBS (K562), WGBS (K562), and RRBS (SW1353). Enrichment for functional elements at a uniform sequencing depth of 10 billion base pairs is indicated. Vertical gray line indicates break in x-axis scale. c, Plot shows coverage depth of CpGs in WGBS, XRBS, 1-cut RRMP, and 4-cut RRMP at a uniform sequencing depth of 10 billion base pairs. df Heat maps compare individual CpG methylation values between 1-cut RRMP and WGBS (d, r = 0.88), 1 cut-RRMP and XRBS (e, r = 0.85), 1 cut-RRMP and 4-cut RRMP (f, r = 0.98) for K562 cells. Analysis limited to CpGs with at least 20-fold coverage (n = 128,501, 160,804 and 1,659,714 CpGs). Percentages indicate the fraction of CpGs that differed between conditions (difference in beta values > 0.5). g, h Heatmaps compare average DNA methylation values from 1-cut RRMP datasets with signal for H3K4me3 (g) and H3K27ac (h) for K562 cells. Percentages indicate the fraction of hypermethylated (beta value >  = 10%) and hypomethylated(beta value < 10%) regions with Chip-seq signal > 1
Fig. 3
Fig. 3
Analysis of tumor-related DNA methylation using RRMP. a Heat map shows genome-wide DNA methylation in 100-kb windows across 9 tumor cell lines and 3 WBC samples. Windows are sorted by decreasing DNA methylation for each cell line. Average methylation value for each sample is indicated below. b Heat map depicts hypermethylated and hypomethylated regions in tumor cells compared to WBC samples. c Heat map depicts hypermethylated and hypomethylated regions in each type of tumor cells compared to WBC samples and other tumor cell lines. d, e Heat map depicts 8-kb genomic regions (rows, n = 3972 promoters) centered at transcription start sites and divided into 100 equally sized bins. Panels show average methylation from 1000-cell XRBS profiles for the indicated cell types. Promoters (rows, ≥ 25-fold combined coverage in every cell line) are grouped by the cell line in which they are specifically hypermethylated (d) or hypomethylated (e). Hypomethylated promoters specific to K562 cells are downsampled for visualization. A full list of differentially methylated promoters is provided in Additional file 1: Table S3. f Heat map depicts 8-kb regions (rows, n = 15,202 regions) centered on H3K4me3 peaks identified in NCI-H460 and HT29 ChIP-seq datasets. Rows are ordered by DNA methylation difference between both cell lines. Panels show average methylation from 4-cut RRMP profiles and H3K4me3 signals for NCI-H460 and HT29. Cell-line-specific DNA hypomethylation correlates with H3K4me3 signal. Peaks not specifically hypomethylated in either cell line (‘Others’) were downsampled for visualization
Fig. 4
Fig. 4
Breast cancer detection using RRMP analysis of cfDNA. a, b Plots show the number of CpG islands (a) or promoters (b) with at least 100-fold combined coverage as a function of sequencing depth (x axis) for 4-cut RRMP and EM-seq from two cfDNA samples NBC16 and BC11. Vertical gray line indicates break in x-axis scale. c, d Heat maps compare individual CpG methylation values between 4-cut RRMP and EM-seq for cfDNA samples NBC16 (c, r = 0.86) and BC11 (d, r = 0.87). Analysis limited to CpGs with at least tenfold coverage (n = 6358 and 7028 CpGs). Percentages indicate the fraction of CpGs that differed between conditions (difference in beta values > 0.5). e Receiver operator characteristic curves (ROC) and area under the curve (AUC) values. f LOO cancer prediction scores for BC and NBC. Dashed line represents probability score threshold. Samples with a probability score above this threshold were predicted as BC

References

    1. Aucamp J, Bronkhorst AJ, Badenhorst CP, Pretorius PJ. The diverse origins of circulating cell-free DNA in the human body: a critical re-evaluation of the literature. Biol Rev. 2018;93(3):1649–1683. doi: 10.1111/brv.12413. - DOI - PubMed
    1. Kustanovich A, Schwartz R, Peretz T, Grinshpun A. Life and death of circulating cell-free DNA. Cancer Biol Ther. 2019;20(8):1057–1067. doi: 10.1080/15384047.2019.1598759. - DOI - PMC - PubMed
    1. Yan Y-y, Guo Q-r, Wang F-h, Adhikari R, Zhu Z-y, Zhang H-y, et al. Cell-free DNA: hope and potential application in cancer. Front Cell Dev Biol 2021;9:639233 - PMC - PubMed
    1. Bronkhorst AJ, Ungerer V, Holdenrieder S. The emerging role of cell-free DNA as a molecular marker for cancer management. Biomol Detect Quantif. 2019;17:100087. doi: 10.1016/j.bdq.2019.100087. - DOI - PMC - PubMed
    1. Salvi S, Gurioli G, De Giorgi U, Conteduca V, Tedaldi G, Calistri D, et al. Cell-free DNA as a diagnostic marker for cancer: current insights. Oncotargets Ther 2016:6549–59. - PMC - PubMed

Publication types

Substances