. 2024 Feb 27;18(1):21.
doi: 10.1186/s40246-024-00586-9.

Combining full-length gene assay and SpliceAI to interpret the splicing impact of all possible SPINK1 coding variants

Affiliations

Combining full-length gene assay and SpliceAI to interpret the splicing impact of all possible SPINK1 coding variants

Hao Wu et al. Hum Genomics. .

Abstract

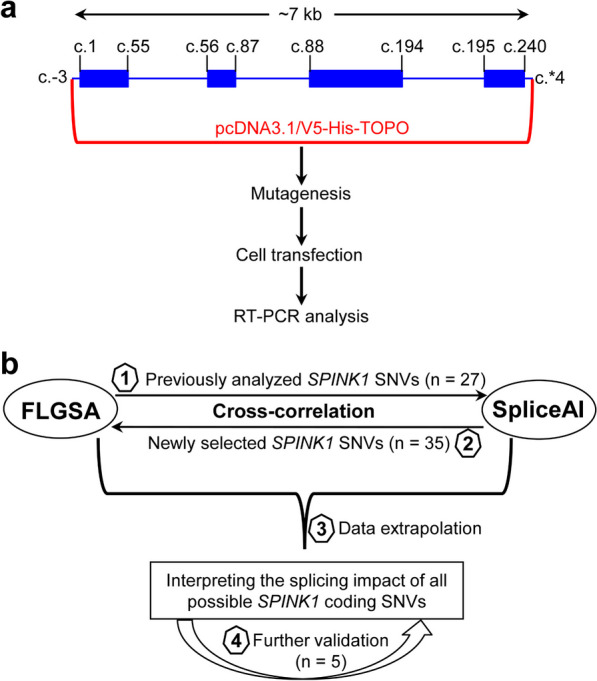
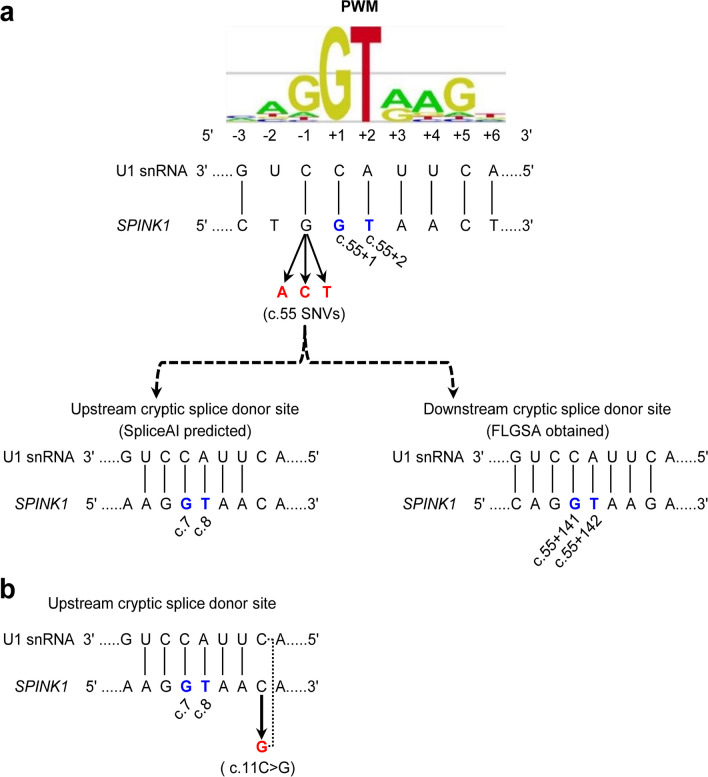
Background: Single-nucleotide variants (SNVs) within gene coding sequences can significantly impact pre-mRNA splicing, bearing profound implications for pathogenic mechanisms and precision medicine. In this study, we aim to harness the well-established full-length gene splicing assay (FLGSA) in conjunction with SpliceAI to prospectively interpret the splicing effects of all potential coding SNVs within the four-exon SPINK1 gene, a gene associated with chronic pancreatitis.

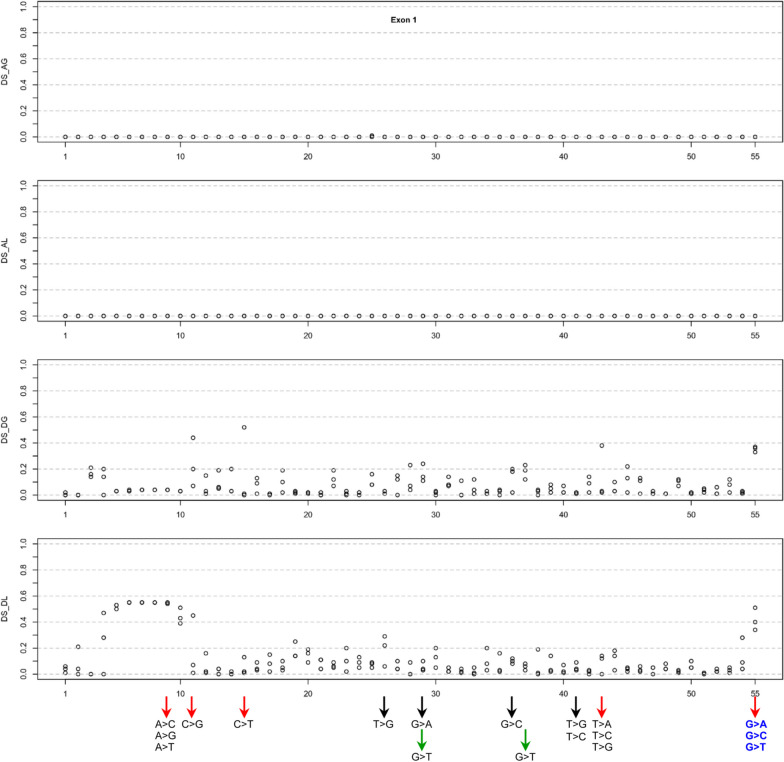
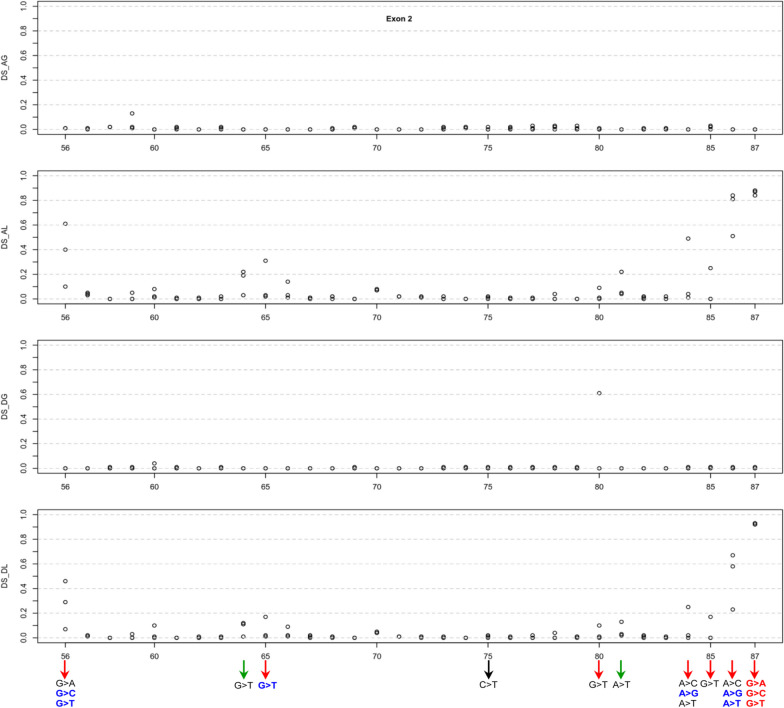
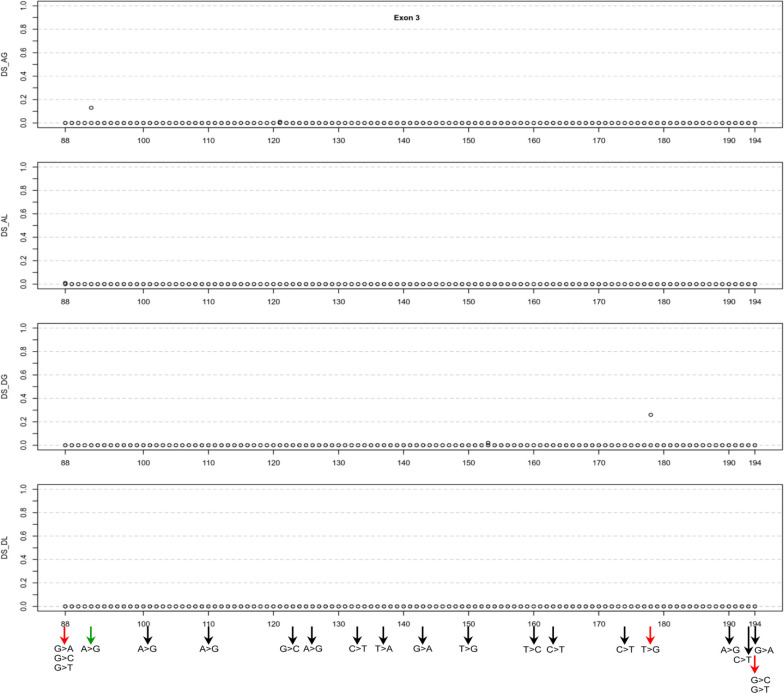
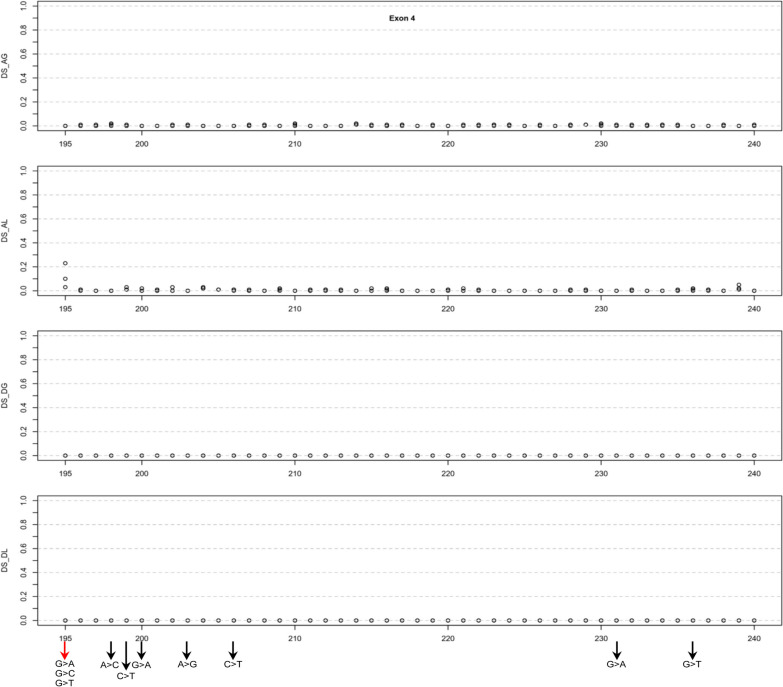
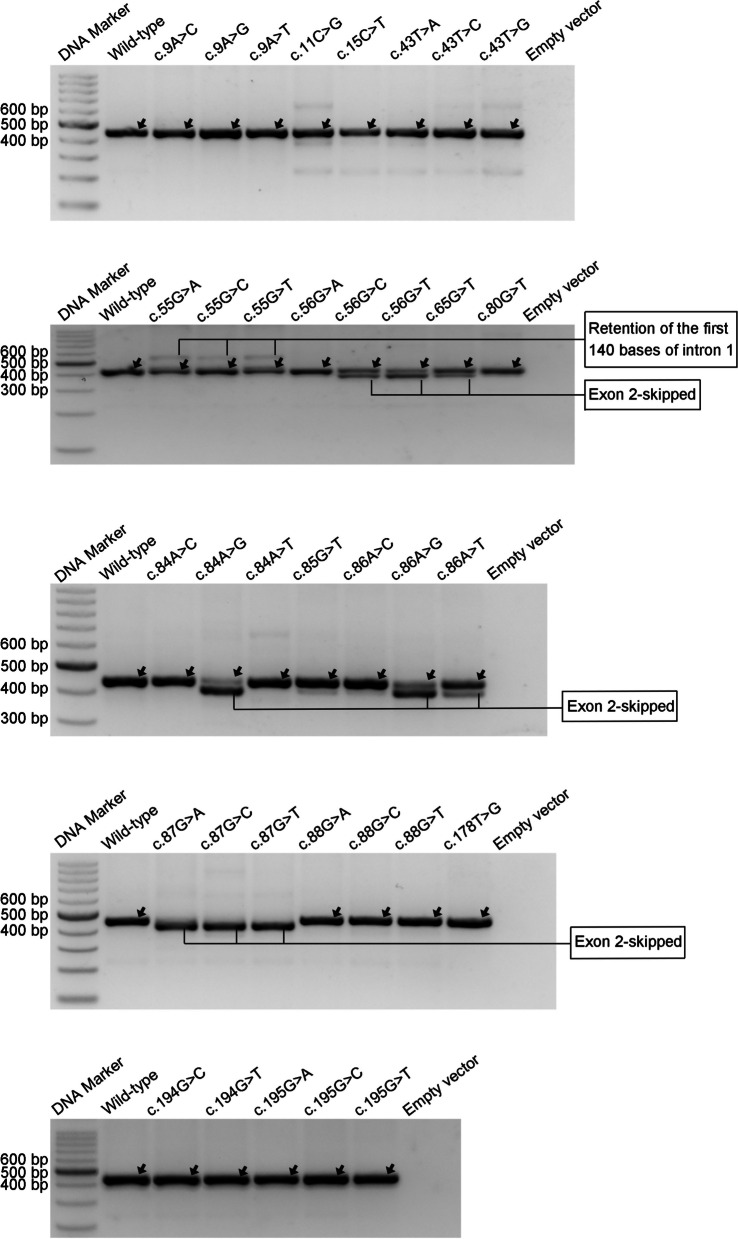
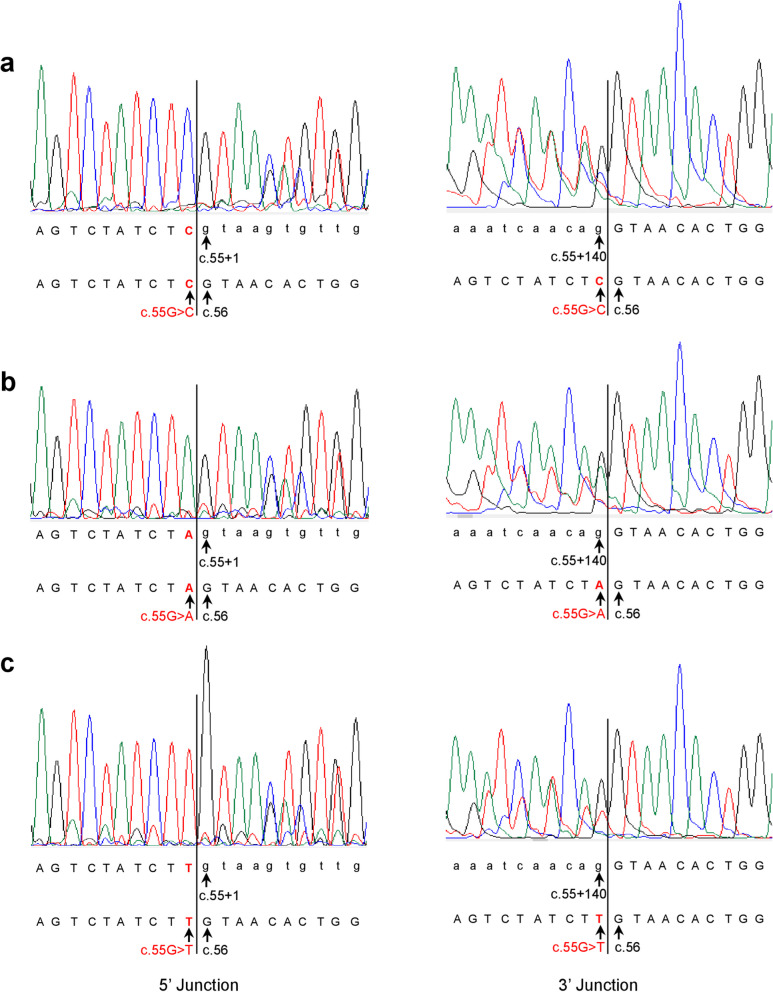
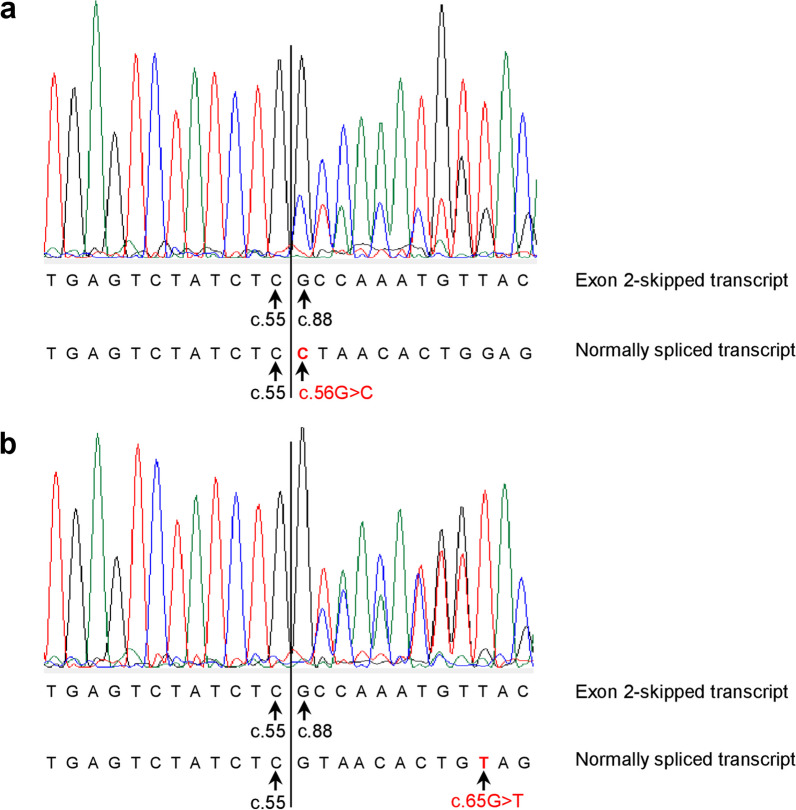
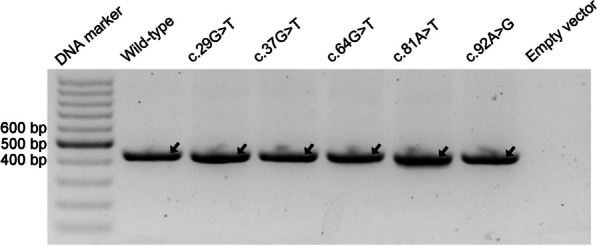
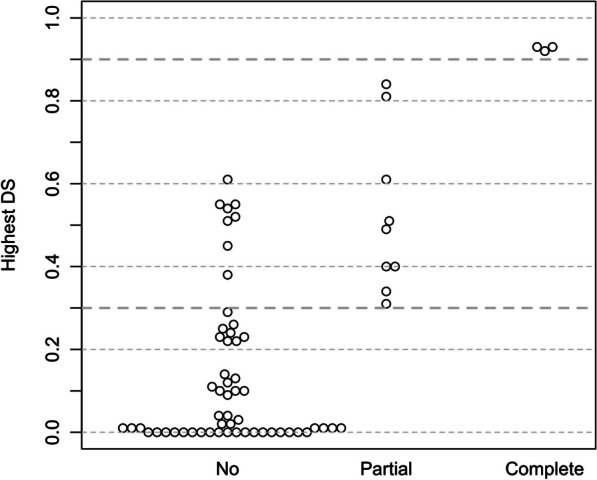
Results: Our study began with a retrospective analysis of 27 SPINK1 coding SNVs previously assessed using FLGSA, proceeded with a prospective analysis of 35 new FLGSA-tested SPINK1 coding SNVs, followed by data extrapolation, and ended with further validation. In total, we analyzed 67 SPINK1 coding SNVs, which account for 9.3% of the 720 possible coding SNVs. Among these 67 FLGSA-analyzed SNVs, 12 were found to impact splicing. Through detailed comparison of FLGSA results and SpliceAI predictions, we inferred that the remaining 653 untested coding SNVs in the SPINK1 gene are unlikely to significantly affect splicing. Of the 12 splice-altering events, nine produced both normally spliced and aberrantly spliced transcripts, while the remaining three only generated aberrantly spliced transcripts. These splice-impacting SNVs were found solely in exons 1 and 2, notably at the first and/or last coding nucleotides of these exons. Among the 12 splice-altering events, 11 were missense variants (2.17% of 506 potential missense variants), and one was synonymous (0.61% of 164 potential synonymous variants). Notably, adjusting the SpliceAI cut-off to 0.30 instead of the conventional 0.20 would improve specificity without reducing sensitivity.

Conclusions: By integrating FLGSA with SpliceAI, we have determined that less than 2% (1.67%) of all possible coding SNVs in SPINK1 significantly influence splicing outcomes. Our findings emphasize the critical importance of conducting splicing analysis within the broader genomic sequence context of the study gene and highlight the inherent uncertainties associated with intermediate SpliceAI scores (0.20 to 0.80). This study contributes to the field by being the first to prospectively interpret all potential coding SNVs in a disease-associated gene with a high degree of accuracy, representing a meaningful attempt at shifting from retrospective to prospective variant analysis in the era of exome and genome sequencing.

Keywords: SPINK1 gene; Chronic pancreatitis; Full-length gene splicing assay (FLGSA); Pre-mRNA splicing; Precision medicine in genetics; Single-nucleotide variants (SNVs); Splice site; SpliceAI; Splicing prediction algorithms; Variant interpretation.


Conflict of interest statement

Jian-Min Chen serves as an Associate Editor for Human Genomics but was not involved in the editorial review process or the decision to publish this article. All remaining authors declare that they have no competing interests.

Figures

Fig. 1
Fig. 1
Overview of the FLGSA assay and research strategy. a Representation of the SPINK1 full-length gene expression vector and the experimental steps involved in the FLGSA assay for each study variant. The coding sequences of the four-exon SPINK1 gene are depicted to scale, while the intronic and untranslated region sequences are not. The reference SPINK1 genomic sequence is NG_008356.2, and the reference SPINK1 mRNA sequence is MANE (Matched Annotation from the NCBI and EMBL-EBI [45]) select ENST00000296695 or NM_001379610.1. NM_001379610.1 represents the SPINK1 transcript isoform expressed in the exocrine pancreas [29, 30]. The starting and ending positions of the coding sequences in each exon, as well as those of the SPINK1 genomic sequence cloned into the pcDNA3.1/V5-His-TOPO vector, are indicated in accordance with NM_001379610. b Illustration demonstrating how the FLGSA assay was integrated with SpliceAI to prospectively evaluate the splicing effects of all potential coding variants within the SPINK1 gene. Abbreviations: FLGSA, full-length gene splicing assay; RT-PCR, reverse transcription-PCR; SNVs, single-nucleotide variants
Fig. 2
Fig. 2
Graphical illustration of the SpliceAI Δ scores for three potential single-nucleotide variants at each coding position within SPINK1 exon 1. The x-axis enumerates the coding positions to correlate Δ scores with specific nucleotide changes. Variants subjected to full-length gene splicing assay are highlighted at the figure's bottom, with arrows denoting their analysis status: black for previously analyzed variants, red for those currently assessed in the initial step of prospective analysis, and green for variants in the further validation phase. Variant labels are styled to indicate transcript outcomes: variants producing solely normally spliced transcripts are in standard font, while those resulting in both normally spliced and aberrantly spliced transcripts are highlighted in bold blue. Abbreviations: DS, Δ score; AG, acceptor gain; AL, acceptor loss; DG, donor gain; DL, donor loss
Fig. 3
Fig. 3
Graphical illustration of the SpliceAI Δ scores for three potential single-nucleotide variants at each coding position within SPINK1 exon 2. The x-axis enumerates the coding positions to correlate Δ scores with specific nucleotide changes. Variants subjected to full-length gene splicing assay are highlighted at the figure's bottom, with arrows denoting their analysis status: black for previously analyzed variants, red for those currently assessed in the initial step of prospective analysis, and green for variants in the subsequent validation phase. The typographic treatment of variant names reflects their transcript profiles: standard font denotes variants leading to only normally spliced transcripts, bold blue highlights variants associated with both normally spliced and aberrantly spliced transcripts, and bold red identifies variants exclusively resulting in aberrantly spliced transcripts. Abbreviations: DS, Δ score; AG, acceptor gain; AL, acceptor loss; DG, donor gain; DL, donor loss
Fig. 4
Fig. 4
Graphical illustration of the SpliceAI Δ scores for three potential single-nucleotide variants at each coding position within SPINK1 exon 3. The x-axis enumerates the coding positions to correlate Δ scores with specific nucleotide changes. Variants subjected to full-length gene splicing assay are highlighted at the figure's bottom, with arrows denoting their analysis status: black for previously analyzed variants, red for those currently assessed in the initial step of prospective analysis, and green for variants in the subsequent validation phase. All variants generated exclusively normally spliced transcripts. Abbreviations: DS, Δ score; AG, acceptor gain; AL, acceptor loss; DG, donor gain; DL, donor loss
Fig. 5
Fig. 5
Graphical illustration of the SpliceAI Δ scores for three potential single-nucleotide variants at each coding position within SPINK1 exon 4. The x-axis enumerates the coding positions to correlate Δ scores with specific nucleotide changes. Variants subjected to full-length gene splicing assay are highlighted at the figure's bottom, with arrows denoting their analysis status: black for previously analyzed variants and red for those currently assessed in the initial step of prospective analysis. All variants generated exclusively normally spliced transcripts. Abbreviations: DS, Δ score; AG, acceptor gain; AL, acceptor loss; DG, donor gain; DL, donor loss
Fig. 6
Fig. 6
RT-PCR results from the FLGSA analysis of 35 potential SPINK1 coding variants. Each band that underwent successful Sanger sequencing has been systematically annotated. These bands have been classified as either normally spliced transcripts (indicated by arrows) or aberrantly spliced transcripts, characterized by the retention of the first 140 bases of intron 1 or the skipping of exon 2. It is noteworthy that in cases where a variant produced two successfully sequenced bands, certain bands may contain both normally spliced and aberrantly spliced transcript isoforms. For further details and interpretation of these findings, refer to the main text. Full-length, unaltered gel images corresponding to this figure are made accessible in Additional file 2. Abbreviations: FLGSA, full-length gene splicing assay. RT-PCR, reverse transcription-PCR
Fig. 7
Fig. 7
Sanger Sequencing results of 'Retention of the first 140 bases of intron 1' RT-PCR bands from three exon 1 terminal variants (c.56G > A/C/T) in SPINK1. Refer to Fig. 6 for the corresponding bands. Each band was found to contain a mixture of aberrantly spliced and normally spliced transcripts, with the 5’ and 3’ junctions of the aberrant transcript isoform, being delineated by vertical lines. The annotations beneath the electropherograms detail the junction-spanning sequences for both isoforms: the upper annotation for the aberrantly spliced transcript and the lower for the normally spliced transcript. In all subpanels, the normally spliced transcripts show a consistent sequence of exon 1 followed by exon 2, with the introduced exon 1 terminal variants highlighted in red. The aberrantly spliced transcripts have consistent 5’ junctions with exon 1 followed by intron 1 sequences (introduced variants in red), and their 3’ junctions are uniform, displaying retained intron 1 sequence (up to c.55 + 140) followed by exon 2. Sequence numbering is based on NM_001379610.1. Specifically, c.55 and c.56 denote the terminal position of exon 1 and the start of exon 2 in SPINK1, respectively; c.55 + 1 and c.55 + 140 refer to the first and the 140th nucleotides of intron 1 in SPINK1. Abbreviations: RT-PCR, reverse transcription-PCR
Fig. 8
Fig. 8
Sanger sequencing of 'Exon 2-skipped' RT-PCR bands from two exon 2 variants (c.56G > C and c.65G > T) in SPINK1. For the corresponding bands, refer to Fig. 6. Sanger sequencing revealed that each band contains a mix of aberrantly spliced and normally spliced transcripts, with the junctions of both transcript isoforms being delineated by vertical lines. Annotations beneath the electropherograms specify the junction-spanning sequences for both isoforms: the upper annotation pertains to the aberrantly spliced transcript, and the lower to the normally spliced transcript. In both panels, the normally spliced transcripts exhibit a consistent sequence of exon 1 followed by exon 2, differentiated only by the introduced variants (highlighted in red). The aberrantly spliced transcripts are identical, characterized by exon 1 directly followed by exon 3. Sequence numbering aligns with NM_001379610.1. Specifically, c.55, c.56, and c.88 mark the terminal position of exon 1, the start of exon 2, and the start of exon 3 in SPINK1, respectively
Fig. 9
Fig. 9
Interpretation of the three c.55 SNVs and the c.11C > G variant in exon 1 by reference to SpliceAI predictions and FLGSA results. a Illustration of the (partial) disruption of the physiological 5’ splice donor site of SPINK1 intron 1 caused by the three potential SNVs at the last nucleotide of exon 1 (c.55). This disruption is shown in the context of the corresponding 9-bp 5’ splice signal sequence, which interacts with the 3’-GUCCAUUCA-5’ sequence at the 5’ end of U1snRNA. SpliceAI predicted this disruption (DL scores, 0.34 to 0.51) and the activation of an upstream cryptic splice donor site within exon 1 (DG scores, 0.33 and 0.37). However, our FLGSA assay revealed the activation of a downstream cryptic splice donor site. Vertical lines indicate paired bases between the 9-bp 5’ splice signal sequence and the 5’ end sequence of U1snRNA. The GT dinucleotides involved are highlighted in blue, with their positions (in accordance with NM_001379610.1) indicated. The 9-bp 5' splice site signal sequence position weight matrices (PWM) were sourced from Leman et al. [52], an Open Access article distributed under the terms of the Creative Commons Attribution Non-Commercial License. Note that the 9-bp 5’ splice signal sequences, whether in the context of the consensus sequence or SPINK1 sequences, are presented in DNA. b Illustration of the c.11C > G variant in the context of the aforementioned upstream cryptic splice donor site. A dotted line represents the new base pairing derived from the variant, enhancing the interaction between the 9-bp 5’ splice signal sequence and the 5’ end sequence of U1snRNA
Fig. 10
Fig. 10
RT-PCR results for the validation analysis of five potential SPINK1 coding variants through FLGSA. Arrows indicate wild-type or normally spliced transcripts, all of which were confirmed by Sanger sequencing. Full-length, unaltered gel image corresponding to this figure is made accessible in Additional file 3. Abbreviations: FLGSA, full-length gene splicing assay. RT-PCR, reverse transcription-PCR
Fig. 11
Fig. 11
Overall correlation between FLGSA findings and SpliceAI predictions across all exons of the SPINK1 gene. On the y-axis, "Highest DS" represents the highest Δ score among the four SpliceAI predictions for each of the 67 SPINK1 variants analyzed through the full-length gene splicing assay (refer to Table 1 for details). The x-axis categorizes the variants based on their transcript outcomes: "No" for variants exclusively producing normally spliced transcripts, "Partial" for variants leading to a mix of normally and aberrantly spliced transcripts, and "Complete" for variants solely resulting in aberrantly spliced transcripts. Δ scores of 0.90 and 0.30 are demarcated with thicker dotted lines to denote thresholds for exclusive generation of aberrantly spliced or normally spliced transcripts, respectively

Similar articles

Cited by

References

    1. Lim KH, Ferraris L, Filloux ME, Raphael BJ, Fairbrother WG. Using positional distribution to identify splicing elements and predict pre-mRNA processing defects in human genes. Proc Natl Acad Sci U S A. 2011;108(27):11093–11098. - PMC - PubMed
    1. Manning KS, Cooper TA. The roles of RNA processing in translating genotype to phenotype. Nat Rev Mol Cell Biol. 2017;18(2):102–114. - PMC - PubMed
    1. Cartegni L, Chew SL, Krainer AR. Listening to silence and understanding nonsense: exonic mutations that affect splicing. Nat Rev Genet. 2002;3(4):285–298. - PubMed
    1. Sarkar A, Panati K, Narala VR. Code inside the codon: The role of synonymous mutations in regulating splicing machinery and its impact on disease. Mutat Res Rev Mutat Res. 2022;790:108444. - PubMed
    1. Aicher JK, Jewell P, Vaquero-Garcia J, Barash Y, Bhoj EJ. Mapping RNA splicing variations in clinically accessible and nonaccessible tissues to facilitate Mendelian disease diagnosis using RNA-seq. Genet Med. 2020;22(7):1181–1190. - PMC - PubMed

Substances

LinkOut - more resources