. 2024 Feb 27;43(1):60.
doi: 10.1186/s13046-024-02982-4.

Targeting HDAC6 improves anti-CD47 immunotherapy

Affiliations

Targeting HDAC6 improves anti-CD47 immunotherapy

Maria Gracia-Hernandez et al. J Exp Clin Cancer Res. .

Abstract

Background: Cancer cells can overexpress CD47, an innate immune checkpoint that prevents phagocytosis upon interaction with signal regulatory protein alpha (SIRPα) expressed in macrophages and other myeloid cells. Several clinical trials have reported that CD47 blockade reduces tumor growth in hematological malignancies. However, CD47 blockade has shown modest results in solid tumors, including melanoma. Our group has demonstrated that histone deacetylase 6 inhibitors (HDAC6is) have immunomodulatory properties, such as controlling macrophage phenotype and inflammatory properties. However, the molecular and cellular mechanisms controlling these processes are not fully understood. In this study, we evaluated the role of HDAC6 in regulating the CD47/SIRPα axis and phagocytosis in macrophages.

Methods: We tested the role of HDAC6is, especially Nexturastat A, in regulating macrophage phenotype and phagocytic function using bone marrow-derived macrophages and macrophage cell lines. The modulation of the CD47/SIRPα axis and phagocytosis by HDAC6is was investigated using murine and human melanoma cell lines and macrophages. Phagocytosis was evaluated via coculture assays of macrophages and melanoma cells by flow cytometry and immunofluorescence. Lastly, to evaluate the antitumor activity of Nexturastat A in combination with anti-CD47 or anti-SIRPα antibodies, we performed in vivo studies using the SM1 and/or B16F10 melanoma mouse models.

Results: We observed that HDAC6is enhanced the phenotype of antitumoral M1 macrophages while decreasing the protumoral M2 phenotype. In addition, HDAC6 inhibition diminished the expression of SIRPα, increased the expression of other pro-phagocytic signals in macrophages, and downregulated CD47 expression in mouse and human melanoma cells. This regulatory role on the CD47/SIRPα axis translated into enhanced antitumoral phagocytic capacity of macrophages treated with Nexturastat A and anti-CD47. We also observed that the systemic administration of HDAC6i enhanced the in vivo antitumor activity of anti-CD47 blockade in melanoma by modulating macrophage and natural killer cells in the tumor microenvironment. However, Nexturastat A did not enhance the antitumor activity of anti-SIRPα despite its modulation of macrophage populations in the SM1 tumor microenvironment.

Conclusions: Our results demonstrate the critical regulatory role of HDAC6 in phagocytosis and innate immunity for the first time, further underscoring the use of these inhibitors to potentiate CD47 immune checkpoint blockade therapeutic strategies.

Keywords: CD47; Histone deacetylases; Immunotherapy; Macrophages; Melanoma; Nexturastat A; Phagocytosis.


Conflict of interest statement

The authors declare no competing interests.

Figures

Fig. 1
Fig. 1
HDAC6 inhibition modulates macrophage phenotype. Macrophages were unpolarized (M0, naïve) or polarized to M1-like phenotypes and M2-like phenotype in the presence or absence of the HDAC6 inhibitor Nexturastat A (NextA, 5 µM). A Analysis of M1 phenotype markers NOS2 and Cd80 expression of A31A7 macrophages or primary murine BMDMs by qRT-PCR. B Analysis of M1 phenotype cell surface markers H2 and CD80 on A31A7 macrophages or murine BMDMs by flow cytometry. C Analysis of M2 phenotype marker Arg1 expression of A31A7 macrophages or BMDMs by qRT-PCR. D Analysis of M2 phenotype cell surface marker CD206 on A31A7 macrophages or BMDMs by flow cytometry. E Immunofluorescence analysis of M1 marker, iNOS in M1 polarized BMDMs with or without NextA treatment. F Immunofluorescence analysis of M2 marker, Arg1 in M2 polarized BMDMs with or without NextA treatment. Nuclei stained with DAPI are shown in blue, iNOS and Arg1 protein staining are shown in green. G Western blot analysis of M1 (iNOS) and M2 (Arg1) associated markers. Ac-Tubulin indicated inhibition of HDAC6, and Tubulin is loading control. H Gene expression analysis of M1 markers NOS2, CD86, and IL1B in THP-1-derived M1 macrophages and (I) M2 markers MRC1 (CD206) and CD209 in M2 macrophages by qRT-PCR. Scale bars represent 50 μm. *, P < 0.05; **, P < 0.01; ***, P < 0.001; ****, P < 0.0001; ns, non-significant
Fig. 2
Fig. 2
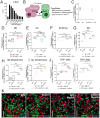
Nexturastat A downregulates SIRPα expression in macrophages. Macrophages were unpolarized (M0, naïve) or polarized to M1-like phenotypes and M2-like phenotype in the presence or absence of Nexturastat A (NextA, 5 µM).A Gene expression analysis of SIRPα in A31A7 macrophages (left panel), BMDMs (middle panel), and THP-1-derived macrophages (right panel) evaluated by qRT-PCR. B Cell surface expression of SIRPα in A31A7 macrophages (left) and BMDMs (right). C Western blots evaluating the SIRPα expression in A31A7 macrophages upon NextA treatment with alpha tubulin as a loading control. D Immunofluorescence microscopy representing changes in SIRPα expression (in green) in BMDMs upon NextA treatment. Nuclei were stained with DAPI (in blue). Scale bars represent 50 μm. E Pearson correlation between HDAC6 and SIRPα expression in skin cutaneous melanoma patients obtained from the TCGA database through GEPIA. F Overall survival of skin cutaneous melanoma patients as it relates to high or low SIRPα expression; data obtained from the TCGA database through GEPIA. *, P < 0.05; **, P < 0.01; ***, P < 0.001; ****, P < 0.0001; ns, non-significant
Fig. 3
Fig. 3
HDAC6 controls CD47 expression in melanoma cells. A Comparison of basal expression levels of Cd47 in SM1 and B16 mouse melanoma cells by flow cytometry. BCd47 gene expression analysis of SM1 and B16 cells upon stimulation with IFNγ (100 ng/ml) in the absence or presence of 5 µM of NextA or Tubastatin A (TubA), evaluated by qRT-PCR. C Cell surface expression of Cd47 in SM1 cells upon stimulation with IFNγ in the absence or presence of NextA evaluated by flow cytometry. D Western Blotting analysis of HDAC6 after performing a partial knockdown (KD) in B16 cells compared to the non-target control (NT). Acetylated tubulin is used as a marker for HDAC6 inhibition, and alpha tubulin is a loading control. E qRT-PCR evaluating Hdac6 expression in B16 NT and HDAC6 KD cells. F-G qRT-PCR (F) and flow cytometry (G) analyses of Cd47 expression in NT and HDAC6 KD B16 cells. H Flow cytometry evaluating basal cell surface expression of CD47 in the human melanoma cell line WM164 NT and HDAC6 KD. I CD47 expression analysis of WM164 NT and HDAC6 KD cells upon IFNγ stimulation, evaluated by qRT-PCR at different timepoints. J qRT-PCR evaluating CD47 expression in human melanoma cells WM1361A upon IFNγ stimulation and in the presence of 2.5, 5, and 10 µM of NextA. K qRT-PCR evaluating CD47 expression in WM793 human melanoma cells upon IFNγ stimulation and in the presence of 5 µM of NextA. *, P < 0.05; **, P < 0.01; ***, P < 0.001; ****, P < 0.0001; ns, non-significant
Fig. 4
Fig. 4
Nexturastat A enhances the phagocytic capacity of macrophages. A CD47 antibody titration (miap301) in SM1 cells by flow cytometry. Graph shows unblocked CD47 expression on melanoma cells at different concentrations of the anti-CD47 antibody. B Schematic representation of conditions used in phagocytosis assays. For figure panels C through K, BMDMs or THP-1-derived macrophages were unpolarized (M0) or polarized to M1-like or M2-like phenotype in the presence or absence of Nexturastat A (NextA, 5 µM). For figure panels C through J, melanoma cells were stained with CFSE and cocultured at a 2:1 ratio with macrophages, and phagocytosis was analyzed by flow cytometry. C Comparison of phagocytosis rates of M0, M1-like or M2-like BMDMs cocultured with CFSE stained SM1 cells. D-G Phagocytosis assays of untreated or NextA treated BMDMs cocultured with CFSE stained SM1 cells in the presence or absence of anti-CD47 or IgG isotype control (25 µg/ml). H-I Phagocytosis assays of BMDMs harvested from wild type C57BL/6 mice or HDAC6 knockout (KO) mice in the presence of anti-CD47 or isotype control. J Phagocytosis assays of THP-1-derived macrophages cocultured with WM164 human melanoma cells in the presence of human anti-CD47 or isotype control. All flow cytometry-based phagocytosis assays are quantified as % CFSE+ F4/80+ or CFSE+ CD11b+ cells out of total F4/80+ or CD11b+ cells. K Representative images of phagocytosis assays performed by confocal microscopy using BMDMs isolated from GFP mice (in green) and SM1 melanoma cells stained with CellTrace Far Red (shown in red). Nuclei were stained with DAPI (shown in blue). White arrow heads represent internalization of SM1 cells by macrophages. Scale bars represent 50 μm. *, P < 0.05; **, P < 0.01; ***, P < 0.001; ****, P < 0.0001; ns, non-significant
Fig. 5
Fig. 5
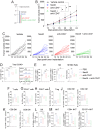
Nexturastat A enhances the antitumor efficacy of anti-CD47 in SM1 melanoma-bearing mice. A Schematic representation of treatment timeline. B Tumor growth kinetics of SM1 melanoma tumors (n = 9–12 mice per group) treated with vehicle control, Nexturastat A (NextA, 20 mg/kg, IP), anti-CD47 (100 µg intratumoral), or combination. C Individual tumor growth kinetics in the different groups. Immunophenotyping of tumors was performed by flow cytometry at day 24 post-tumor implantation. The immune cell populations include total CD45+ immune cells (D) M1-like, M2-like, and M1/M2 ratio (E) total CD3+ T cells (F) total CD4+ T cells (G) total CD8+ T cells (H) T-regs (I) effector memory (EM) and central memory (CM) CD4+ T cells (J) effector memory (EM) and central memory (CM) CD8+ T cells (K) total NK cells NK cells (L) and total NKT, CD8+ NKT, and CD137+ CD8 + NKT (M). The surface markers used to identify the populations are indicated on the y axis of every graph. *, P < 0.05; **, P < 0.01; ***, P < 0.001; ****, P < 0.0001; ns, non-significant

References

    1. Strome SE, et al. B7-H1 blockade augments adoptive T-cell immunotherapy for squamous cell carcinoma. Cancer Res. 2003;63:6501–5. - PubMed
    1. Iwai Y, et al. Involvement of PD-L1 on tumor cells in the escape from host immune system and tumor immunotherapy by PD-L1 blockade. Proc Natl Acad Sci. 2002;99:12293–7. doi: 10.1073/pnas.192461099. - DOI - PMC - PubMed
    1. Dobry AS, et al. Management of metastatic melanoma: improved survival in a national cohort following the approvals of checkpoint blockade immunotherapies and targeted therapies. Cancer Immunol Immunother CII. 2018;67:1833–44. doi: 10.1007/s00262-018-2241-x. - DOI - PMC - PubMed
    1. Huang AC, Zappasodi R. A decade of checkpoint blockade immunotherapy in melanoma: understanding the molecular basis for immune sensitivity and resistance. Nat Immunol. 2022;23:660–70. doi: 10.1038/s41590-022-01141-1. - DOI - PMC - PubMed
    1. Wolchok JD, et al. Long-term outcomes with Nivolumab Plus Ipilimumab or Nivolumab alone Versus Ipilimumab in patients with Advanced Melanoma. J Clin Oncol off J Am Soc Clin Oncol. 2022;40:127–37. doi: 10.1200/JCO.21.02229. - DOI - PMC - PubMed