. 2024 Feb 27;15(1):56.
doi: 10.1186/s13287-023-03582-3.

Impact of tissue factor expression and administration routes on thrombosis development induced by mesenchymal stem/stromal cell infusions: re-evaluating the dogma

Affiliations

Impact of tissue factor expression and administration routes on thrombosis development induced by mesenchymal stem/stromal cell infusions: re-evaluating the dogma

Van T Hoang et al. Stem Cell Res Ther. .

Abstract

Background: Hyperactive coagulation might cause dangerous complications such as portal vein thrombosis and pulmonary embolism after mesenchymal stem/stromal cell (MSC) therapy. Tissue factor (TF), an initiator of the extrinsic coagulation pathway, has been suggested as a predictor of this process.

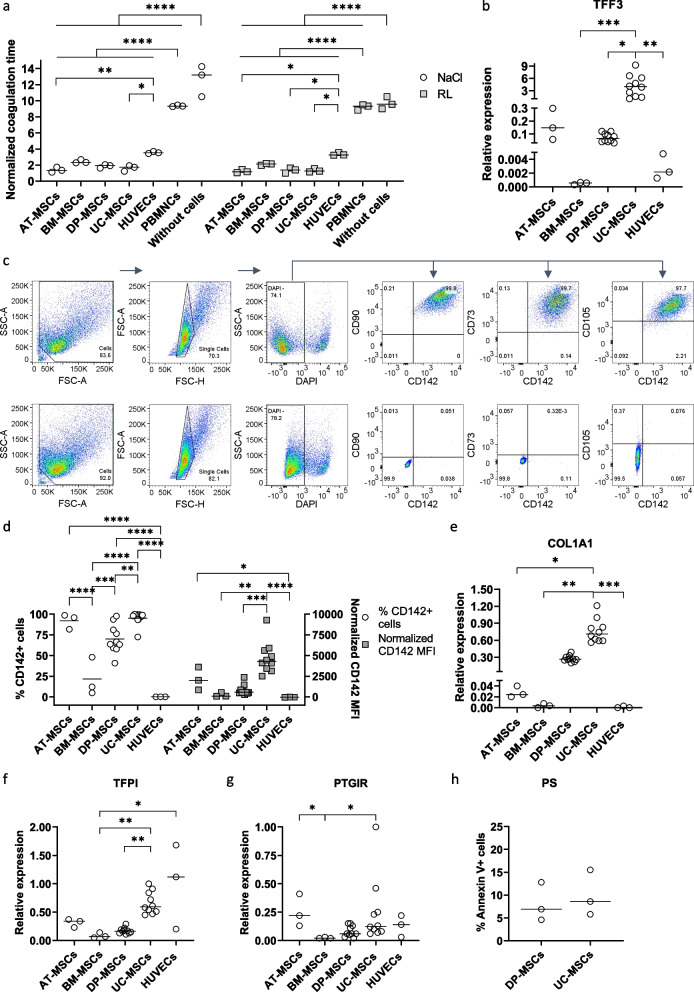
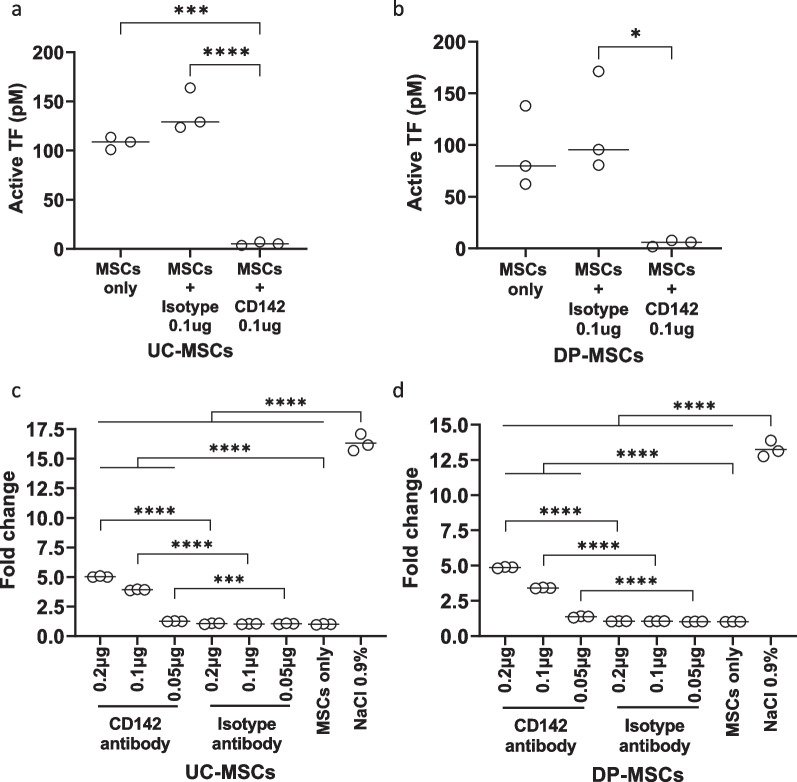
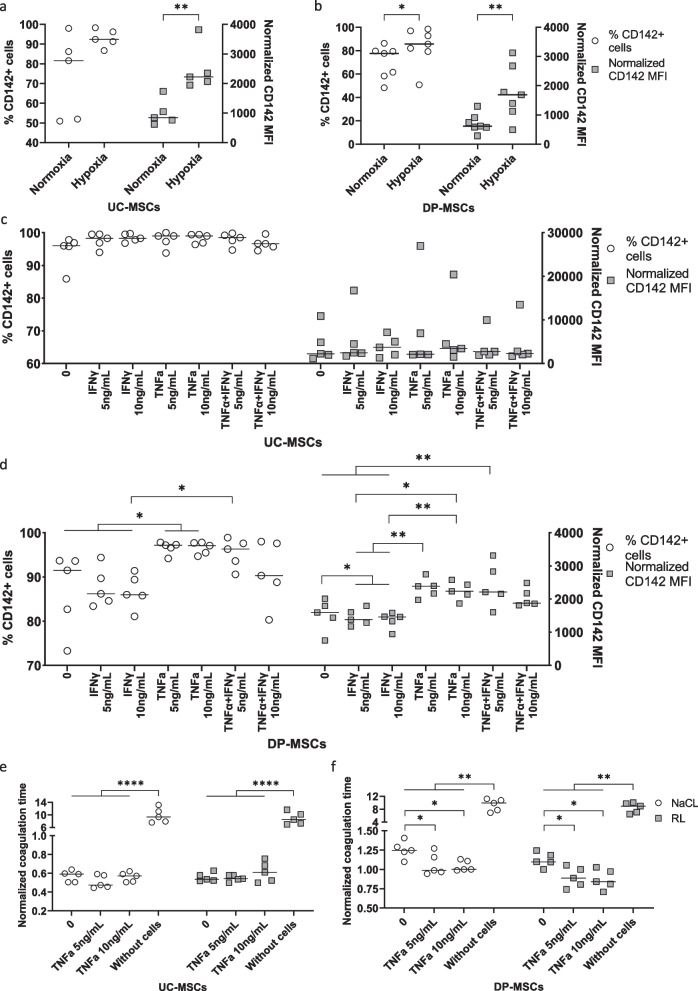
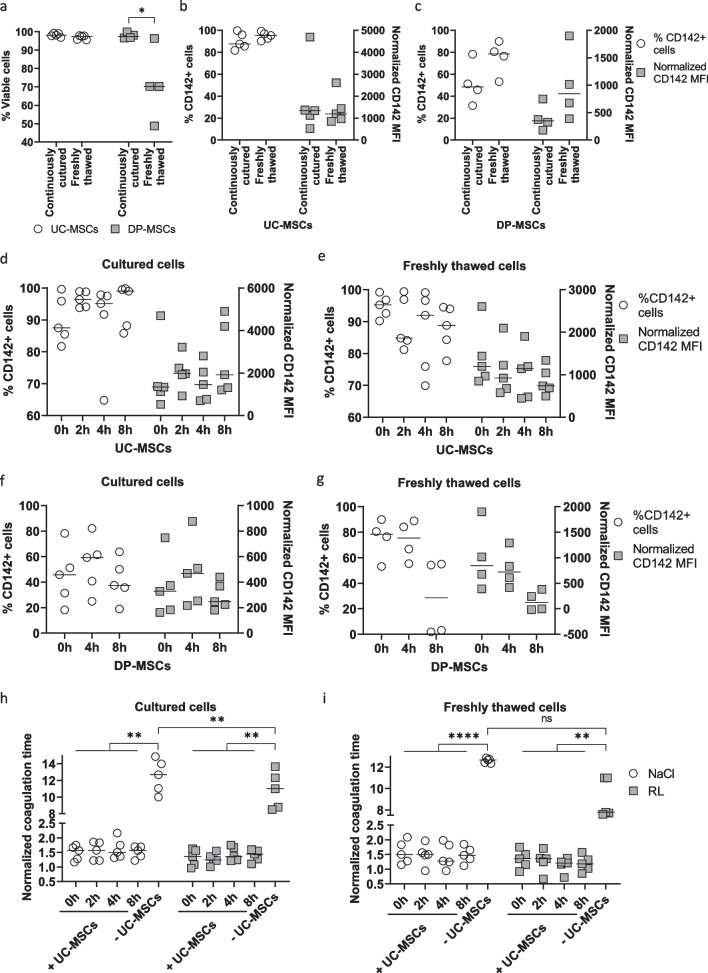
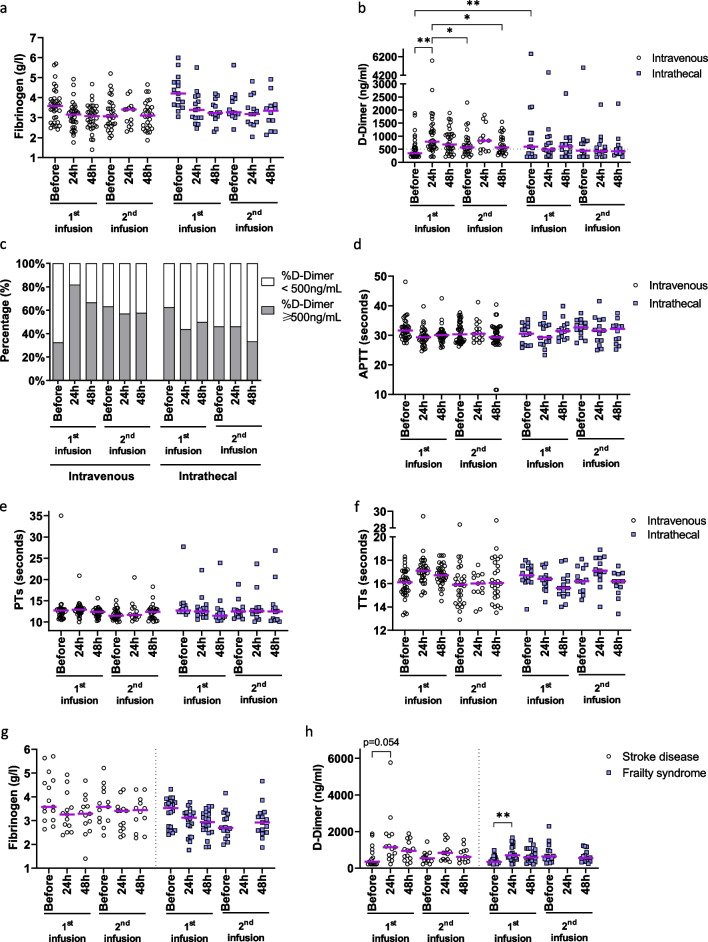
Methods: The expression of TF and other pro- and anticoagulant genes was analyzed in xeno- and serum-free manufactured MSCs. Furthermore, culture factors affecting its expression in MSCs were investigated. Finally, coagulation tests of fibrinogen, D-dimer, aPPTs, PTs, and TTs were measured in patient serum after umbilical cord (UC)-MSC infusions to challenge a potential connection between TF expression and MSC-induced coagulant activity. RESULTS: Xeno- and serum-free cultured adipose tissue and UC-derived MSCs expressed the highest level of TF, followed by those from dental pulp, and the lowest expression was observed in MSCs of bone marrow origin. Environmental factors such as cell density, hypoxia, and inflammation impact TF expression, so in vitro analysis might fail to reflect their in vivo behaviors. MSCs also expressed heterogeneous levels of the coagulant factor COL1A1 and surface phosphatidylserine and anticoagulant factors TFPI and PTGIR. MSCs of diverse origins induced fibrin clots in healthy plasma that were partially suppressed by an anti-TF inhibitory monoclonal antibody. Furthermore, human umbilical vein endothelial cells exhibited coagulant activity in vitro despite their negative expression of TF and COL1A1. Patients receiving intravenous UC-MSC infusion exhibited a transient increase in D-dimer serum concentration, while this remained stable in the group with intrathecal infusion. There was no correlation between TF expression and D-dimer or other coagulation indicators.

Conclusions: The study suggests that TF cannot be used as a solid biomarker to predict MSC-induced hypercoagulation. Local administration, prophylactic intervention with anticoagulation drugs, and monitoring of coagulation indicators are useful to prevent thrombogenic events in patients receiving MSCs. Trial registration NCT05292625. Registered March 23, 2022, retrospectively registered, https://www.

Clinicaltrials: gov/ct2/show/NCT05292625?term=NCT05292625&draw=2&rank=1 . NCT04919135. Registered June 9, 2021, https://www.

Clinicaltrials: gov/ct2/show/NCT04919135?term=NCT04919135&draw=2&rank=1 .

Keywords: Cell therapy; Coagulation; Mesenchymal stem cell; Mesenchymal stromal cell; Thrombosis; Tissue factor; Umbilical cord.


Conflict of interest statement

V.T.H., D.M.H., T.K.N., P.T.K. T, L.A.T.N., T.L.N., B.V.A., and L.N.T. are employed by the not-for-profit Vinmec Health Care System.

Figures

Fig. 1
Fig. 1
Coagulant activity of xeno- and serum-cultured MSCs and their expression of pro- and anticoagulant factors. a MSCs derived from AT, BM, DP, and UC as well as HUVECs and PBMNCs (n = 3 each) were prepared in NaCl and RL and supplemented with plasma from healthy donors (n = 6) and CaCl2 to measure the time required to form fibrin clots. MSCs exhibited the highest coagulant activity, followed by HUVECs, PBMNCs and the negative control without cells. b Gene expression analysis of TF revealed the highest expression in UC-MSCs, moderate levels in AT- and DP-MSCs, and low expression in BM-MSCs and HUVECs (UC- and DP-MSCs: n = 10 and other cell types: n = 3). c, d TF protein expression was analyzed by flow cytometry. A representative sample of UC-MSCs demonstrated coexpression of TF/CD142 and MSC-positive markers, including CD90, CD73, and CD105 (c). The frequency of TF+ cells and CD142 MFI were analyzed, showing a high level of this factor in UC- and AT-MSCs, lower levels in DP- and BM-MSCs, and negative expression in HUVECs (d). eg Gene expression was analyzed for the procoagulant factor COL1A1 and the anticoagulant factors TFPI and PTGIR. UC-MSCs expressed significantly higher COL1A1 than AT- and BM-MSCs and HUVECs (e). In terms of the anticoagulant factors TFPI (f) and PTGIR (g), UC- and AT-MSCs and HUVECs displayed higher expression than DP- and BM-MSCs. h The exposure of the negatively charged phosphatidylserine (PS) in the outer membrane of UC- and DP-MSCs was analyzed using an anti-Annexin V antibody. A subset of UC- and DP-MSCs in culture (continuously cultured cells) were positive for Annexin V
Fig. 2
Fig. 2
Impact of TF inhibition on the coagulant activity of UC- and DP-MSCs. a and b UC-MSCs (a) and DP-MSCs (b) were incubated with an anti-TF inhibitory monoclonal antibody (clone HTF-1) or an isotype control antibody (clone MOPC-21) and analyzed using a colorimetric FXa quantification assay. The HTF-1 antibody was capable of suppressing active TF. c and d The coagulant activity of UC-MSCs (c) and DP-MSCs (d) was significantly reduced in the presence of the HTF-1 antibody compared to the isotype control, but it was higher than that of the NaCl negative control samples
Fig. 3
Fig. 3
Impact of culture passage on TF expression in UC- and DP-MSCs. a The growth ability of UC-MSCs was analyzed over passages from P3 to P10. Their PDT increased after P8. b Cell cycle profile of a representative sample depicting a G1 population, a proliferating S/G2/M population, and an apoptotic sub G1 population. c, d Analysis of five UC-MSC samples indicated decreased proliferation at P10 compared to P4 (c) and an increased apoptotic cell frequency at P10 compared to the earlier passages (d). e TF expression remained stable in the analyzed passages as indicated by flow cytometry. fg Gene expression of the procoagulant factors TFF3 and COL1A1 (f) and the anticoagulant factors TFPI and PTGIR (g) was comparable in UC-MSCs over passages, except PTGIR tended to be decreased at higher passages compared to those in P2. h The PDT was analyzed for DP-MSCs, which demonstrated a lower growth rate at P7 and P8. i DP-MSCs tended to express a lower level of TF at higher passages. j, k Gene expression analysis of the procoagulant factors TFF3 and COL1A1 (j) and the anticoagulant factors TFPI and PTGIR (k) in DP-MSCs suggested comparable levels of these genes from P2 to P8
Fig. 4
Fig. 4
Impact of cell density on TF expression in UC- and DP-MSCs. a The cell morphology of UC-MSCs seeded at different densities is depicted. b The cell densities represent confluency between 8 ± 1.71 and 91.5 ± 5.05. c TF expression decreased when UC-MSCs became confluent. d–e Similar to UC-MSCs, cells derived from DP-MSCs were observed from 9.5 ± 1.61 to 85 ± 3.60 confluency (d), and TF expression was lower in confluent cells (e). f Despite their lower TF level, DP-MSCs at higher cell density increased their coagulant activity
Fig. 5
Fig. 5
Impact of environmental factors on TF expression in UC- and DP-MSCs. a, b Culture of UC-MSCs (a) and DP-MSCs (b) in 2% oxygen conditions (hypoxia) upregulated TF expression compared to an ambient oxygen concentration of 21% (normoxia). c The inflammatory cytokines IFNγ and TNFα did not change TF levels in UC-MSCs. d On the other hand, TF levels were enhanced in DP-MSCs in the presence of TNFα but not IFNγ. e The coagulant activity of UC-MSCs did not change upon TNFα treatment. f The coagulant activity of DP-MSCs was higher upon TNFα treatment
Fig. 6
Fig. 6
Impact of cell product preparation and storage on TF expression in UC- and DP-MSCs. ac Both continuously cultured and cryopreserved/freshly thawed MSCs can be used for therapeutic purposes. Cell viability (a) and TF expression (b, c) were analyzed by flow cytometry. UC-MSCs (b) and DP-MSCs (c) under both conditions showed similar TF levels. d–g  The TF expression of continuously cultured and freshly thawed UC-MSCs (d and e, respectively) and DP-MSCs (f and g, respectively) was observed for up to 8 h of storage in NaCl. While TF was preserved on UC-MSCs of both conditions and continuously cultured DP-MSCs over the 8-h observation period, freshly thawed DP-MSCs tended to reduce its expression after eight hours. h, i The coagulation activity of continuously cultured (h) and cryopreserved/freshly thawed UC-MSCs (i) remained unchanged during an 8-h storage period
Fig. 7
Fig. 7
Coagulation induced by UC-MSCs upon administration in patients. a Patients were infused twice with UC-MSCs via intravenous or intrathecal routes. The fibrinogen concentration in blood was recorded at baseline and 24 and 48 h after the intervention. The fibrinogen level was comparable between the different analyzed time points. b D-dimer increased after 24 h and decreased again after 48 h in patients with systemic cell administration, while no significant change was observed in the intrathecal group. c Patients were classified into two groups with normal (< 500 ng/ml) and elevated D-dimer levels (≥ 500 ng/ml). Compared to the baseline, the numbers of intravenously injected patients with elevated D-dimer increased at 24 h and decreased again at 48 h after the first cell infusion, but this effect was not observed at the second cell infusion after 3 months. In the intrathecal group, the proportion of patients with elevated D-dimer remained comparable or even lower after both cell infusions. df There were no significant changes in aPPTs (d), PTs (e), or TTs (f) between the analyzed time points. g, h Patients receiving intravenous UC-MSCs were classified according to their background, including stroke and frailty syndromes. The fibrinogen (g) and D-dimer (h) concentrations of both groups showed similar tendencies
Fig. 8
Fig. 8
Correlation between TF expression and D-dimer levels in patients after UC-MSC administration. a TF expression was analyzed in 30 different UC-MSC batches. b-d. D-dimer levels in patient serum before cell therapy (b) and at 24 h (c) and 48 h (d) after the first UC-MSC infusion showed no correlation with the frequency of TF-expressing cells. eg Fibrinogen levels in patient serum were comparable between the indicated analyzed time points. h Next, PT tests of patient serum were examined in the presence of UC-MSCs, showing a normal range of PT. Furthermore, the PT values were independent of TF expression on UC-MSCs. I The plot depicts the extrinsic (yellow box), intrinsic (blue box), and common (green box) coagulation cascades. TF, the initiator of the extrinsic pathway, is activated during blood vessel damage or in the presence of external factors such as bacterial endotoxin, inflammatory cytokines, and thrombin. During the initiation phase of coagulation, procoagulant factors such as TF, collagen, von Willebrand factor (vWF), laminin, vitronectin, and high molecular weight kininogen (HMWK) in subendothelial tissues are exposed to platelets and circulating coagulant factors FVII, FVIII, FIX, FX, etc. An extrinsic coagulation cascade is intermediately initiated. TF is decrypted, leading to proteolytic activation of its ligands FVII and FX into FVIIa and FXa. FXa cleaves prothrombin in thrombin. Thrombin proteolyzes fibrinogen into fibrin to form clots. Thrombin further activates platelets, FVa, and FVIIIa via a positive feedback loop to propagate the coagulation cascade. When clots are dissolved in the body, fibrin is broken into small protein fragments known as D-dimers. Genetic downregulation or pharmacological inhibition of TF could reduce TF-induced extrinsic coagulation. On the other hand, the data suggest that other coagulant factors are also involved in this process upon UC-MSC administration. Therefore, prophylactic treatment with anticoagulant drugs such as heparin is of benefit, as the drug also targets the common coagulant pathway. Furthermore, local administration might reduce the risk of thrombogenic events compared to systemic infusion

Similar articles

Cited by

References

    1. Marquez-Curtis LA, Janowska-Wieczorek A, McGann LE, Elliott JAW. Mesenchymal stromal cells derived from various tissues: biological, clinical and cryopreservation aspects. Cryobiology. 2015;71(2):181–197. doi: 10.1016/j.cryobiol.2015.07.003. - DOI - PubMed
    1. Gao F, Chiu SM, Motan DAL, Zhang Z, Chen L, Ji HL, et al. Mesenchymal stem cells and immunomodulation: current status and future prospects. Cell Death Dis. 2016;7(1):e2062–e2062. doi: 10.1038/cddis.2015.327. - DOI - PMC - PubMed
    1. Jin H, Bae Y, Kim M, Kwon SJ, Jeon H, Choi S, et al. Comparative analysis of human mesenchymal stem cells from bone marrow, adipose tissue, and umbilical cord blood as sources of cell therapy. IJMS. 2013;14(9):17986–18001. doi: 10.3390/ijms140917986. - DOI - PMC - PubMed
    1. Pittenger MF, Discher DE, Péault BM, Phinney DG, Hare JM, Caplan AI. Mesenchymal stem cell perspective: cell biology to clinical progress. NPJ Regen Med. 2019;4(1):22. doi: 10.1038/s41536-019-0083-6. - DOI - PMC - PubMed
    1. Jovic D, Yu Y, Wang D, Wang K, Li H, Xu F, et al. A brief overview of global trends in MSC-based cell therapy. Stem Cell Rev Rep. 2022;18(5):1525–1545. doi: 10.1007/s12015-022-10369-1. - DOI - PMC - PubMed

Publication types

Associated data