

Genomic insight into the origin, domestication, dispersal, diversification and human selection of Tartary buckwheat
- PMID: 38414075
- PMCID: PMC10898187
- DOI: 10.1186/s13059-024-03203-z
Genomic insight into the origin, domestication, dispersal, diversification and human selection of Tartary buckwheat
Abstract
Background: Tartary buckwheat, Fagopyrum tataricum, is a pseudocereal crop with worldwide distribution and high nutritional value. However, the origin and domestication history of this crop remain to be elucidated.
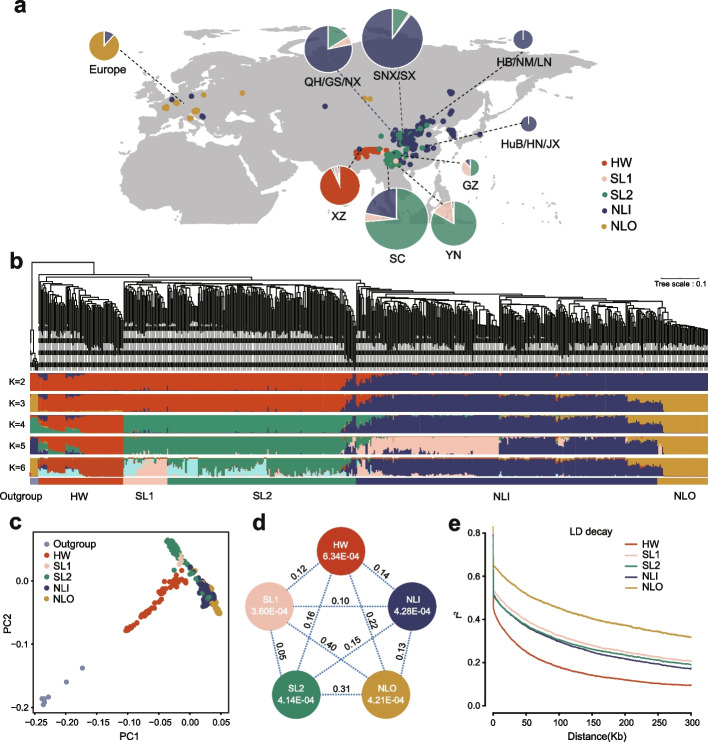
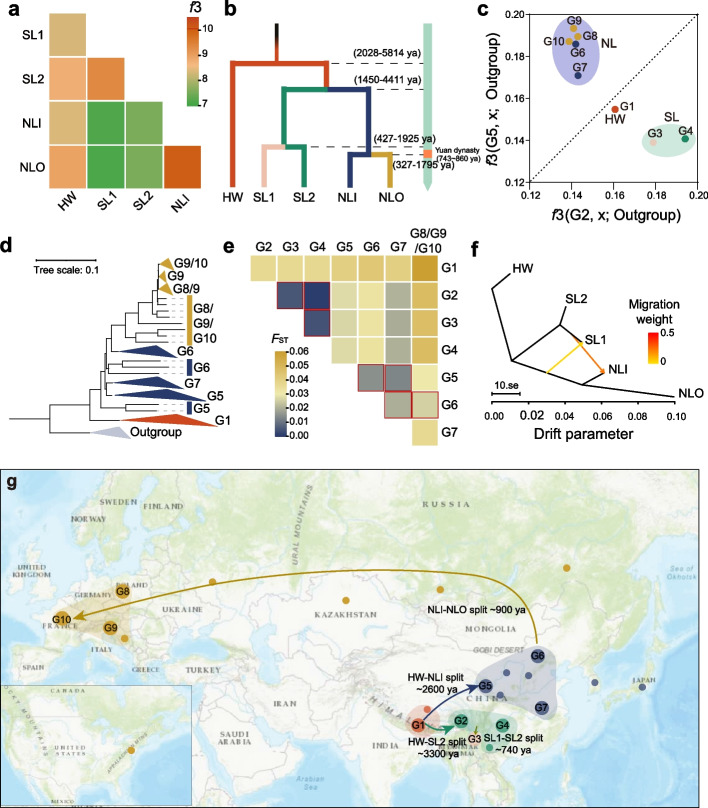
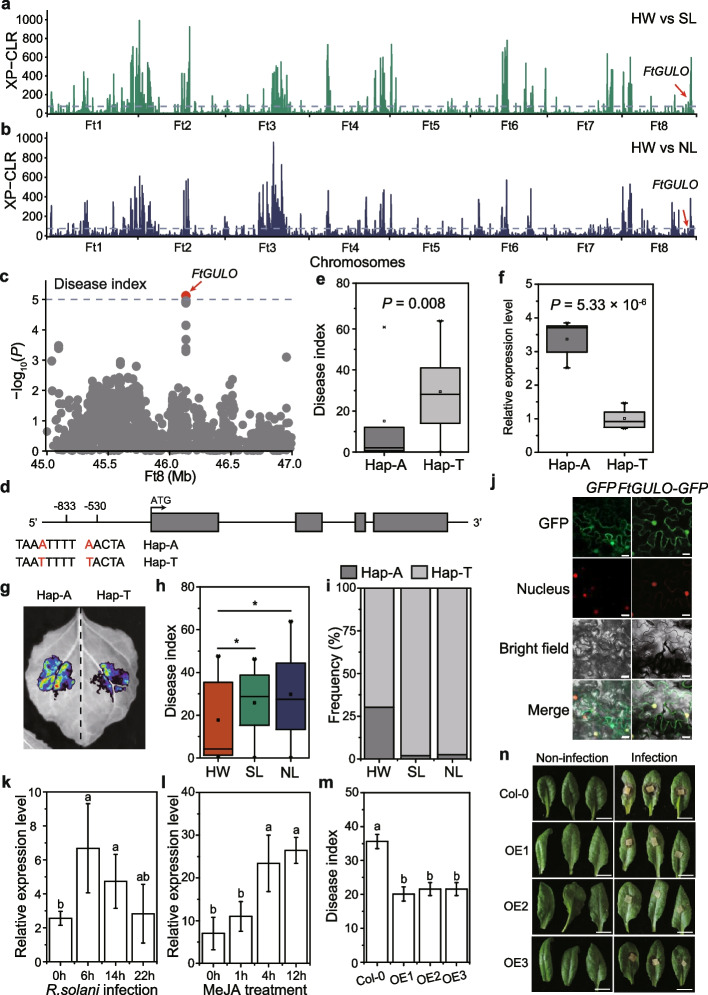
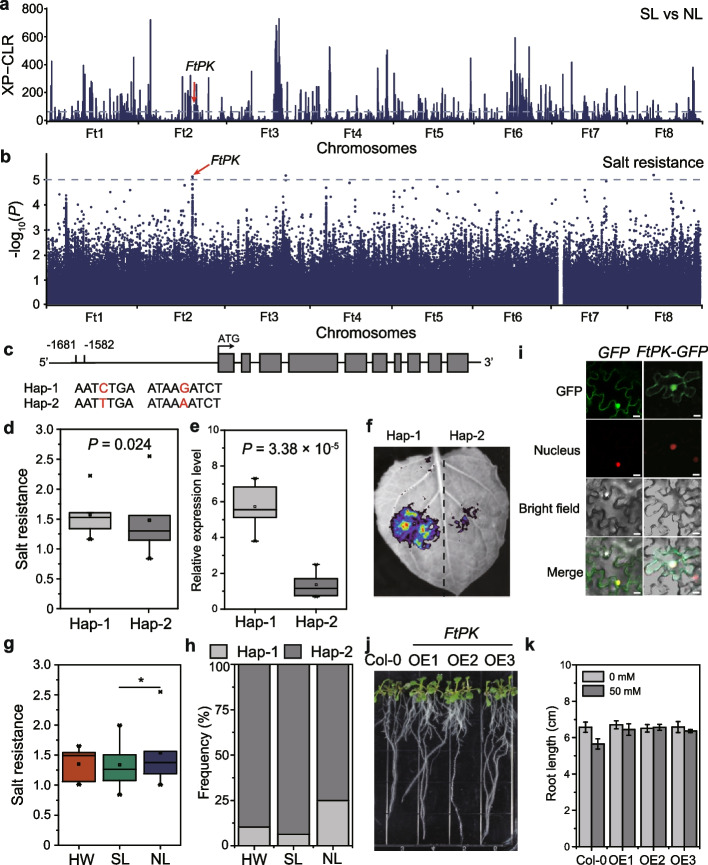
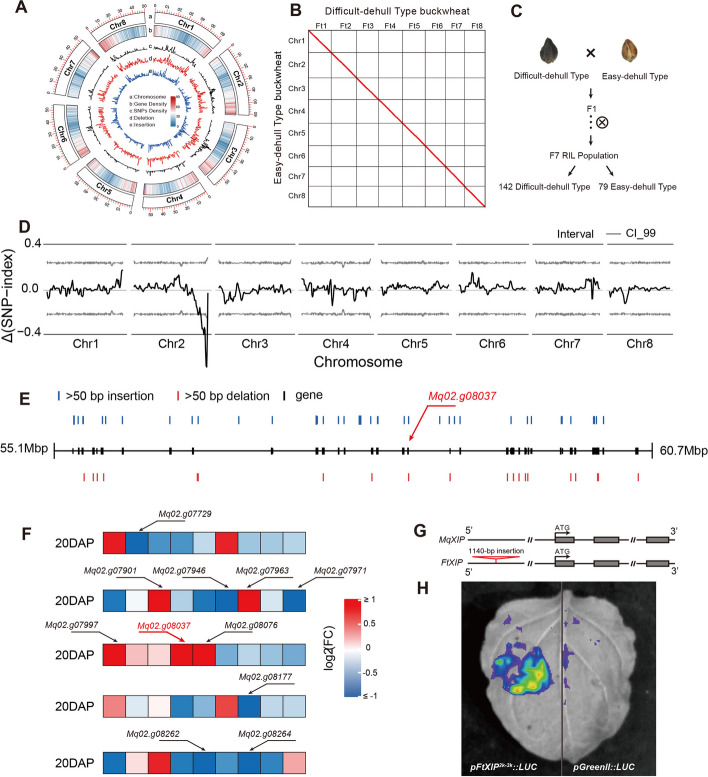
Results: Here, by analyzing the population genomics of 567 accessions collected worldwide and reviewing historical documents, we find that Tartary buckwheat originated in the Himalayan region and then spread southwest possibly along with the migration of the Yi people, a minority in Southwestern China that has a long history of planting Tartary buckwheat. Along with the expansion of the Mongol Empire, Tartary buckwheat dispersed to Europe and ultimately to the rest of the world. The different natural growth environments resulted in adaptation, especially significant differences in salt tolerance between northern and southern Chinese Tartary buckwheat populations. By scanning for selective sweeps and using a genome-wide association study, we identify genes responsible for Tartary buckwheat domestication and differentiation, which we then experimentally validate. Comparative genomics and QTL analysis further shed light on the genetic foundation of the easily dehulled trait in a particular variety that was artificially selected by the Wa people, a minority group in Southwestern China known for cultivating Tartary buckwheat specifically for steaming as a staple food to prevent lysine deficiency.
Conclusions: This study provides both comprehensive insights into the origin and domestication of, and a foundation for molecular breeding for, Tartary buckwheat.
Keywords: Artificial selection; Buckwheat; Domestication; Genomics; Migration.
© 2024. The Author(s).
Conflict of interest statement
The authors declare that they have no competing interests.
Figures
Similar articles
-
Resequencing of global Tartary buckwheat accessions reveals multiple domestication events and key loci associated with agronomic traits.Genome Biol. 2021 Jan 12;22(1):23. doi: 10.1186/s13059-020-02217-7. Genome Biol. 2021. PMID: 33430931 Free PMC article.
-
Basic helix-loop-helix (bHLH) gene family in Tartary buckwheat (Fagopyrum tataricum): Genome-wide identification, phylogeny, evolutionary expansion and expression analyses.Int J Biol Macromol. 2020 Jul 15;155:1478-1490. doi: 10.1016/j.ijbiomac.2019.11.126. Epub 2019 Nov 15. Int J Biol Macromol. 2020. PMID: 31734362
-
Genome-wide identification of the SPL gene family in Tartary Buckwheat (Fagopyrum tataricum) and expression analysis during fruit development stages.BMC Plant Biol. 2019 Jul 8;19(1):299. doi: 10.1186/s12870-019-1916-6. BMC Plant Biol. 2019. PMID: 31286919 Free PMC article.
-
Deep sequencing of the transcriptome reveals distinct flavonoid metabolism features of black tartary buckwheat (Fagopyrum tataricum Garetn.).Prog Biophys Mol Biol. 2017 Mar;124:49-60. doi: 10.1016/j.pbiomolbio.2016.11.003. Epub 2016 Nov 9. Prog Biophys Mol Biol. 2017. PMID: 27836511 Review.
-
Tartary Buckwheat Grain as a Source of Bioactive Compounds in Husked Groats.Plants (Basel). 2023 Mar 2;12(5):1122. doi: 10.3390/plants12051122. Plants (Basel). 2023. PMID: 36903982 Free PMC article. Review.
Cited by
-
Identification of the Granule-Bound Starch Synthase (GBSS) Genes Involved in Amylose Biosynthesis in Tartary Buckwheat (Fagopyrum tataricum (L.) Gaertn.).Plants (Basel). 2025 Jan 13;14(2):203. doi: 10.3390/plants14020203. Plants (Basel). 2025. PMID: 39861555 Free PMC article.
-
Genome-Wide Association Studies Reveal the Genetic Architecture of Ionomic Variation in Grains of Tartary Buckwheat.Adv Sci (Weinh). 2025 May;12(17):e2412291. doi: 10.1002/advs.202412291. Epub 2025 Mar 13. Adv Sci (Weinh). 2025. PMID: 40079224 Free PMC article.
-
Ethnobotanical studies on rice landraces under on-farm conservation in Xishuangbanna of Yunnan Province, China.J Ethnobiol Ethnomed. 2024 Apr 29;20(1):45. doi: 10.1186/s13002-024-00683-y. J Ethnobiol Ethnomed. 2024. PMID: 38685098 Free PMC article.
-
Genetic Diversity Analysis and Core Germplasm Collection Construction of Tartary Buckwheat Based on SSR Markers.Plants (Basel). 2025 Mar 3;14(5):771. doi: 10.3390/plants14050771. Plants (Basel). 2025. PMID: 40094709 Free PMC article.
-
Integrative Dissection of Lignin Composition in Tartary Buckwheat Seed Hulls for Enhanced Dehulling Efficiency.Adv Sci (Weinh). 2024 May;11(20):e2400916. doi: 10.1002/advs.202400916. Epub 2024 Mar 23. Adv Sci (Weinh). 2024. PMID: 38520733 Free PMC article.
References
-
- Liu X, Li L, Li Y, et al. Synergistic evolution theory of crop germplasm resources and cultural environments. In Chinese. J Plant Genet Resour. 2022;23:1–11.
-
- Chen YH, Gols R, Benrey B. Crop domestication and its impact on naturally selected trophic interactions. Annu Rev Entomol. 2015;60:35–58. - PubMed
-
- Huang X, Huang S, Han B, Li J. The integrated genomics of crop domestication and breeding. Cell. 2022;185:2828–2839. - PubMed
-
- Wang Z, Miao L, Chen Y, Peng H, Ni Z, Sun Q, Guo W. Deciphering the evolution and complexity of wheat germplasm from a genomic perspective. J Genet Genomics. 2023;50:846–860. - PubMed
Publication types
MeSH terms
Grants and funding
- 2023YFF1002500/National Key R&D Program of China
- 32161143005/National Natural Science Foundation of China
- Y2022QC02/the Youth Innovation Program of Chinese Academy of Agricultural Sciences
- P4-0077/Slovenian Research and Innovation Agency program: Genetics and Modern Technologies of Crops
- P1-0212/Slovenian Research and Innovation Agency program: Genetics and Modern Technologies of Crops
LinkOut - more resources
Full Text Sources
