. 2024 Apr 2;123(7):824-838.
doi: 10.1016/j.bpj.2024.02.021. Epub 2024 Feb 28.

Real-time single-molecule imaging of CaMKII-calmodulin interactions

Affiliations

Real-time single-molecule imaging of CaMKII-calmodulin interactions

Shahid Khan et al. Biophys J. .

Abstract

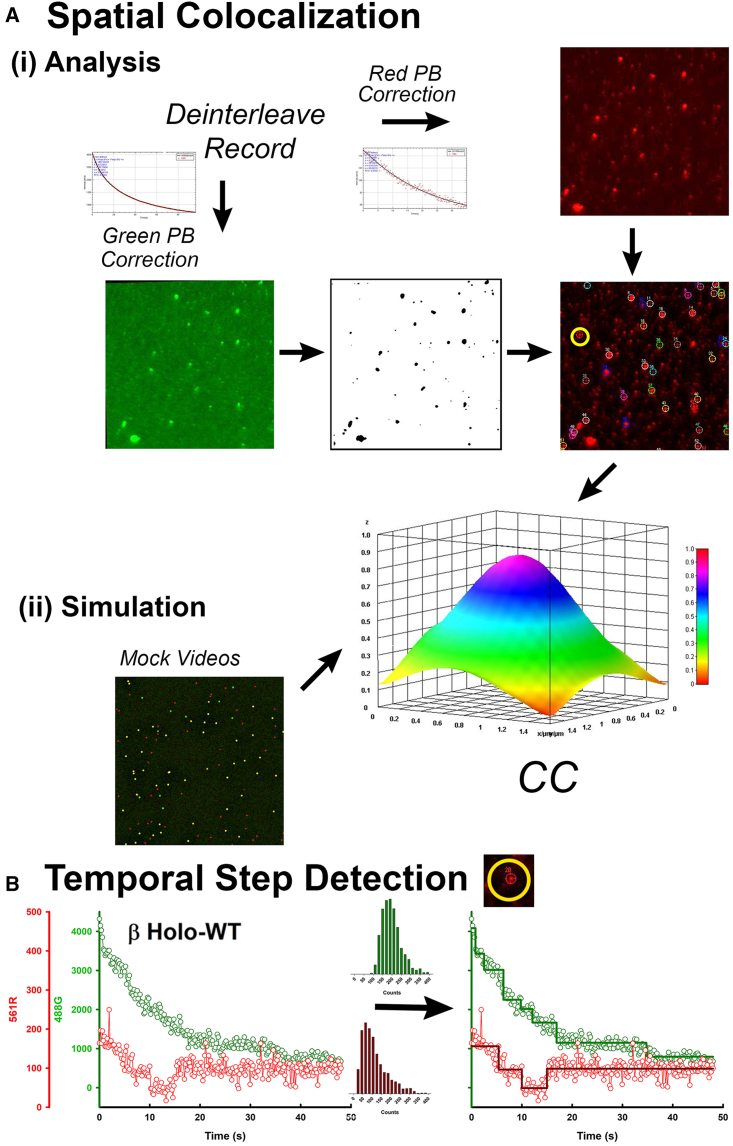
The binding of calcium/calmodulin (CAM) to calcium/calmodulin-dependent protein kinase II (CaMKII) initiates an ATP-driven cascade that triggers CaMKII autophosphorylation. The autophosphorylation in turn increases the CaMKII affinity for CAM. Here, we studied the ATP dependence of CAM association with the actin-binding CaMKIIβ isoform using single-molecule total internal reflection fluorescence microscopy. Rhodamine-CAM associations/dissociations to surface-immobilized Venus-CaMKIIβ were resolved with 0.5 s resolution from video records, batch-processed with a custom algorithm. CAM occupancy was determined simultaneously with spot-photobleaching measurement of CaMKII holoenzyme stoichiometry. We show the ATP-dependent increase of the CAM association requires dimer formation for both the α and β isoforms. The study of mutant β holoenzymes revealed that the ATP-dependent increase in CAM affinity results in two distinct states. The phosphorylation-defective (T287.306-307A) holoenzyme resides only in the low-affinity state. CAM association is further reduced in the T287A holoenzyme relative to T287.306-307A. In the absence of ATP, the affinity of CAM for the T287.306-307A mutant and the wild-type monomer are comparable. The affinity of the ATP-binding impaired (K43R) mutant is even weaker. In ATP, the K43R holoenzyme resides in the low-affinity state. The phosphomimetic mutant (T287D) resides only in a 1000-fold higher-affinity state, with mean CAM occupancy of more than half of the 14-mer holoenzyme stoichiometry in picomolar CAM. ATP promotes T287D holoenzyme disassembly but does not elevate CAM occupancy. Single Poisson distributions characterized the ATP-dependent CAM occupancy of mutant holoenzymes. In contrast, the CAM occupancy of the wild-type population had a two-state distribution with both low- and high-affinity states represented. The low-affinity state was the dominant state, a result different from published in vitro assays. Differences in assay conditions can alter the balance between activating and inhibitory autophosphorylation. Bound ATP could be sufficient for CaMKII structural function, while antagonistic autophosphorylations may tune CaMKII kinase-regulated action-potential frequency decoding in vivo.


Conflict of interest statement

Declaration of interests The authors declare no competing interests.

Figures

Figure 1
Figure 1
CaMKII architecture and dynamics. (A) CaMKII subunit. The N-terminal canonical KD and the C-terminal AD are connected via a flexible linker whose length and composition vary between isoforms and their splice variants. Residue substitutions at the KD K43, T287, T306.T307 (β isoform residue positions) are examined in this study. K → R residue substitution at K43 (open circle) disrupts the ATP binding site (diamond). The regulatory autoinhibition segment (R) binds CAM (red circle) and contains the activating (T287, open circle) and inhibitory (T306.T307, closed circles) autophosphorylation sites. T → A residue substitutions silence autophosphorylation, while T → D substitutions mimic it. (B) CaMKII holoenzyme (dodecamer). The AD forms a central 2-stack hub with mirror symmetry. The peripheral KDs from the two stacks are predominantly paired. The AD residue substitutions βF458A, αF394A destabilize lateral hub contacts. (C) CaMKII conformational states. R conformational heterogeneity reported by ESR for the monomeric KD consists of at least three states; a docked state (C1) and unstructured C2), or α-helical, CAM-bound (C3) undocked states (23). Dimer formation pairs catalytic KDs, as seen by Homo-FRET (C4) (54). Experiments with R peptides show T287 transphosphorylation (green circle) accesses a higher affinity (depicted as large red circle) “trapped” CAM state (C5). Catalytic pairs are maintained in dimers or holoenzymes in the presence of CAM or phosphorylated T287 (17). To see this figure in color, go online.
Figure 2
Figure 2
(A) Workstation. The workstation recorded dual color fluorescence emission from alternate excitation by two lasers that was filtered and imaged by two cameras. The lasers (blue, 488 nm [laser 1]; olive, 561 nm [laser 2]) (Lighthub-6, Omicron, Rodgau-Dudenhofen, Germany) and cameras (iXON-3, EMCCD, Andor, Belfast, Northern Ireland) are computer controlled. The filter cube had green (525 ± 50 nm) and red (593 ± 40 nm) barrier filters with dichroic (Di02-R561) (Semrock, Laser2000, Huntingdon, Cambridgeshire, UK). Cameras 1 and 2 were designated green and red, respectively, based on the associated barrier filters. The specimen was illuminated by an Olympus TIRF UPLAPO100xOHR, 1.5NA objective lens (Olympus, Southend-on-Sea, Essex, UK). The custom-built autofocus mechanism used a position-sensitive photodiode to measure the deflection of the returning, reflected laser beam (PSD S1352, Hamamatsu Photonics, Welwyn Garden City, Hertfordshire, UK). The field of view and total internal reflection angle were set by manual adjustment of a custom beam expander, field diaphragm, and kinematic mirror, which for clarity are shown as a single adjustable mirror. All components were assembled on a custom-built frame (Thorlabs, Ely, Cambridgeshire, UK). (B) TIRFM Assay. The microscope flow cell, consisting of two coverslips, held together by parallel strips of double-sided adhesive tape, was mounted on a three-axis piezo stage (XYZ-SLC17:22 with MCS-3c, SmartAct, Oldenburg, Germany). One surface was sparsely coated with GFP antibody and then blocked with BSA. V-CaMKII incubation was optimized to minimize overlap of the point spread functions with mean separation of the bound V-CaMKII >2 mm. The centroid of the bound molecules was one-quarter of the decay distance of the exponential field. The CAM binding motif is located on the R segment 7 ± 2 nm away from the nearest and 22 nm away from the furthest Venus fluorophores in the holoenzyme. To see this figure in color, go online.
Figure 3
Figure 3
(A) Spatial cross correlation. (i) Analysis.: alternate laser excitation separated red and green fluorophore emissions and FRET between green and red fluorophores. Rhodamine emission (r-CAM) was measured by the “red” camera during 561 nm laser excitation. Venus emission (V-CaMKII) was measured by the “green” camera during 488 nm laser excitation. Cross correlation “CC” between the Venus and rhodamine channels was computed for a moving 9 × 9 pixel2 region. PB, photobleaching. (ii) Simulation: mock vidoes were processed similarly. (B) Temporal step detection. Left panel: colocalized rhodamine (CAM, red circles) and Venus (CaMKII, green circles) intensity versus time data from a single spot ROI (yellow circle in Ai). Right panel: the fits to the Venus and rhodamine channels to a stepwise fluctuation model. The trajectories were filtered using a three-frame running average. The immobilized V-CaMKII shows a monotonic intensity decay due to photobleaching, whereas the r-CAM trajectory shows step increases and decreases. Characterization of an intensity change as a step event was based on the mean (±SD) values for the intensity distributions shown for the monomeric-tagged KD (green) and the nonspecifically attached r-CAM (red). To see this figure in color, go online.
Figure 4
Figure 4
Schematic. An idealized rhodamine channel “red” record with stepwise r-CAM associations/dissociations from an immobilized V-CaMKII (“green”) dimer spot. The schematic illustrates how fON,fOFF frequencies and kτ rates were computed. (A) The fON,fOFF frequencies were obtained from the number of up and down step events, respectively. (B) The kτ values were obtained from single or double exponential fits to the residence time (τ) distribution over all nonzero occupancy levels. Nτ = number of intervals per |t| value. The kτ(=kτ1forbiexponentialdecay) could be compared with, or corrected for, the photobleaching rate (kPB) and amplitude (APB). kτcorr denotes kτ corrected for the photobleaching decay. The records for the monomer and dimer assemblies were not corrected. To see this figure in color, go online.
Figure 5
Figure 5
Association and dissociation kinetics of native assemblies. (A) Histograms. Residence times (τ) over the −30 to +30 s range (2 mM ATP). For each species, 20–30 spots were selected at random from >2 different records from separate experiments. The step population (Σn) = 175 (β monomer), 555 (α dimer), and 226 (β holoenzyme). Record duration = 40 s. (B) Residence time (|τ|) distributions. (i) The β monomer distributions. Single exponential fit (short dashed line). Monomer r-CAM photobleaching (PB) curve (red line). (ii) The α dimer, β dimer, and β holoenzyme (t) distributions. Double exponential fit (α dimer, black dashed line). Single exponential fit (β holoenzyme, red dashed line). The PB curve and β monomer fit are as in (i). (C) Rates. (i) Mean (fON) and (kτ) at 300 nM r-CAM for the β monomer (+/− ATP) and α dimer. (ii) Mean (fON) and (kτ) at 30 nM r-CAM for the α dimer, β dimer, and β holoenzyme. fON (clear), kτ (brick). (D) The r-CAM occupancy distribution (30 nM r-CAM) for the β holoenzyme. Single exponential fit (red dashed line). Inset: the means of the V-CaMKII subunit stoichiometry (SCaMKII) distributions obtained from PB analysis were 10 ± 2 and 10.5 + 1.5 s for zero (0) and nonzero (>0) subpopulations, respectively. The F-test probability, PFtest=0.0035, indicated unequal variance. The t-test probability with the unequal variance option, Pttest=0.085 did not show a significant difference between the mean values. To see this figure in color, go online.
Figure 6
Figure 6
r-CAM association with mutant β holoenzymes. (A) r-CAM concentration dependence. (i) r-CaM occupancy (NCAM) distributions for the T287A, T287.306.307A, and K43R silencing (inactive) holoenzymes (left). The T287D constitutively active holoenzyme with (+) and without (−) 2 mM ATP (right). Poisson fits (solid lines) are color coded to match the sample. (ii) NCAM¯ values for the inactive holoenzymes compared with the WT β holoenzyme (left). ATP dependence of the T287D NCAM¯ values (right). (iii) Holoenzyme subunit stoichiometries (SCaMKII) determined by step photobleaching. (B) Histograms. CaMKII mutant residence time (τ) distributions over the −30 to +30 s range. Based on the ransom selection of >50–100< spots (2 or more experiments, >3 records/experiment). Record duration = 40 s. The step population size (Σn) = 105 (β-T287A), 286 (β-K43R), 409 (β-T287.306-307A), 183 (β-T287D [+ATP]), 933 (β-T287D [−ATP]). (C) FRET. All holoenzyme samples. Each data point was based on 10–20 video records/experiment (30–50 holoenzyme spots/record). There is a linear (mean [red line], 95% confidence limits [gray lines]) increase in the FRET signal (CCR-FRET) with increased colocalization (CCG-R). The regression coefficient = 0.93. To see this figure in color, go online.
Figure 7
Figure 7
r-CAM association/dissociations for mutant β holoenzymes (−/+ATP). (A) 0 mM ATP. (i) Residence time |(τ)| distributions. K43R exponential fit (blue dashed line). (ii) fON and kτ rates. The asterisk indicates biexponential fit. The first exponential (kτ1 = 3.18 s−1) is not shown. (B) 2 mM ATP. (i) Residence time |(τ)| distributions. (ii) fON and kτ rates. Dashed lines show fits, and the solid red lines the expected photobleaching rate as in Fig. 5. fON (clear), kτ (brick). To see this figure in color, go online.
Figure 8
Figure 8
The two ATP-dependent states of the CaMKII holoenzyme. State-1 is a weak affinity state (10xmonomer-Ai). It requires dimerization and is enhanced by holoenzyme formation. This state is obtained by silent mutations of both the activating and inhibitory phosphorylation sites (T287.306-307A). Alternatively, it is obtained in the WT holoenzyme after sufficient time has elapsed for phosphorylation of the inhibitory sites. Inhibitory autophosphorylation will decrease the probability of subunit capture, hence activating transphosphorylation, to obtain a steady state of partial T287 phosphorylation. State-2 is a strong affinity state (104xmonomer-Ai). This state is obtained by T287D residue substitution that mimics the ATP-dependent T287 autophosphorylation. In WT holoenzymes, maximal T287 autophosphorylation (state-2) will be achieved if there is minimal inhibitory phosphorylation due to a short-time delay between ATP addition and observation. A longer time delay will allow the slower inhibitory site phosphorylation to proceed until there is a steady-state balance between activating and inhibitory phosphorylation. To see this figure in color, go online.

Similar articles

Cited by

References

    1. Zhang M., Tanaka T., Ikura M. Calcium-induced conformational transition revealed by the solution structure of apo calmodulin. Nat. Struct. Biol. 1995;2:758–767. - PubMed
    1. Halling D.B., Liebeskind B.J., et al. Aldrich R.W. Conserved properties of individual Ca2+-binding sites in calmodulin. Proc. Natl. Acad. Sci. USA. 2016;113:E1216–E1225. - PMC - PubMed
    1. Jama A.M., Gabriel J., et al. Török K. Lobe-specific functions of Ca2+.calmodulin in alphaCa2+.calmodulin-dependent protein kinase II activation. J. Biol. Chem. 2011;286:12308–12316. - PMC - PubMed
    1. Bayer K.U., Schulman H. CaM Kinase: Still Inspiring at 40. Neuron. 2019;103:380–394. - PMC - PubMed
    1. De Koninck P., Schulman H. Sensitivity of CaM kinase II to the frequency of Ca2+ oscillations. Science (New York, N.Y. 1998;279:227–230. - PubMed

Publication types

MeSH terms

LinkOut - more resources