. 2024 May 1;32(5):1387-1406.
doi: 10.1016/j.ymthe.2024.02.029. Epub 2024 Feb 27.

Inhibition of Gpx4-mediated ferroptosis alleviates cisplatin-induced hearing loss in C57BL/6 mice

Affiliations

Inhibition of Gpx4-mediated ferroptosis alleviates cisplatin-induced hearing loss in C57BL/6 mice

Ziyi Liu et al. Mol Ther. .

Abstract

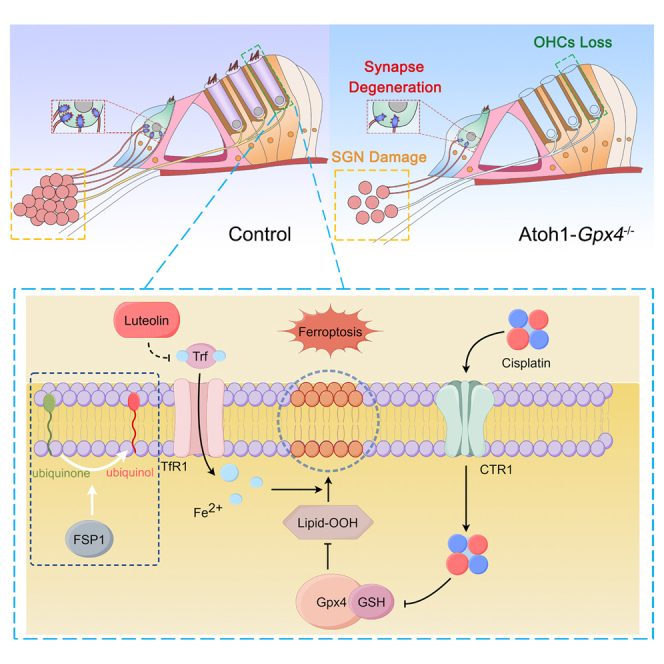
Cisplatin-induced hearing loss is a common side effect of cancer chemotherapy in clinics; however, the mechanism of cisplatin-induced ototoxicity is still not completely clarified. Cisplatin-induced ototoxicity is mainly associated with the production of reactive oxygen species, activation of apoptosis, and accumulation of intracellular lipid peroxidation, which also is involved in ferroptosis induction. In this study, the expression of TfR1, a ferroptosis biomarker, was upregulated in the outer hair cells of cisplatin-treated mice. Moreover, several key ferroptosis regulator genes were altered in cisplatin-damaged cochlear explants based on RNA sequencing, implying the induction of ferroptosis. Ferroptosis-related Gpx4 and Fsp1 knockout mice were established to investigate the specific mechanisms associated with ferroptosis in cochleae. Severe outer hair cell loss and progressive damage of synapses in inner hair cells were observed in Atoh1-Gpx4-/- mice. However, Fsp1-/- mice showed no significant hearing phenotype, demonstrating that Gpx4, but not Fsp1, may play an important role in the functional maintenance of HCs. Moreover, findings showed that FDA-approved luteolin could specifically inhibit ferroptosis and alleviate cisplatin-induced ototoxicity through decreased expression of transferrin and intracellular concentration of ferrous ions. This study indicated that ferroptosis inhibition through the reduction of intracellular ferrous ions might be a potential strategy to prevent cisplatin-induced hearing loss.

Keywords: Fsp1; Gpx4; cisplatin-induced ototoxicity; ferroptosis; luteolin; transferrin.


Conflict of interest statement

Declaration of interests The authors declare no competing interests.

Figures

None
Graphical abstract
Figure 1
Figure 1
Cisplatin-induced ferroptosis on both cochlear explants and the inner ear of mice (A) Schematic illustration of the experimental workflow of cisplatin-treated mice. ABR was measured in 6-week-old WT mice before and after cisplatin treatment. Cisplatin (4 mg/kg) was injected intraperitoneally for 4 days and then recovery for 6 days as a cycle (two cycles were performed in this study). (B and C) Cisplatin ototoxicity data showed that the hearing function and body weight of cisplatin-treated mice were decreased compared with the vehicle-treated group, n = 5 for each group. (D) Immunofluorescence analysis of TfR1 in the cochlea of WT mice after cisplatin treatment, the hair cells were labeled with anti-TfR1 (red) and anti-myosin7a (green) antibodies. TfR1-positive hair cells were found only in the cisplatin-treated mice. Scale bar, 20 μm. (E) Immunofluorescence analysis of myosin7a in vehicle-treated and 150 μM cisplatin-treated cochlear explants for 12 and 24 h. After 12 h, the morphology of cochlear explant hair cells altered slightly, but the number was comparable with the control group. In contrast, the morphology and number of OHCs were significantly damaged after 24 h. Scale bar, 20 μm. (F) Statistical analysis of the number of OHCs in (E), n = 4 for each group. (G) After 24 h of cisplatin treatment in cochlear explants, RNA sequencing (RNA-seq) was performed and revealed 10,501 differentially expressed genes compared with the vehicle-treated group. (H) RNA-seq results showed that ferroptosis-related genes were significantly altered. (I) The RNA-seq result of ferroptosis pathway-related genes were verified by qPCR from the cochlear explants treated with vehicle and cisplatin for 12 and 24 h, n = 5 for each group. (J) Western blot was performed to detect the protein level of Gpx4 in cochlear explants at different time points after cisplatin treatment. In the cisplatin-treated group, the Gpx4 content was increased at 12 h and significantly decreased at 24 h compared with the vehicle-treated group. (K) Quantitative analysis of the bands in (J), n = 4 for each group. (L) ELISA was used to detect the content of GSH in the cochlear explants of the vehicle- and cisplatin-treated groups at 12 and 24 h. The result showed that GSH content was higher at 12 h, but significantly lower at 24 h of cisplatin treatment compared with the vehicle-treated group, n ≥ 3 for each group. Statistical values are presented as mean ± SEM, ∗p < 0.05, ∗∗p < 0.01, ∗∗∗p < 0.001.
Figure 2
Figure 2
Ferroptosis leads to loss of OHCs in Atoh1-Gpx4−/− mice at P1 (A) Immunofluorescence analysis of RSL3-treated cochlear explants showed that RSL3 caused the death of OHCs (myosin7a labeled) but not supporting cells (Sox2 labeled). Scale bar, 50 μm. (B) Representative images for Gpx4 (red), myosin7a (green), and DAPI (blue) immunofluorescence-stained cochlear sections from P1 WT mice. OHCs are identified with yellow arrows, IHCs are identified with white arrows, Deiters’ cells are circled with dotted yellow lines, pillar cells are circled with dotted white lines, and Hensen cells are denoted by the white triangles. Scale bar, 50 μm. (C) Schematic diagram showing the construction of Gpx4 conditional knockout mice. Gpx4-floxed mice were generated by adding loxP sequence on either side of 2–4 exons and then mated with Atoh1-cre mice to obtain Atoh1-cre:Gpx4-floxed mice (named Atoh1-Gpx4−/−). (D) Genotype identification of WT (+/+), heterozygous (f/+), homozygous (f/f) mice, and Cre by PCR and agarose gel. (E) Immunofluorescence images of TfR1 expression in the cochlear hair cells of Gpx4−/− mice. The result showed that TfR1 expression was significantly increased in the OHCs of Atoh1-Gpx4−/− mice. Scale bar, 50 μm. (F) Transmission electron micrograph of OHCs in cochlear sections from P1 WT and Atoh1-Gpx4−/− mice. Higher-magnification images of OHCs are shown on the right. In the OHC of Atoh1-Gpx4−/− mice, red arrows and yellow triangles indicate damaged mitochondria and cell membranes, respectively. Scale bar, 2 μm. (G) Transmission electron micrograph of IHCs in cochlear sections from P9 WT and Atoh1-Gpx4−/− mice, and no significant differences were found. Scale bar, 2 μm. (H) Scanning electron micrograph of hair cell stereocilia in the apical and medial turns from P1 Gpx4-floxed and Atoh1-Gpx4−/− mice. We found that knockout of Gpx4 altered the morphology of hair bundles and cuticular plates. The red line area represents the abnormal cuticular plates. Scale bar, 2 μm.
Figure 3
Figure 3
Atoh1-induced Gpx4 knockout resulted in hearing loss (A) Statistical analysis of the ABR threshold in Atoh1-Gpx4−/− and Gpx4-floxed mice at P30. The threshold at all frequencies is higher than that in Gpx4-floxed mice, n = 5 for each group. (B) Click-ABR waveforms in Gpx4-floxed and Atoh1-Gpx4−/− mice at P30, and the ABR traces were recorded at the same measure range of latency and amplitude. (C) At P30, DPOAE data showed that Atoh1-Gpx4−/− mice had impaired OHC function and hearing loss compared with the Gpx4-floxed mice, n = 5 for each group. (D) Representative confocal images for myosin7a (green) and phalloidin (red) staining in the cochlea of Gpx4-floxed and Atoh1-Gpx4−/− mice at P14 and P30. The result showed that the knockout of Gpx4 resulted in a massive loss of OHCs. Scale bar, 20 μm. (E) Quantification of the rate of OHC loss in (D), n = 5 for each group. (F) hematoxylin and eosin (H&E) staining of sections from the Gpx4-floxed and Atoh1-Gpx4−/− mice at P30. Scale bars, 50 μm. (G) Statistical analysis of the SV thickness in (F). Compared with Gpx4-floxed mice, the SV was thinner in the Atoh1-Gpx4−/− mice, n = 5 for each group. (H) SGN density result in (F) showed that the number of SGNs in Atoh1-Gpx4−/− mice was significantly less than Gpx4-floxed mice, n = 5 for each group. (I) Synapse staining by anti-CtBP2 (red) and anti-GluR2 antibodies in cochleae of Gpx4-floxed mice and Atoh1-Gpx4−/− mice at P14 and P30. Scale bar, 10 μm. (J) Quantification of the number of CtBP2-positive, GluR2-positive, and double-positive synapse puncta of the IHCs in (I), n = 3 for each group. Statistical values are presented as mean ± SEM, ∗p < 0.05, ∗∗p < 0.01, ∗∗∗p < 0.001.
Figure 4
Figure 4
Fsp1−/− mice showed normal hearing function (A) Schematic diagram showing the construction of knockout mice models, exon 4–8 was deleted in the region of the Fsp1 gene. (B) Genotype identification of Fsp1 WT, heterozygous (HET), and knockout (KO) mice by PCR. (C) Total RNA extracted from the mouse cochlea for qPCR analysis, and the Fsp1 mRNA level was significantly decreased in the cochlea of Fsp1−/− mice, n = 4 for each group. (D) Immunofluorescence analysis of Fsp1 (red) and myosin7a (green) in cochlear hair cells of WT and Fsp1−/− mice. Results showed that the Fsp1 signal was present in hair cells of WT mice but absent in Fsp1−/− mice, indicating that Fsp1 was effectively knocked out in hair cells of Fsp1−/− mice. OHC, dotted yellow lines; IHC, dotted white lines. Scale bar, 5 μm. (E–G) Analysis of auditory function in Fsp1−/− mice. We found no significant difference in ABR thresholds (E) and click-ABR waveforms (F) between WT and Fsp1−/− mice at P90, moreover, DPOAE results (G) also showed normal hearing function in the Fsp1−/− mice, n = 5. ns, no significance. (H) Representative confocal images for myosin7a (green) and phalloidin (red) staining in the apical, medial, and basal turn of cochlear regions from control and Fsp1−/− mice at P90, no differences were found between the WT and Fsp1−/− mice. Scale bar, 20 μm. (I) Quantification of the survival rate of OHC in (H), n = 5 for each group. (J–L) H&E staining was used to analyze the structure of the Fsp1−/− and WT cochlea at P90 (J), and there was no significant difference in the thickness of SV (K) and the number of SGNs (L) between the two groups, n = 5 for each group. Scale bars, 100 μm. SGNs, spiral ganglion neurons; SV, stria vascularis. Statistical values are presented as mean ± SEM, ∗∗∗p < 0.001.
Figure 5
Figure 5
Fer-1 alleviated the ferroptosis of OHCs induced by Gpx4 deletion (A) Representative images of myosin7a (red) and DAPI (blue) staining of cochlear hair cells from the Gpx4-floxed, Atoh1-Gpx4−/−, and Atoh1-Gpx4−/− with Fer-1-treated mice. Scale bar, 20 μm. (B) Quantification of OHC number in (A), and the data showed that the Fer-1 could partially rescue the OHC loss caused by Gpx4 deficiency, n = 5 for each group. (C) Schematic of the experimental workflow showing Fer-1 injection in Pou4f3-Gpx4Cre/ER mice with tamoxifen induction. The Pou4f3-Gpx4Cre/ER mice were injected with 10 mg/kg tamoxifen for five consecutive days at 6 weeks, and treated with Fer-1 (5 mg/kg) once every other day for 21 consecutive days. (D and E) ABR and DPOAE techniques were used to detect the hearing function of Pou4f3-Gpx4Cre/ER, Pou4f3-Gpx4Cre/ER with tamoxifen, and Pou4f3-Gpx4Cre/ER with tamoxifen and Fer-1 mice, the results showed that Fer-1 treatment could rescue hearing loss caused by Gpx4 deficiency, n = 5 for each group. (F) Representative confocal images of myosin7a (green) and phalloidin (red) staining in the cochleae of Pou4f3-Gpx4Cre/ER, Pou4f3-Gpx4Cre/ER with tamoxifen, and Pou4f3-Gpx4Cre/ER with tamoxifen + Fer-1 mice. Scale bar, 20 μm. (G) Quantification of the OHC loss in (F), n = 5 for each group. (H) Schematic illustration of the experimental workflow showing Fer-1 injection in cisplatin-treated mice. The WT mice pre-treated with Fer-1 (3 mg/kg) were injected with cisplatin (4 mg/kg) every day at 6 weeks for 4 days and recovery for 6 days as a cycle (two cycles were performed). (I and J) ABR and DPOAE techniques were used to detect the hearing function of control, cisplatin-treated mice, and cisplatin-treated mice with Fer-1 pre-treatment. The results showed that Fer-1 treatment could rescue hearing loss caused by Gpx4 deficiency, n = 5 for each group. (K) Representative images of myosin7a (green) and phalloidin (red) staining in the cochlea of WT mice treated with vehicle, cisplatin, and cisplatin + Fer-1. Scale bar, 20 μm. (L) Quantification of OHC loss in (K), n = 5 for each group. Statistical values are presented as mean ± SEM, ∗p < 0.05, ∗∗p < 0.01, ∗∗∗p < 0.001.
Figure 6
Figure 6
Luteolin alleviated ferroptosis caused by cisplatin in HEI-OC1 cells (A) Cell-based ferroptosis associated small-molecule screening using the HEI-OC1 cell line; medium alone (green dots), cisplatin alone (blue dots), compound + cisplatin (gray dots), and luteolin + cisplatin (red dots). (B) Diagram of the molecular structure of luteolin. (C) Dose-response curve for RSL3 of luteolin, daidzin, and sodium danshensu based on results of the CCK-8 assay in HEI-OC1 cell treated with 3 μM RSL3, RSL3 + luteolin, RSL3 + daidzin, and RSL3 + sodium danshensu, n = 5 for each group. (D) Luteolin dose-response curve for cisplatin based on results of the CCK-8 assay in HEI-OC1 cells treated with 50 μM cisplatin, and the data showed that HEI-OC1 cells pre-treated with 1 and 2 μM luteolin had a significant higher cell viability after cisplatin treatment, n = 5 for each group. (E) Light microscopy analysis of HEI-OC1 cells treated with medium alone, 50 μM cisplatin, and 50 μM cisplatin + 1 μM luteolin for 24 h. Scale bar, 200 μm. (F) Representative images of myosin7a-staining of whole-mount middle turn cochlear explants treated with medium alone, 150 μM cisplatin, and 150 μM cisplatin + 2 μM luteolin for 24 h. Scale bar, 50 μm. (G) Quantification the survival rate of OHC in (F), and the results indicate that luteolin could reduce the damage of hair cells induced by cisplatin, n = 5 for each group. (H and I) DCFH-DA dye was used to detect ROS level generated by cisplatin, and the fluorescence signal of ROS in HEI-OC1 cells (H) and cochlear explants (I) treated with cisplatin alone was higher than that in the control group, while the fluorescence signal was significantly attenuated by luteolin pre-treatment. Scale bars, 100 μm (H) and 20 μm (I). (J and K) Statistical analyses of the relative fluorescence intensity in (H) and (I), respectively, n = 5 for each group. (L) Representative images of TfR1 (green)- and phalloidin (red)-stained HEI-OC1 cells treated with medium, 1 μM RSL3, and 1 μM RSL3 + 5 μM luteolin for 12 h. The intensity of TfR1 fluorescence in the RSL3-treated group was higher than that in the control group, but decreased significantly with luteolin pre-treatment. Scale bar, 100 μm. (M) Statistical analysis of the relative intensity of TfR1 fluorescence in (L), n = 5 for each group. Statistical values are presented as mean ± SEM, ∗p < 0.05, ∗∗p < 0.01, ∗∗∗p < 0.001.
Figure 7
Figure 7
Luteolin alleviated the ferroptosis by downregulating Trf and upregulating HO-1 (A) Schematic illustration of the experimental workflow for treatment of cisplatin and luteolin. ABR was measured in C57BL/6 WT mice before and after cisplatin treatment, and the luteolin (1 mg/kg) was administered before cisplatin injection every time, followed by injection of cisplatin (4 mg/kg) for 4 days and recovery for 6 days as a treatment cycle (two cycles in total). (B) ABR was performed to detect the hearing of vehicle-, cisplatin-, and luteolin + cisplatin-treated mice, and the results showed that luteolin could reduce the ototoxicity of cisplatin and protect hearing, n = 5 for each group. (C) Representative images of myosin7a (green) and phalloidin (red) staining in the cochlea of vehicle, cisplatin, and luteolin + cisplatin mice. Scale bar, 20 μm. (D) Quantification of OHC loss in (C), the data indicated that luteolin could partially protect hair cells against the ototoxicity of cisplatin, n = 5 for each group. (E) Schematic illustration of the experimental workflow for treatment of tamoxifen and luteolin. ABR was measured in Pou4f3-Gpx4Cre/ER mice before and after tamoxifen treatment, and the tamoxifen (10 mg/kg every day for 5 days) was administered before luteolin (6 mg/kg once every other day for 21 days) injection. (F) ABR analysis for the Pou4f3-Gpx4Cre/ER mice treated with vehicle, tamoxifen, and tamoxifen + luteolin, and the results showed that luteolin could partially prevent deafness caused by Gpx4 deficiency, n = 5 for each group. (G) Representative images of myosin7a (green) and phalloidin (red) staining in the cochlea of the Pou4f3-Gpx4Cre/ER mice treated with vehicle, tamoxifen, and tamoxifen + luteolin. Scale bar, 20 μm. (H) Quantification of OHC loss in (G), n = 5 for each group. (I) Western blot was used to analyze the expression of Trf, HO-1, and Nrf2 in the cochlea of WT mice treated with vehicle, cisplatin, and cisplatin + luteolin. (J) Statistical analysis of the protein level in (I), and the result showed that the expression of Trf and HO-1 in the cochlea of the cisplatin-treated cochlea were higher than that of the vehicle group, and luteolin pre-treatment reduced Trf content but not HO-1. In addition, the expression of Nrf2 was consistent among the three groups, n = 3 for each group. (K) Western blot was used to analyze the expression of Trf, TfR1, HO-1, and Nrf2 from vehicle, RSL3, and luteolin + RSL3-treated HEI-OC1 cells. (L) Statistical analysis of the protein level in (K), and the protein level of Trf and TfR1 in RSL3-treated HEI-OC1 cells was increased compared with that in vehicle-treated HEI-OC1 cells, which was downregulated by luteolin pre-treatment, n = 4 for each group. (M) Analysis of intracellular ferrous ions using FerroOrange staining in vehicle-, 50 μM cisplatin-, and 50 μM cisplatin + 1 μM luteolin-treated HEI-OC1 cells for 24 h. Scale bar, 10 μm. (N) Statistical analysis of the mean FerroOrange fluorescence relative intensity in (M). The intensity FerroOrange fluorescence signal in the cisplatin-treated group was significantly higher than that of the control group, while the fluorescence intensity was reduced by luteolin pre-treatment, n = 10 for each group. (O) Analysis of intracellular ferrous ions using FerroOrange staining in vehicle-, 1 μM RSL3-, and 1 μM RSL3 + 5 μM luteolin-treated HEI-OC1 cells for 12 h. Scale bar, 10 μm. (P) Statistical analysis of the mean FerroOrange fluorescence relative intensity in (O). The intensity FerroOrange fluorescence signal in the RSL3-treated group was significantly higher than that of the control group, while the fluorescence intensity was reduced by luteolin pre-treatment, n = 10 for each group. Statistical values are presented as mean ± SEM, ∗p < 0.05, ∗∗p < 0.01, ∗∗∗p < 0.001.

Similar articles

Cited by

References

    1. Li Y., Chen X., He W., Xia S., Jiang X., Li X., Bai J., Li N., Chen L., Yang B. Apigenin Enhanced Antitumor Effect of Cisplatin in Lung Cancer via Inhibition of Cancer Stem Cells. Nutr. Cancer. 2021;73:1489–1497. doi: 10.1080/01635581.2020.1802494. - DOI - PubMed
    1. Meng F., Sun G., Zhong M., Yu Y., Brewer M.A. Anticancer efficacy of cisplatin and trichostatin A 5-aza-2′-deoxycytidine on ovarian cancer. Br. J. Cancer. 2013;108:579–586. doi: 10.1038/bjc.2013.10. - DOI - PMC - PubMed
    1. Coen J.J., Zhang P., Saylor P.J., Lee C.T., Wu C.L., Parker W., Lautenschlaeger T., Zietman A.L., Efstathiou J.A., Jani A.B., et al. Bladder Preservation With Twice-a-Day Radiation Plus Fluorouracil/Cisplatin or Once Daily Radiation Plus Gemcitabine for Muscle-Invasive Bladder Cancer: NRG/RTOG 0712A Randomized Phase II Trial. J. Clin. Oncol. 2019;37:44–51. doi: 10.1200/Jco.18.00537. - DOI - PMC - PubMed
    1. Du J., Wang X., Li Y., Ren X., Zhou Y., Hu W., Zhou C., Jing Q., Yang C., Wang L., et al. DHA exhibits synergistic therapeutic efficacy with cisplatin to induce ferroptosis in pancreatic ductal adenocarcinoma via modulation of iron metabolism. Cell Death Dis. 2021;12 doi: 10.1038/s41419-021-03996-y. - DOI - PMC - PubMed
    1. Dugbartey G.J., Peppone L.J., de Graaf I.A.M. An integrative view of cisplatin-induced renal and cardiac toxicities: Molecular mechanisms, current treatment challenges and potential protective measures. Toxicology. 2016;371:58–66. doi: 10.1016/j.tox.2016.10.001. - DOI - PMC - PubMed

Publication types

MeSH terms

LinkOut - more resources