

In vivo microstructural heterogeneity of white matter and cognitive correlates in aging using tissue compositional analysis of diffusion magnetic resonance imaging
- PMID: 38414286
- PMCID: PMC10899800
- DOI: 10.1002/hbm.26618
In vivo microstructural heterogeneity of white matter and cognitive correlates in aging using tissue compositional analysis of diffusion magnetic resonance imaging
Abstract
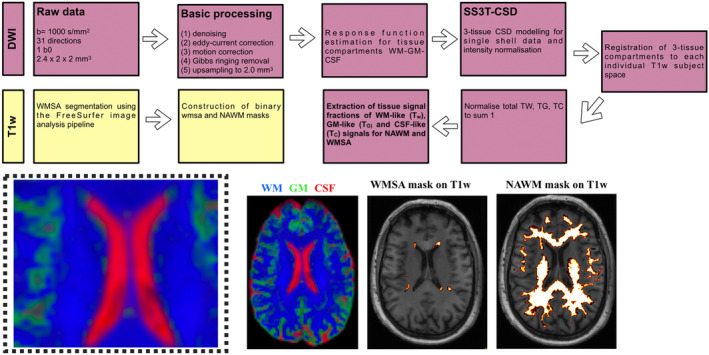
Background: Age-related cognitive decline is linked to changes in the brain, particularly the deterioration of white matter (WM) microstructure that accelerates after the age of 60. WM deterioration is associated with mild cognitive impairment and dementia, but the origin and role of white matter signal abnormalities (WMSA) seen in standard MRI remain debated due to their heterogeneity. This study explores the potential of single-shell 3-tissue constrained spherical deconvolution (SS3T-CSD), a novel technique that models diffusion data in terms of gray matter (TG ), white matter (Tw ), and cerebrospinal fluid (TC ), to differentiate WMSA from normal-appearing white matter and better understand the interplay between changes in WM microstructure and decline in cognition.
Methods: A total of 189 individuals from the GENIC cohort were included. MRI data, including T1-weighted and diffusion images, were obtained. Preprocessing steps were performed on the diffusion MRI data, followed by the SS3T-CSD. WMSA were segmented using FreeSurfer. Statistical analyses were conducted to assess the association between age, WMSA volume, 3-tissue signal fractions (Tw , TG , and TC ), and neuropsychological variables.
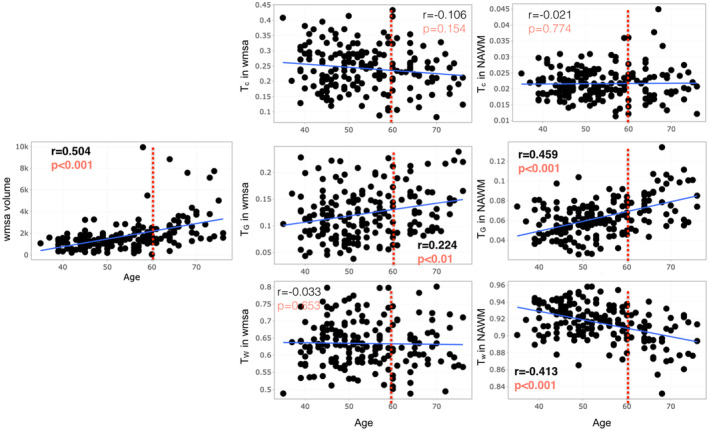
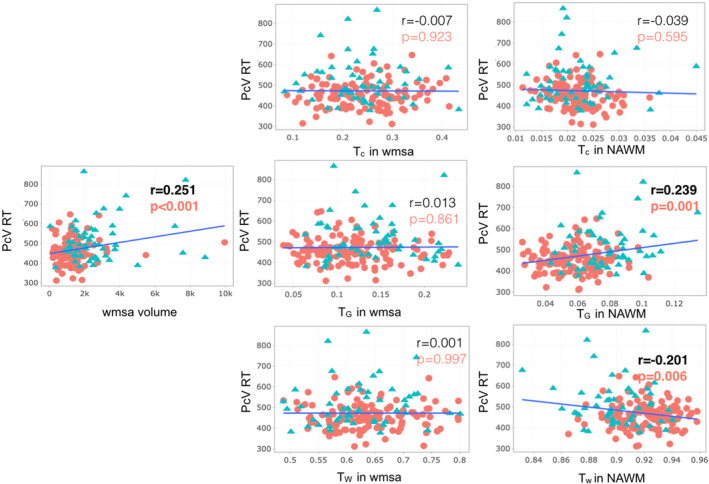
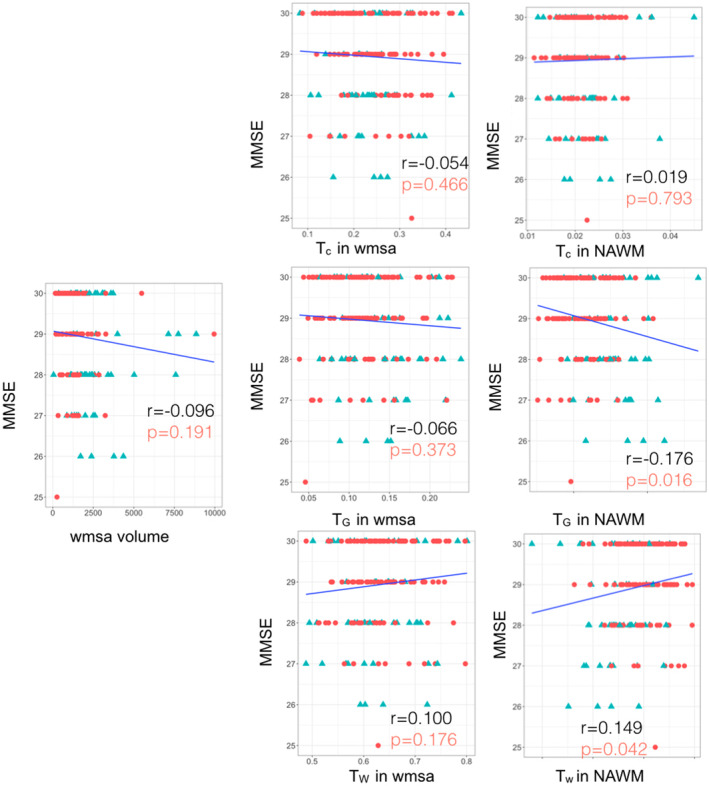
Results: Participants above 60 years old showed worse cognitive performance and processing speed compared to those below 60 (p < .001). Age was negatively associated with Tw in normal-appearing white matter (p < .001) and positively associated with TG in both WMSA (p < .01) and normal-appearing white matter (p < .001). Age was also significantly associated with WMSA volume (p < .001). Higher processing speed was associated with lower Tw and higher TG , in normal-appearing white matter (p < .01 and p < .001, respectively), as well as increased WMSA volume (p < .001). Similarly, lower MMSE scores correlated with lower Tw and higher TG in normal-appearing white matter (p < .05). High cholesterol and hypertension were associated with higher WMSA volume (p < .05).
Conclusion: The microstructural heterogeneity within normal-appearing white matter and WMSA is associated with increasing age and cognitive variation, in cognitively unimpaired individuals. Furthermore, the 3-tissue signal fractions are more specific to potential white matter alterations than conventional MRI measures such as WMSA volume. These findings also support the view that the WMSA volumes may be more influenced by vascular risk factors than the 3-tissue metrics. Finally, the 3-tissue metrics were able to capture associations with cognitive tests and therefore capable of capturing subtle pathological changes in the brain in individuals who are still within the normal range of cognitive performance.
Keywords: GENIC; SS3T-CSD; WMSA; aging; diffusion.
© 2024 The Authors. Human Brain Mapping published by Wiley Periodicals LLC.
Conflict of interest statement
There is no conflict of interest.
Figures
Similar articles
-
Shades of white: diffusion properties of T1- and FLAIR-defined white matter signal abnormalities differ in stages from cognitively normal to dementia.Neurobiol Aging. 2018 Aug;68:48-58. doi: 10.1016/j.neurobiolaging.2018.03.029. Epub 2018 Apr 5. Neurobiol Aging. 2018. PMID: 29704648
-
Three-tissue compositional analysis reveals in-vivo microstructural heterogeneity of white matter hyperintensities following stroke.Neuroimage. 2020 Sep;218:116869. doi: 10.1016/j.neuroimage.2020.116869. Epub 2020 Apr 22. Neuroimage. 2020. PMID: 32334092
-
Macro- and micro-structural white matter differences correlate with cognitive performance in healthy aging.Brain Imaging Behav. 2016 Mar;10(1):168-81. doi: 10.1007/s11682-015-9378-4. Brain Imaging Behav. 2016. PMID: 25824621
-
Aging and white matter microstructure and macrostructure: a longitudinal multi-site diffusion MRI study of 1218 participants.Brain Struct Funct. 2022 Jul;227(6):2111-2125. doi: 10.1007/s00429-022-02503-z. Epub 2022 May 23. Brain Struct Funct. 2022. PMID: 35604444 Free PMC article. Review.
-
Decoding Brain Development and Aging: Pioneering Insights From MRI Techniques.Invest Radiol. 2025 Mar 1;60(3):162-174. doi: 10.1097/RLI.0000000000001120. Epub 2024 Oct 9. Invest Radiol. 2025. PMID: 39724579 Free PMC article. Review.
Cited by
-
Should We Consider Neurodegeneration by Itself or in a Triangulation with Neuroinflammation and Demyelination? The Example of Multiple Sclerosis and Beyond.Int J Mol Sci. 2024 Nov 25;25(23):12637. doi: 10.3390/ijms252312637. Int J Mol Sci. 2024. PMID: 39684351 Free PMC article. Review.
References
-
- Abe, O. , Yamasue, H. , Aoki, S. , Suga, M. , Yamada, H. , Kasai, K. , Masutani, Y. , Kato, N. , Kato, N. , & Ohtomo, K. (2008). Aging in the CNS: Comparison of gray/white matter volume and diffusion tensor data. Neurobiology of Aging, 29, 102–116. - PubMed
-
- Altamura, C. , Scrascia, F. , Quattrocchi, C. C. , Errante, Y. , Gangemi, E. , Curcio, G. , Ursini, F. , Silvestrini, M. , Maggio, P. , Beomonte Zobel, B. , Rossini, P. M. , Pasqualetti, P. , Falsetti, L. , & Vernieri, F. (2016). Regional MRI diffusion, White‐matter Hyperintensities, and cognitive function in Alzheimer's disease and vascular dementia. Journal of Clinical Neurology, 12, 201–208. - PMC - PubMed
-
- Badji, A. , Pereira, J. B. , Shams, S. , Skoog, J. , Marseglia, A. , Poulakis, K. , Rydén, L. , Blennow, K. , Zetterberg, H. , Kern, S. , Zettergren, A. , Wahlund, L. O. , Girouard, H. , Skoog, I. , & Westman, E. (2021). Cerebrospinal fluid biomarkers, brain structural and cognitive performances between normotensive and hypertensive controlled, uncontrolled and untreated 70‐year‐old adults. Frontiers in Aging Neuroscience, 13, 777475. - PMC - PubMed
MeSH terms
Grants and funding
LinkOut - more resources
Full Text Sources
Miscellaneous
