Lysozyme promotes renal fibrosis through the JAK/STAT3 signal pathway in diabetic nephropathy
- PMID: 38414445
- PMCID: PMC10895955
- DOI: 10.5114/aoms/170160
Lysozyme promotes renal fibrosis through the JAK/STAT3 signal pathway in diabetic nephropathy
Abstract
Introduction: Diabetic nephropathy (DN) is a leading cause of kidney failure. Lysozyme (LYZ) is an essential component of innate immunity and exhibits antibacterial properties. However, LYZ has been reported to induce nephropathy, implying a possible association between impaired renal function and lysozyme expression.
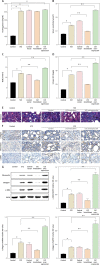
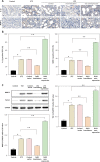
Material and methods: Bioinformatics analysis was used to predict the hub gene associated with DN, and the differential expression of the hub gene was confirmed using a mouse model. A mouse model of streptozotocin (STZ)-induced diabetic nephropathy was established to investigate the correlation between DN and LYZ expression, and the functionality of LYZ was verified through knockdown and overexpression experiments conducted in vivo. Immunohistochemistry (IHC) was utilized to assess fibrosis-related markers and cytokines, while Masson staining was performed to assess renal fibrosis. Fibroblast proliferation was assessed using the Cell Counting Kit-8 (CCK-8) assay. The role of the JAK pathway was confirmed using the JAK inhibitor AG490, and Western blot was used to investigate the underlying mechanisms.
Results: Mechanistically, 25 mM glucose promotes the expression of LYZ in fibroblastic cells, and LYZ may in turn promote the proliferation of renal interstitial fibroblasts. Western blot shows that glucose can activate STAT3 in an LYZ-dependent manner, and the JAK inhibitor AG490 can partially suppress LYZ-induced STAT3 activation. Furthermore, in vivo observations have revealed that overexpression of LYZ is associated with the senescent phenotype of renal tubular epithelial cells (RTECs).
Conclusions: Lysozyme promotes kidney fibrosis via the JAK/STAT3 signaling pathway in diabetic nephropathy, and glucose may promote fibroblast proliferation by promoting LYZ auto-secretion.
Keywords: JAK; STAT3; diabetic nephropathy; lysozyme; renal fibrosis.
Copyright: © 2023 Termedia & Banach.
Conflict of interest statement
The authors declare no conflict of interest.
Figures


Similar articles
-
CXCL6 Promotes Renal Interstitial Fibrosis in Diabetic Nephropathy by Activating JAK/STAT3 Signaling Pathway.Front Pharmacol. 2019 Mar 25;10:224. doi: 10.3389/fphar.2019.00224. eCollection 2019. Front Pharmacol. 2019. Retraction in: Front Pharmacol. 2024 Dec 05;15:1530358. doi: 10.3389/fphar.2024.1530358. PMID: 30967776 Free PMC article. Retracted.
-
ErHuang Formula Improves Renal Fibrosis in Diabetic Nephropathy Rats by Inhibiting CXCL6/JAK/STAT3 Signaling Pathway.Front Pharmacol. 2020 Jan 24;10:1596. doi: 10.3389/fphar.2019.01596. eCollection 2019. Front Pharmacol. 2020. Retraction in: Front Pharmacol. 2024 Dec 02;15:1530375. doi: 10.3389/fphar.2024.1530375. PMID: 32038260 Free PMC article. Retracted.
-
Decoy receptor 2 mediates the apoptosis-resistant phenotype of senescent renal tubular cells and accelerates renal fibrosis in diabetic nephropathy.Cell Death Dis. 2022 Jun 3;13(6):522. doi: 10.1038/s41419-022-04972-w. Cell Death Dis. 2022. PMID: 35661704 Free PMC article.
-
MUC1 Promotes Mesangial Cell Proliferation and Kidney Fibrosis in Diabetic Nephropathy Through Activating STAT and β-Catenin Signal Pathway.DNA Cell Biol. 2021 Oct;40(10):1308-1316. doi: 10.1089/dna.2021.0098. Epub 2021 Sep 14. DNA Cell Biol. 2021. PMID: 34520253
-
Huangkui capsule in combination with metformin ameliorates diabetic nephropathy via the Klotho/TGF-β1/p38MAPK signaling pathway.J Ethnopharmacol. 2021 Dec 5;281:113548. doi: 10.1016/j.jep.2020.113548. Epub 2020 Nov 3. J Ethnopharmacol. 2021. PMID: 33152427
Cited by
-
The geroprotectors trametinib and rapamycin combine additively to extend mouse healthspan and lifespan.Nat Aging. 2025 Jul;5(7):1249-1265. doi: 10.1038/s43587-025-00876-4. Epub 2025 May 28. Nat Aging. 2025. PMID: 40437307 Free PMC article.
-
Decoding diabetic kidney disease: a comprehensive review of interconnected pathways, molecular mediators, and therapeutic insights.Diabetol Metab Syndr. 2025 Jun 4;17(1):192. doi: 10.1186/s13098-025-01726-4. Diabetol Metab Syndr. 2025. PMID: 40468401 Free PMC article. Review.
-
Ursolic Acid Ameliorates Diabetic Nephropathy by Inhibiting JAK2/STAT3-Driven Ferroptosis: Mechanistic Insights from Network Pharmacology and Experimental Validation.Drug Des Devel Ther. 2025 Aug 4;19:6699-6717. doi: 10.2147/DDDT.S526554. eCollection 2025. Drug Des Devel Ther. 2025. PMID: 40786248 Free PMC article.
-
Spatial transcriptomics reveals prognostically LYZ+ fibroblasts and colocalization with FN1+ macrophages in diffuse large B-cell lymphoma.Cancer Immunol Immunother. 2025 Feb 25;74(4):123. doi: 10.1007/s00262-025-03968-7. Cancer Immunol Immunother. 2025. PMID: 39998673 Free PMC article.
-
Integrated multi-omics for potential biomarkers and molecular mechanism of persistent inflammatory refractory rheumatoid arthritis.Front Immunol. 2025 Jul 25;16:1574783. doi: 10.3389/fimmu.2025.1574783. eCollection 2025. Front Immunol. 2025. PMID: 40787440 Free PMC article.
References
-
- Papadopoulou-Marketou N, Kanaka-Gantenbein C, Marketos N, et al. . Biomarkers of diabetic nephropathy: a 2017 update. Crit Rev Clin Labor Sci 2017; 54: 326–42. - PubMed
-
- Ismail A, Abd El-Azeim A. Response of erectile dysfunction to extracorporeal shock wave therapy in type 2 diabetic men. Physiother Quarter 2022; 30: 77–80.
-
- Ismail A, Abdelghany A, Atef H. Response of testosterone and semen parameters to a 14-week aerobic training in sedentary obese men with hyperglycaemia. Physiother Quart 2023; 31: 28–33.
-
- Ismail AMA, El-Azeim ASA. Short-term intraocular pressure response to the combined effect of transcutaneous electrical nerve stimulation over acupoint (Acu-TENS) and yoga ocular exercise in type 2 diabetic patients with primary open-angle glaucoma: a randomized controlled trial. J Acupunct Meridian Stud 2021; 14: 193–9. - PubMed
LinkOut - more resources
Full Text Sources
Miscellaneous
