. 2024 Feb 23:19:1809-1825.
doi: 10.2147/IJN.S449042. eCollection 2024.

Combined Photosensitive Gene Therapy Effective Against Triple-Negative Breast Cancer in Mice Model

Affiliations

Combined Photosensitive Gene Therapy Effective Against Triple-Negative Breast Cancer in Mice Model

Yixue Hu et al. Int J Nanomedicine. .

Abstract

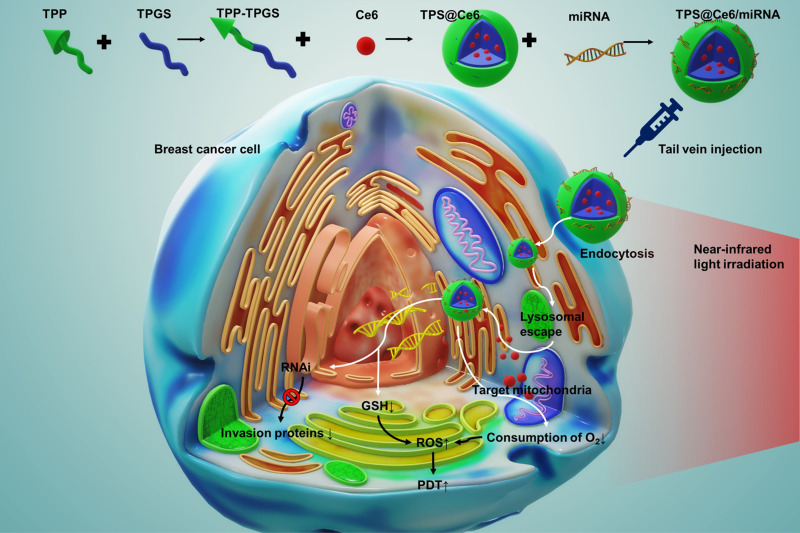
Introduction: Tumor hypoxia and invasion present significant challenges for the efficacy of photodynamic therapy (PDT) in triple-negative breast cancer (TNBC). This study developed a mitochondrial targeting strategy that combined PDT and gene therapy to promote each other and address the challenges.

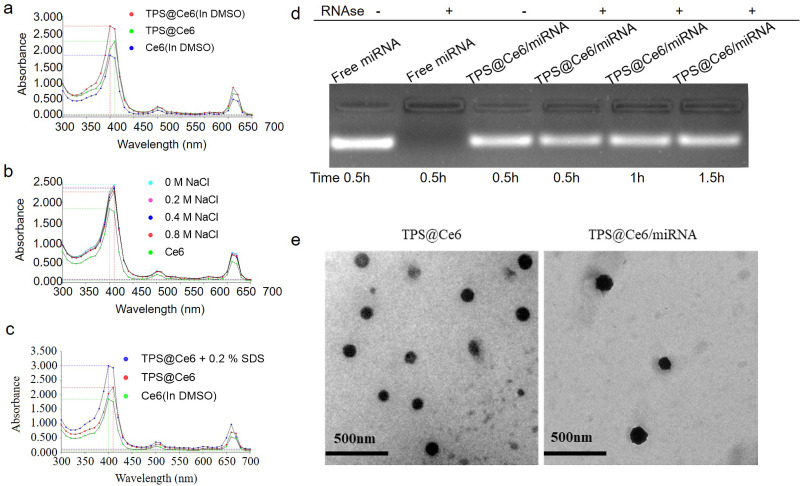
Methods: The positively charged amphiphilic material triphenylphosphine-tocopherol polyethylene glycol succinate (TPP-TPGS, TPS) and the photosensitizer chloride e6 (Ce6) formed TPS@Ce6 nanoparticles (NPs) by hydrophobic interaction. They electrostatically condensed microRNA-34a (miR-34a) to form stable TPS@Ce6/miRNA NPs.

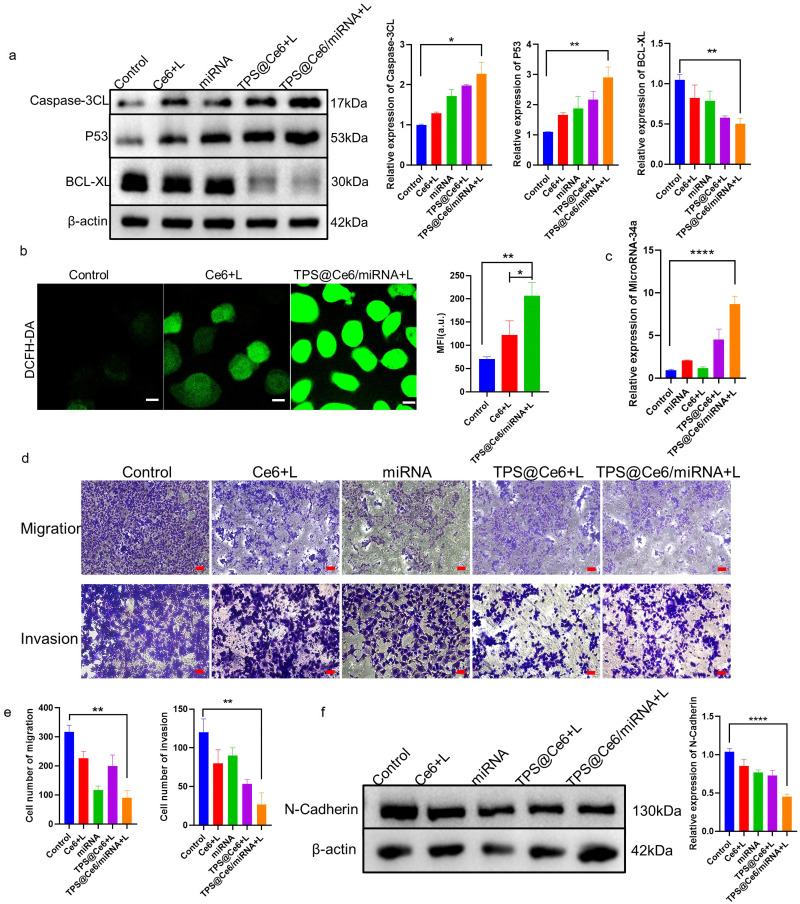
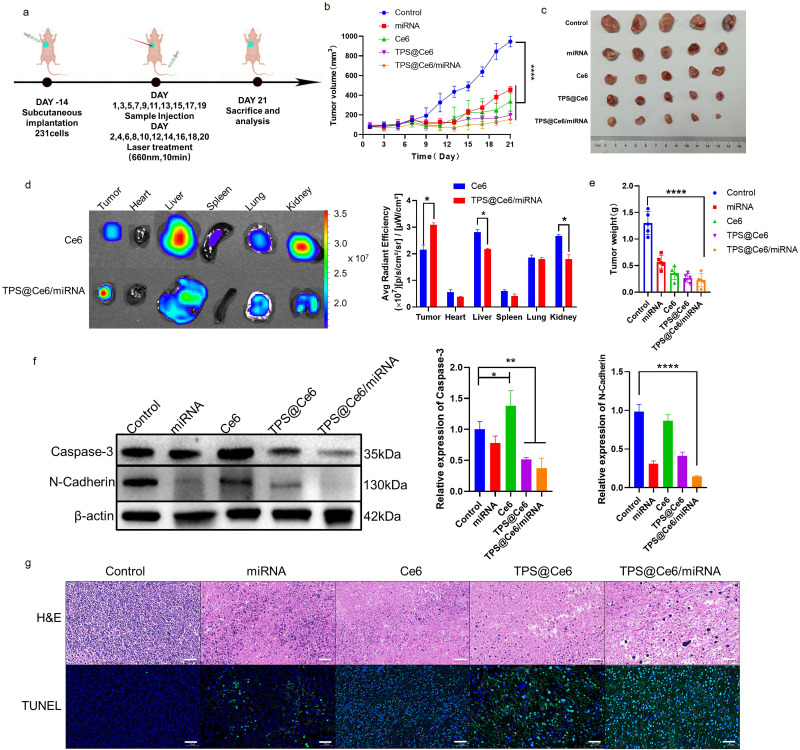
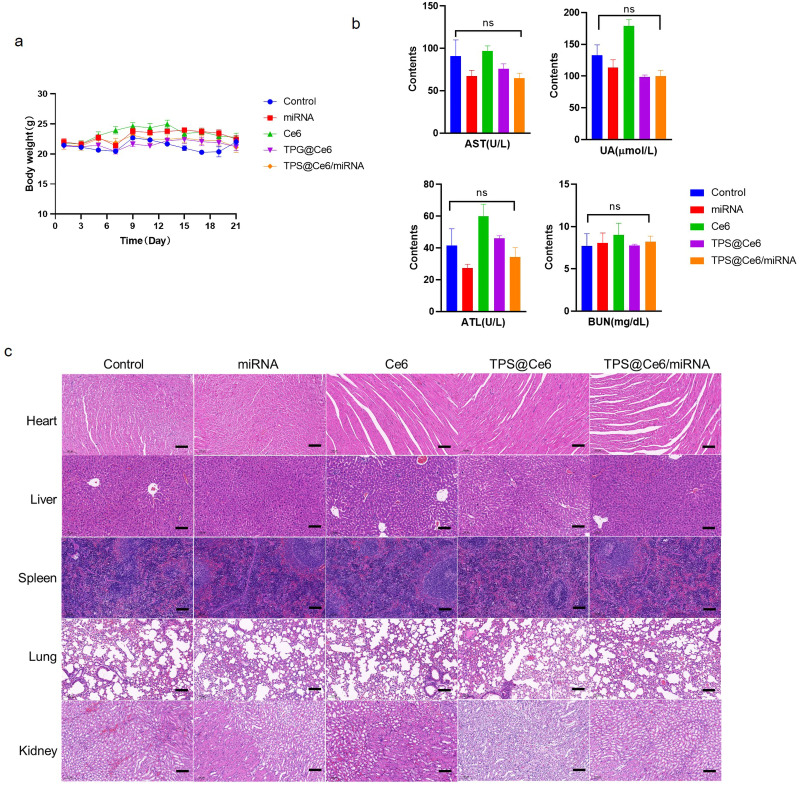
Results: Firstly, Ce6 disrupted the lysosomal membrane, followed by successful delivery of miR-34a by TPS@Ce6/miRNA NPs. Meanwhile, miR-34a reduced ROS depletion and further enhanced the effectiveness of PDT. Consequently, the mutual promotion between PDT and gene therapy led to enhanced anti-tumor effects. Furthermore, the TPS@Ce6/miRNA NPs promoted apoptosis by down-regulating Caspase-3 and inhibited tumor cell migration and invasion by down-regulating N-Cadherin. In addition, in vitro and in vivo experiments demonstrated that the TPS@Ce6/miRNA NPs achieved excellent anti-tumor effects. These findings highlighted the enhanced anticancer effects and reduced migration of tumor cells through the synergistic effects of PDT and gene therapy.

Conclusion: Taken together, the targeted co-delivery of Ce6 and miR-34a will facilitate the application of photodynamic and genic nanomedicine in the treatment of aggressive tumors, particularly TNBC.

Keywords: gene therapy; hypoxia; invasion; mitochondrial target; photodynamic therapy; triple-negative breast cancer.


Conflict of interest statement

The authors report no conflicts of interest in this work.

Figures

None
Graphical abstract
Figure 1
Figure 1
Preparation and characterization of the nanoparticles for co-delivery of miR-34a and Ce6. UV−vis absorbance spectrum of TPS@Ce6 NPs or Ce6 in the presence or absence of (a) DMSO, (b) NaCl, and (c) SDS (0.2%, w/v). (d) Protection of miRNA in TPS@Ce6/miRNA NPs against the digestion by RNase. (e) TEM images of TPS@Ce6 NPs with and without co-loaded miRNA. Scale bar, 500 nm.
Figure 2
Figure 2
Cytotoxicity, cellular uptake, and targeted drug delivery in vitro. Cell viability of MDA-MB-231 cells incubated with gradient concentrations of (a) TPS, (b) miRNA, (c) Ce6, TPS@Ce6 NPs, and TPS@Ce6/miRNA NPs with or without NIR irradiation. (mean ± SD, n = 3). The red dashed lines represent a survival rate of MDA-MB-231 cells of 100%, below which the growth of MDA-MB-231 cells is inhibited, and above which the growth of MDA-MB-231 cells is promoted. (d) Confocal laser scanning microscopy (CLSM) images analysis of MDA-MB-231 cellular uptake behaviors after incubation with Ce6, miRNA, and TPS@Ce6/miRNA for 2, 4, 6, or 12 h. Nuclei were stained with DAPI, and miRNA was labeled with a green fluorescent probe. Scale bar: 10 µm. (e) CLSM analyses of MDA-MB-231 lysosomal escape behaviors after incubation with Ce6, TPS@Ce6 NPs, and TPS@Ce6/miRNA with/without NIR irradiation. Lysosomes and nuclei were stained with Lyso-Tracker@ Green and DAPI, respectively. Scale bar, 10 µm. (f) CLSM analyses of MDA-MB-231 mitochondrial targeted behaviors after incubation with Ce6, TPS@Ce6 NPs, and TPS@Ce6/miRNA with NIR irradiation. Mitochondria and nuclei were stained with Mito-Tracker@ Green and DAPI, respectively. Scale bar, 10 µm.
Figure 3
Figure 3
Apoptosis, ROS production, and migration in vitro. (a) Western blotting analysis of Caspase-3CL, P53, and Bcl-XL exposure in MDA-MB-231 cells after various treatments and relative levels of proteins evaluated by integrated optical density (IOD) from Western blotting. (means ± SD, n = 3). *p < 0.05 and **p < 0.01. (b) Intracellular ROS measurement of MDA-MB-231 cells by CLSM after treatment with different drugs in the light, and quantitative mean fluorescence intensity (MFI) analyses. Scale bar: 10 µm. (mean ± SD, n = 3). *p < 0.05, **p < 0.01. (c) RT-qPCR analysis of miR-34a expression in MDA-MB-231 cells following various treatments. (means ± SD, n = 3), ****p < 0.0001. (d) Transwell migration and invasion assay cell images, (e) corresponding average cell number for MDA-MB-231 cells. Scale bar, 100 µm. The average cell number was counted in 3 randomly selected different fields, (means ± SD, n = 3). **p < 0.01. (f) Western blotting analyses of N-Cadherin protein in the MDA-MB-231 cells receiving different treatments, corresponding average relative levels of proteins evaluated by IOD. (mean ± SD, n = 3). ****p < 0.0001.
Figure 4
Figure 4
In vivo anticancer activity. (a) Establishment of the MDA-MB-231 orthotopic tumor model and treatment strategy. (b) Tumor growth curves of different groups (means ± SD, n = 5), ****p < 0.0001. (c) Sacrificed MDA-MB-231 tumor tissues. (n = 5) (d) Ex vivo fluorescence imaging and fluorescence intensity analyses of major organs and tumors excised after injection of Ce6 and TPS@Ce6/miRNA NPs. (means ± SD, n = 3), *p < 0.05. (e) Tumor weight on day 21 (means ± SD, n = 5), ****p < 0.0001. (f) Western blotting analysis of Caspase-3 and N-Cadherin protein expression in tumor tissues and relative levels of corresponding proteins evaluated by IOD. (mean ± SD, n = 3), *p < 0.05, **p < 0.01, ****p < 0.0001. (g) Representative images of H&E staining and TUNEL staining of collected tumors. Scale bar, 50 µm.
Figure 5
Figure 5
Biosafety analysis of TPS@Ce6/miRNA in vivo. (a) Body weight fluctuations of the mice after treatment with injection of different drugs in the presence of light in 21 days (means ± SD, n = 5). (b) Blood biochemical analysis of AST, BUN, ALT, and UA after treatment with injection of different drugs in the presence of light on the 21st day (means ± SD, n = 3), ns indicates no significant difference. (c) H&E staining analysis of heart, liver, spleen, lung, and kidney tissues. Scale bar: 100 µm.

Similar articles

Cited by

References

    1. Singh H. Role of molecular targeted therapeutic drugs in treatment of breast cancer: a review article. Glob Med Genet. 2023;10(02):79–86. doi:10.1055/s-0043-57247 - DOI - PMC - PubMed
    1. Dawson SJ, Provenzano E, Caldas C. Triple negative breast cancers: clinical and prognostic implications. Eur J Cancer. 2009;45(1):27–40. doi:10.1016/s0959-8049(09)70013-9 - DOI - PubMed
    1. Lebert JM, Lester R, Powell E, Seal M, McCarthy J. Advances in the systemic treatment of triple-negative breast cancer. Curr Oncol. 2018;25(11):142–150. doi:10.3747/co.25.3954 - DOI - PMC - PubMed
    1. Witzel I, Oliveira-Ferrer L, Pantel K, Müller V, Wikman H. Breast cancer brain metastases: biology and new clinical perspectives. Breast Cancer Res. 2016;18(1):8. doi:10.1186/s13058-015-0665-1 - DOI - PMC - PubMed
    1. Gobbini E, Ezzalfani M, Dieras V, et al. Time trends of overall survival among metastatic breast cancer patients in the real-life ESME cohort. Eur J Cancer. 2018;96:17–24. doi:10.1016/j.ejca.2018.03.015 - DOI - PubMed