Urinary metabolic profiles during Helicobacter pylori eradication in chronic gastritis
- PMID: 38414611
- PMCID: PMC10895622
- DOI: 10.12998/wjcc.v12.i5.951
Urinary metabolic profiles during Helicobacter pylori eradication in chronic gastritis
Abstract
Background: Helicobacter pylori (H. pylori) infection is a major risk factor for chronic gastritis, affecting approximately half of the global population. H. pylori eradication is a popular treatment method for H. pylori-positive chronic gastritis, but its mechanism remains unclear. Urinary metabolomics has been used to elucidate the mechanisms of gastric disease treatment. However, no clinical study has been conducted on urinary metabolomics of chronic gastritis.
Aim: To elucidate the urinary metabolic profiles during H. pylori eradication in patients with chronic gastritis.
Methods: We applied LC-MS-based metabolomics and network pharmacology to investigate the relationships between urinary metabolites and H. pylori-positive chronic gastritis via a clinical follow-up study.
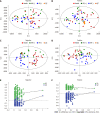
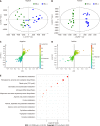
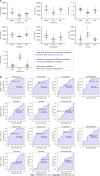
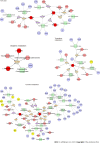
Results: Our study revealed the different urinary metabolic profiles of H. pylori-positive chronic gastritis before and after H. pylori eradication. The metabolites regulated by H. pylori eradication therapy include cis-aconitic acid, isocitric acid, citric acid, L-tyrosine, L-phenylalanine, L-tryptophan, and hippuric acid, which were involved in four metabolic pathways: (1) Phenylalanine metabolism; (2) phenylalanine, tyrosine, and tryptophan biosynthesis; (3) citrate cycle; and (4) glyoxylate and dicarboxylate metabolism. Integrated metabolomics and network pharmacology revealed that MPO, COMT, TPO, TH, EPX, CMA1, DDC, TPH1, and LPO were the key proteins involved in the biological progress of H. pylori eradication in chronic gastritis.
Conclusion: Our research provides a new perspective for exploring the significance of urinary metabolites in evaluating the treatment and prognosis of H. pylori-positive chronic gastritis patients.
Keywords: Helicobacter pylori; LC-MS; chronic gastritis; metabolomics; urinary metabolites.
©The Author(s) 2024. Published by Baishideng Publishing Group Inc. All rights reserved.
Conflict of interest statement
Conflict-of-interest statement: All the authors report no relevant conflicts of interest for this article.
Figures


Similar articles
-
Metabolic dynamics in chronic gastritis: Examining urinary profiles post Helicobacter pylori eradication.World J Clin Cases. 2024 Jun 6;12(16):2698-2700. doi: 10.12998/wjcc.v12.i16.2698. World J Clin Cases. 2024. PMID: 38899295 Free PMC article.
-
[The assessment of nitric oxide metabolites in gastric juice in Helicobacter pylori infected subjects in compliance with grade of inflammatory lesions in gastric mucosa].Pol Merkur Lekarski. 2008 Feb;24(140):95-100. Pol Merkur Lekarski. 2008. PMID: 18634262 Polish.
-
Metabolic alterations in patients with Helicobacter pylori-related gastritis: The H. pylori-gut microbiota-metabolism axis in progression of the chronic inflammation in the gastric mucosa.Helicobacter. 2023 Aug;28(4):e12984. doi: 10.1111/hel.12984. Epub 2023 Apr 25. Helicobacter. 2023. PMID: 37186092
-
[The effect of Helicobacter pylori eradication on chronic gastritis].Nihon Rinsho. 2013 Aug;71(8):1442-8. Nihon Rinsho. 2013. PMID: 23967677 Review. Japanese.
-
Future candidates for indications of Helicobacter pylori eradication: do the indications need to be revised?J Gastroenterol Hepatol. 2012 Feb;27(2):200-11. doi: 10.1111/j.1440-1746.2011.06961.x. J Gastroenterol Hepatol. 2012. PMID: 22098099 Review.
Cited by
-
Metabolic dynamics in chronic gastritis: Examining urinary profiles post Helicobacter pylori eradication.World J Clin Cases. 2024 Jun 6;12(16):2698-2700. doi: 10.12998/wjcc.v12.i16.2698. World J Clin Cases. 2024. PMID: 38899295 Free PMC article.
References
-
- Sung H, Ferlay J, Siegel RL, Laversanne M, Soerjomataram I, Jemal A, Bray F. Global Cancer Statistics 2020: GLOBOCAN Estimates of Incidence and Mortality Worldwide for 36 Cancers in 185 Countries. CA Cancer J Clin. 2021;71:209–249. - PubMed
-
- Rugge M, Genta RM. Staging and grading of chronic gastritis. Hum Pathol. 2005;36:228–233. - PubMed
-
- Lahner E, Esposito G, Pilozzi E, Purchiaroni F, Corleto VD, Di Giulio E, Annibale B. Occurrence of gastric cancer and carcinoids in atrophic gastritis during prospective long-term follow up. Scand J Gastroenterol. 2015;50:856–865. - PubMed
-
- de Vries AC, van Grieken NC, Looman CW, Casparie MK, de Vries E, Meijer GA, Kuipers EJ. Gastric cancer risk in patients with premalignant gastric lesions: a nationwide cohort study in the Netherlands. Gastroenterology. 2008;134:945–952. - PubMed
LinkOut - more resources
Full Text Sources
Research Materials
Miscellaneous

