

Platelet-to-Lymphocyte Ratio (PLR), Neutrophil-to-Lymphocyte Ratio (NLR), Monocyte-to-Lymphocyte Ratio (MLR), and Eosinophil-to-Lymphocyte Ratio (ELR) as Biomarkers in Patients with Acute Exacerbation of Chronic Obstructive Pulmonary Disease (AECOPD)
- PMID: 38414718
- PMCID: PMC10898603
- DOI: 10.2147/COPD.S447519
Platelet-to-Lymphocyte Ratio (PLR), Neutrophil-to-Lymphocyte Ratio (NLR), Monocyte-to-Lymphocyte Ratio (MLR), and Eosinophil-to-Lymphocyte Ratio (ELR) as Biomarkers in Patients with Acute Exacerbation of Chronic Obstructive Pulmonary Disease (AECOPD)
Abstract
Purpose: The study comprehensively evaluated the prognostic roles of the platelet-to-lymphocyte ratio (PLR), neutrophil-to-lymphocyte ratio (NLR), monocyte-to-lymphocyte ratio (MLR), basophil-to-lymphocyte ratio (BLR), and eosinophil-to-lymphocyte ratio (ELR) in patients with acute exacerbation of chronic obstructive pulmonary disease (AECOPD).
Patients and methods: Six hundred and nineteen patients with AECOPD and 300 healthy volunteers were retrospectively included into the study. The clinical characteristics of the patients with AECOPD and the complete blood counts (CBCs) of the healthy volunteers were collected. The associations of PLR, NLR, MLR, BLR, and ELR with airflow limitation, hospital length of stay (LOS), C-reactive protein (CRP), and in-hospital mortality in patients with AECOPD were analyzed.
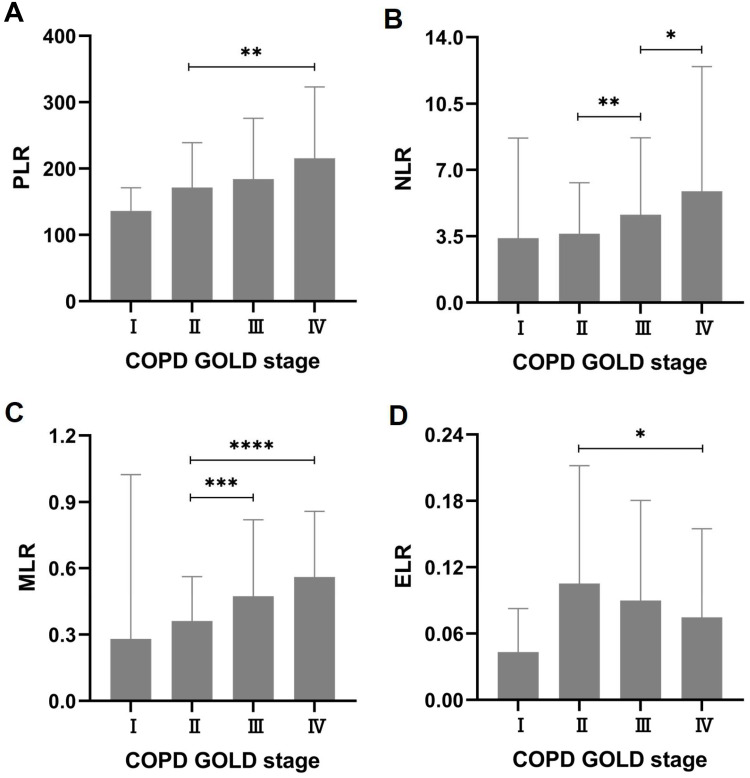
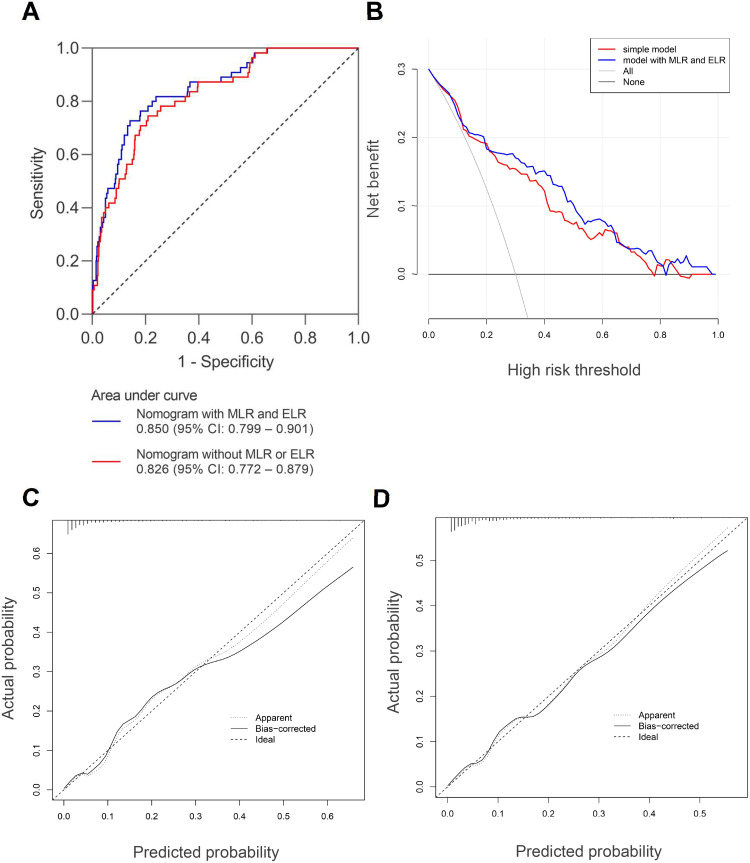
Results: Compared with the healthy volunteers, PLR, NLR, MLR, BLR, and ELR were all elevated in COPD patients under stable condition. PLR, NLR, MLR, and BLR were further elevated while ELR was lowered during exacerbation. In the patients with AECOPD, PLR, NLR, and MLR were positively correlated with hospital LOS as well as CRP. In contrast, ELR was negatively correlated with hospital LOS as well as CRP. Elevated PLR, NLR, and MLR were all associated with more severe airflow limitation in AECOPD. Elevated PLR, NLR, and MLR were all associated with increased in-hospital mortality while elevated ELR was associated with decreased in-hospital mortality. Binary logistic regression analysis showed that smoking history, FEV1% predicted, pneumonia, pulmonary heart disease (PHD), uric acid (UA), albumin, and MLR were significant independent predictors ofin-hospital mortality. These predictors along with ELR were used to construct a nomogram for predicting in-hospital mortality in AECOPD. The nomogram had a C-index of 0.850 (95% CI: 0.799-0.901), and the calibration curve, decision curve analysis (DCA), and clinical impact curve (CIC) further demonstrated its good predictive value and clinical applicability.
Conclusion: In summary, PLR, NLR, MLR, and ELR served as useful biomarkers in patients with AECOPD.
Keywords: healthy volunteers; in-hospital mortality; length of stay; nomogram; pneumonia; pulmonary heart disease.
© 2024 Liao et al.
Conflict of interest statement
Author Ke-Wei Zhu was employed by GuangZhou BaiYunShan Pharmaceutical Holdings CO.,LTD. BaiYunShan Pharmaceutical General Factory, Guangzhou, People’s Republic of China. The remaining authors declare that the research was conducted in the absence of any commercial or financial relationships that could be construed as a potential conflict of interest.
Figures


Similar articles
-
Neutrophil-to-Lymphocyte Ratio (NLR), Platelet-to-Lymphocyte Ratio (PLR) and Monocyte-to-Lymphocyte Ratio (MLR) as Biomarkers in Diagnosis Evaluation of Acute Exacerbation of Chronic Obstructive Pulmonary Disease: A Retrospective, Observational Study.Int J Chron Obstruct Pulmon Dis. 2024 Apr 15;19:933-943. doi: 10.2147/COPD.S452444. eCollection 2024. Int J Chron Obstruct Pulmon Dis. 2024. PMID: 38646605 Free PMC article.
-
The Clinical significance of Peripheral Blood-related Inflammatory Markers in patients with AECOPD.Immunobiology. 2025 May;230(3):152903. doi: 10.1016/j.imbio.2025.152903. Epub 2025 Apr 23. Immunobiology. 2025. PMID: 40286421
-
Treatment of Plaque Psoriasis with Guselkumab Reduces Systemic Inflammatory Burden as Measured by Neutrophil/Lymphocyte Ratio, Platelet/Lymphocyte Ratio, and Monocyte/Lymphocyte Ratio: A post hoc Analysis of Three Randomised Clinical Trials.Dermatology. 2025;241(3):272-286. doi: 10.1159/000545148. Epub 2025 Apr 10. Dermatology. 2025. PMID: 40209685 Free PMC article. Clinical Trial.
-
Association between the immune-inflammation index and the severity and clinical outcomes of patients with inflammatory bowel disease: a systematic review and meta-analysis.BMC Gastroenterol. 2025 May 29;25(1):414. doi: 10.1186/s12876-025-04033-4. BMC Gastroenterol. 2025. PMID: 40442599 Free PMC article.
-
Associations of novel complete blood count-derived inflammatory markers with psoriasis: a systematic review and meta-analysis.Arch Dermatol Res. 2024 May 24;316(6):228. doi: 10.1007/s00403-024-02994-2. Arch Dermatol Res. 2024. PMID: 38787437
Cited by
-
Prognostic value of the platelet, neutrophil, monocyte, basophil, and eosinophil to lymphocyte ratios in patients with severe community-acquired pneumonia (SCAP).Sci Rep. 2024 Dec 6;14(1):30406. doi: 10.1038/s41598-024-80727-1. Sci Rep. 2024. PMID: 39638829 Free PMC article.
-
Development and validation of the machine learning model for acute exacerbation of chronic obstructive pulmonary disease prediction based on inflammatory biomarkers.Front Med (Lausanne). 2025 Aug 1;12:1616712. doi: 10.3389/fmed.2025.1616712. eCollection 2025. Front Med (Lausanne). 2025. PMID: 40823588 Free PMC article.
-
Central adiposity and α-klotho: inflammatory mechanisms underlying aging biomarkers related to body roundness index.Lipids Health Dis. 2025 Apr 10;24(1):136. doi: 10.1186/s12944-025-02541-6. Lipids Health Dis. 2025. PMID: 40211310 Free PMC article.
-
Predictive value of neutrophil-lymphocyte ratio for all-cause mortality in patients with chronic obstructive pulmonary disease: a systematic review and meta-analysis.BMC Pulm Med. 2025 Apr 29;25(1):206. doi: 10.1186/s12890-025-03677-y. BMC Pulm Med. 2025. PMID: 40301774 Free PMC article.
-
Impact of preoperative inflammatory biomarkers on postoperative pneumonia and one-month pulmonary imaging changes after surgery for non-small cell lung cancer.Front Oncol. 2025 Mar 18;15:1489068. doi: 10.3389/fonc.2025.1489068. eCollection 2025. Front Oncol. 2025. PMID: 40171252 Free PMC article.
References
Publication types
MeSH terms
Substances
LinkOut - more resources
Full Text Sources
Medical
Research Materials
Miscellaneous
