

Dynamics of brain-muscle networks reveal effects of age and somatosensory function on gait
- PMID: 38414847
- PMCID: PMC10897916
- DOI: 10.1016/j.isci.2024.109162
Dynamics of brain-muscle networks reveal effects of age and somatosensory function on gait
Abstract
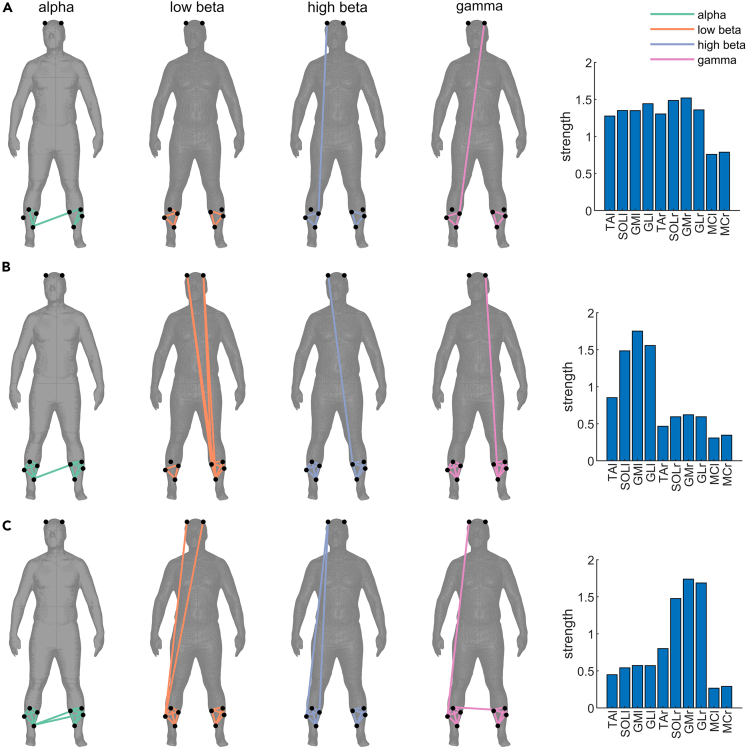
Walking is a complex motor activity that requires coordinated interactions between the sensory and motor systems. We used mobile EEG and EMG to investigate the brain-muscle networks involved in gait control during overground walking in young people, older people, and individuals with Parkinson's disease. Dynamic interactions between the sensorimotor cortices and eight leg muscles within a gait cycle were assessed using multivariate analysis. We identified three distinct brain-muscle networks during a gait cycle. These networks include a bilateral network, a left-lateralized network activated during the left swing phase, and a right-lateralized network active during the right swing. The trajectories of these networks are contracted in older adults, indicating a reduction in neuromuscular connectivity with age. Individuals with the impaired tactile sensitivity of the foot showed a selective enhancement of the bilateral network, possibly reflecting a compensation strategy to maintain gait stability. These findings provide a parsimonious description of interindividual differences in neuromuscular connectivity during gait.
Keywords: Age; Neuroscience; Techniques in neuroscience.
© 2024 The Author(s).
Conflict of interest statement
The authors declare no competing interests.
Figures


Similar articles
-
Cortico-Subthalamic Field Potentials Support Classification of the Natural Gait Cycle in Parkinson's Disease and Reveal Individualized Spectral Signatures.eNeuro. 2022 Nov 11;9(6):ENEURO.0325-22.2022. doi: 10.1523/ENEURO.0325-22.2022. Print 2022 Nov-Dec. eNeuro. 2022. PMID: 36270803 Free PMC article.
-
Contributions to the understanding of gait control.Dan Med J. 2014 Apr;61(4):B4823. Dan Med J. 2014. PMID: 24814597 Review.
-
Dynamics of corticospinal motor control during overground and treadmill walking in humans.J Neurophysiol. 2018 Sep 1;120(3):1017-1031. doi: 10.1152/jn.00613.2017. Epub 2018 May 30. J Neurophysiol. 2018. PMID: 29847229
-
Corticomuscular control of walking in older people and people with Parkinson's disease.Sci Rep. 2020 Feb 19;10(1):2980. doi: 10.1038/s41598-020-59810-w. Sci Rep. 2020. PMID: 32076045 Free PMC article.
-
Control of human gait stability through foot placement.J R Soc Interface. 2018 Jun;15(143):20170816. doi: 10.1098/rsif.2017.0816. J R Soc Interface. 2018. PMID: 29875279 Free PMC article. Review.
Cited by
-
A multimodal biomechanical and eye-tracking dataset of suprapostural coordination in healthy young adults.Sci Data. 2025 Jul 29;12(1):1311. doi: 10.1038/s41597-025-05642-0. Sci Data. 2025. PMID: 40730588 Free PMC article.
-
Electrophysiological Approaches to Understanding Brain-Muscle Interactions During Gait: A Systematic Review.Bioengineering (Basel). 2025 Apr 29;12(5):471. doi: 10.3390/bioengineering12050471. Bioengineering (Basel). 2025. PMID: 40428090 Free PMC article. Review.
-
Reduced Motor Individuality in Older Adults Revealed by Network-Based Gait Fingerprinting.Medicina (Kaunas). 2025 Aug 12;61(8):1454. doi: 10.3390/medicina61081454. Medicina (Kaunas). 2025. PMID: 40870499 Free PMC article.
-
Effects of visual input on contralateral foot touch and postural stability during one-leg standing in older adults with chronic low back pain.Eur Spine J. 2025 Jun 26. doi: 10.1007/s00586-025-09083-6. Online ahead of print. Eur Spine J. 2025. PMID: 40562996
-
Neurobiological mechanism of music improving gait disorder in patients with Parkinson's disease: a mini review.Front Neurol. 2025 Jan 3;15:1502561. doi: 10.3389/fneur.2024.1502561. eCollection 2024. Front Neurol. 2025. PMID: 39830207 Free PMC article. Review.
References
-
- Nielsen J.B. How we walk: Central control of muscle activity during human walking. Neuroscientist. 2003;9:195–204. - PubMed
LinkOut - more resources
Full Text Sources
