. 2024 Feb 6;27(3):109145.
doi: 10.1016/j.isci.2024.109145. eCollection 2024 Mar 15.

Microglia-endothelial cross-talk regulates diabetes-induced retinal vascular dysfunction through remodeling inflammatory microenvironment

Affiliations

Microglia-endothelial cross-talk regulates diabetes-induced retinal vascular dysfunction through remodeling inflammatory microenvironment

Shuai Ben et al. iScience. .

Abstract

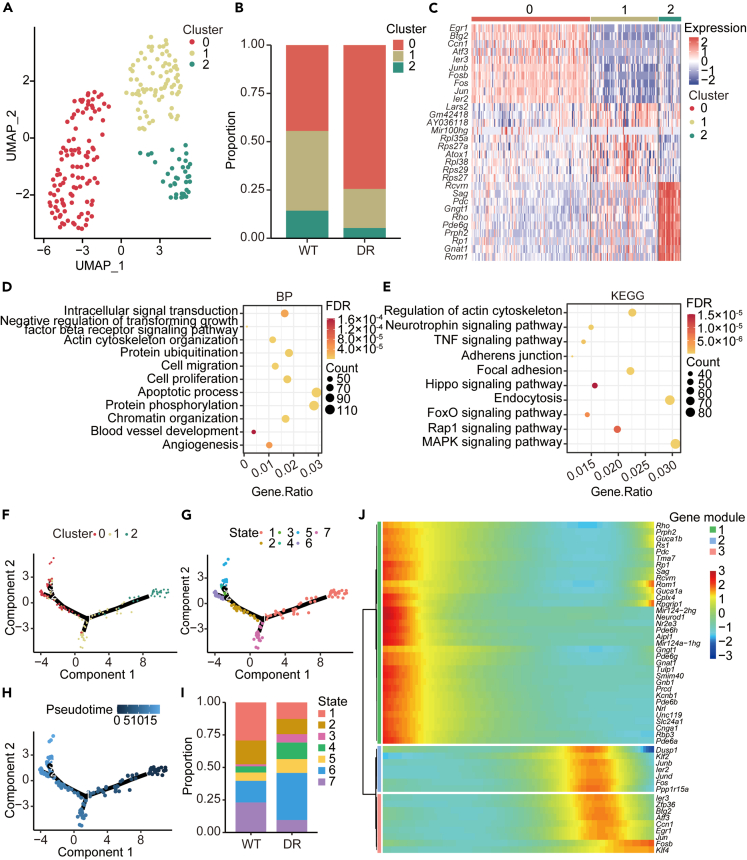
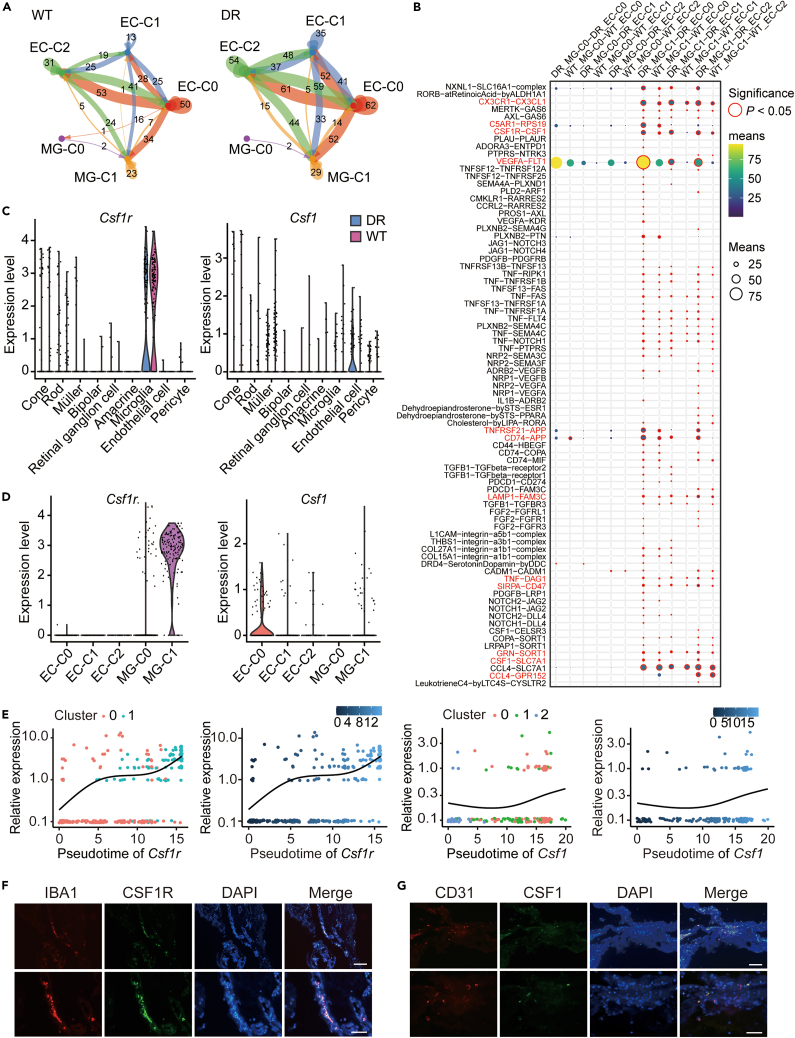
Inflammation-mediated crosstalk between neuroglial cells and endothelial cells (ECs) is a fundamental feature of many vascular diseases. Nevertheless, the landscape of inflammatory processes during diabetes-induced microvascular dysfunction remains elusive. Here, we applied single-cell RNA sequencing to elucidate the transcriptional landscape of diabetic retinopathy (DR). The transcriptome characteristics of microglia and ECs revealed two microglial subpopulations and three EC populations. Exploration of intercellular crosstalk between microglia and ECs showed that diabetes-induced interactions mainly participated in the inflammatory response and vessel development, with colony-stimulating factor 1 (CSF1) and CSF1 receptor (CSF1R) playing important roles in early cell differentiation. Clinically, we found that CSF1/CSF1R crosstalk dysregulation was associated with proliferative DR. Mechanistically, ECs secrete CSF1 and activate CSF1R endocytosis and the CSF1R phosphorylation-mediated MAPK signaling pathway, which elicits the differentiation of microglia and triggers the secretion of inflammatory factors, and subsequently foster angiogenesis by remodeling the inflammatory microenvironment through a positive feedback mechanism.

Keywords: Biological sciences; Diabetology; Endocrinology; Natural sciences.


Conflict of interest statement

The authors declare no competing interests.

Figures

None
Graphical abstract
Figure 1
Figure 1
Single-cell transcriptomic landscape of retinal cells from mice with streptozotocin (STZ)-induced diabetes obtained by scRNA-seq and cell cluster identification (A) A schematic workflow illustrating the overall strategy employed in scRNA-seq. (B) UMAP visualization of all annotated major cell types in the retina. The cells are color-coded according to cell type. (C) A bubble chart is presented to display the marker genes associated with each cluster. The size of each dot corresponds to the fraction of cells, while the color represents the mean gene expression in either the high or low group. (D) Bar plots indicates the relative proportion of each cluster.
Figure 2
Figure 2
Single-cell transcriptome characteristics of microglia (A) Subclustering of microglia on the UMAP plots. (B) Bar plots indicates the relative proportion of each microglia cluster in retinal tissues from WT and DR mice. (C) Heatmap of microglia and the top 10 expressed markers. (D) Gene Ontology (GO) biological process (BP) enrichment of microglia cluster 1. (E) Kyoto Encyclopedia of Genes and Genomes (KEGG) pathway analysis of microglia cluster 1. (F) Pseudotime trajectories of microglia according to Monocle 3. Display by cell clusters. (G) Pseudotime trajectories showing the differentiation states of microglia. There is one branch node divided into three states. (H) The progression from the initial to the final state of microglia is illustrated, with the intensity of the blue color indicating the maturation of the cell state along pseudotime. (I) A heatmap is presented to demonstrate the gene expression changes along pseudotime for microglia. The color gradient ranging from blue to red indicates the expression levels of each gene, with blue representing low expression and red representing high expression.
Figure 3
Figure 3
Single-cell transcriptome characteristics of ECs (A) Subclustering of ECs on the UMAP plots of the scRNA-seq datasets. (B) Bar plots showing the relative proportion of each EC cluster from retinal tissues of WT and DR mice. (C) Heatmap of ECs and the top 10 expressed markers. (D) GO BP enrichment of cluster 0. (E) KEGG pathway analysis of cluster 0. (F) Pseudotime trajectories of ECs according to Monocle 3. Display by cell clusters. (G) Pseudotime trajectories showing the differentiation states of ECs. There are 3 branch nodes divided into 7 states. (H) The transition from the initial to the final state of ECs is depicted, with the brightness of the blue color indicating the "older" of the cell state in pseudotime. (I) Bar plots showing the relative proportion of each EC state from retinal tissues of WT and DR mice. (J) A heatmap is presented to demonstrate the gene expression changes along pseudotime for ECs. The progression from the initial to the final state of microglia is illustrated, with the intensity of the blue color indicating the maturation of the cell state along pseudotime.
Figure 4
Figure 4
Cell‒cell interactions between microglia and ECs and clinical relevance of CSF1/CSF1R dysregulation in retinal vascular diseases (A) A circle plot is used to visualize the predicted ligand-receptor pairs between various subsets of ECs and microglia in both diabetic and normal retinal samples. (B) A dot plot is employed to illustrate the predicted interactions between different subsets of ECs and microglia in retinal samples. (C) Violin plots depict the expression distribution of Csf1 and Csf1r across all cell types in tissues of both WT and DR tissues. (D) Violin plots display the expression distribution of Csf1 and Csf1r specifically in subclusters of ECs and microglia. (E) Changes in the expression levels of Csf1 in subclusters of ECs and Csf1r in subclusters of microglia based on pseudotime trajectory analysis. (F and G) Immunofluorescence assays were performed to assess the expression of CSF1R in microglia (Iba1, F) and CSF1 in ECs (CD31, G) in the proliferative membranes of patients with PDR. Scale bar: 100 μm.
Figure 5
Figure 5
The interaction between microglia and ECs relays on CSF1/CSF1R under diabetic conditions (A) CSF1 protein levels in the culture supernatants of HRVECs was measured by ELISA. p < 0.05, high glucose (HG) group versus normal glucose (NG) group. n = 5/group. (B) Western blot analysis was conducted to quantify the levels of CSF1 protein. The protein level of CSF1 was assessed and analyzed relative to the control. p < 0.05, HG group versus NG group. (C) HMC3 cells were divided into normal controls (without any treatments), cells cocultured with HRVECs under NG, cells cocultured with HRVECs under HG, and cells cocultured with HRVECs under HG + PLX3397 (100 μM for 24 h). The relative protein levels of p-CSF1R, CSF1R, and GAPDH were analyzed. n = 4/group. (D) The pseudotime differentiation trajectories of microglia revealed alterations in the expression levels of Ilb, Tgfb1, and Tnf genes. (E) HMC3 cells were categorized into the following groups: normal control, human CSF1 recombinant protein (CSF1 Ab), human CSF1 Ab + PLX3397 (100 μM for 24 h), coculture with HRVECs under NG conditions, coculture with HRVECs under HG conditions, coculture with HRVECs under HG conditions with the addition of CSF1-neutralizing antibody (0.2 μg/mL for 24 h), and coculture with HRVECs under HG conditions with the addition of PLX3397 (100 μM for 24 h). Transwell assays were conducted to evaluate the migratory ability of HMC3 cells. Scale bar: 20 μm. p < 0.05 versus the normal control group. #p < 0.05 versus the coculture under NG group. &p < 0.05 versus the coculture under HG conditions. n = 4/group. (F–H) HRVECs were categorized into the following groups: normal control (NC), coculture with HMC3 cells under NG conditions, coculture with HMC3 cells under HG conditions, coculture with HMC3 cells under HG conditions with the addition of CSF1-neutralizing antibody (0.2 μg/mL for 24 h), and coculture with HMC3 cells under HG conditions with the addition of PLX3397 (100 μM for 24 h). (F) Tube formation assays were performed to measure the tubular formation ability of HRVECs. Scale bar: 50 μm. (G) Spheroid-based sprouting assays were performed to measure the sprouting ability of HRVECs. Scale bar: 50 μm. (H) Transwell assays were conducted to assess the migratory capacity of HRVECs. Scale bar: 20 μm. p < 0.05 versus the coculture normal group. #p < 0.05 versus the coculture under HG conditions. n = 4/group.
Figure 6
Figure 6
CSF1R signaling blockade attenuates the inflammatory response and vascular dysfunction in vivo (A) Diabetic C57BL/6J mice were fed 50 mg/kg PLX3397 formulated chow, 100 mg/kg PLX3397 formulated chow, or control chow (DR). Wild-type C57BL/6J mice (WT) fed control chow served as controls. (B) The flow cytometry was performed on single cell suspension of the whole retina from the mouse model at different time points. n = 5/group. (C) Immunofluorescence staining of Iba1 was performed to detect the proliferation of microglia in retinal flat mounts. Scale bar: 200 μm (top), 100 μm (bottom). p < 0.05 versus the normal control group. #p < 0.05 versus the DR group. &p < 0.05 between the DR + PLX3397 group. n = 5/group. (D) A fluorescein isothiocyanate (FITC)-coupled concanavalin A lectin perfusion assay was performed to detect the infiltration of leukocytes in the retinal vasculature. White arrows indicate adherent leukocytes. Scale bar: 100 μm. p < 0.05 versus the normal control group. #p < 0.05 versus the DR group. &p < 0.05 between the DR + PLX3397 group. (E) ELISA was performed to detect the protein levels of IL-6, IL-1β, TNF-a, and MCP-1 in retinal lysates. p < 0.05. (F) Vascular permeability was evaluated by examining Evans blue dye leakage in retinal whole mounts. The presented images serve as representative examples. Scale bar: 1 mm. p < 0.05 versus the normal control group. #p < 0.05 versus the DR group. &p < 0.05 between the DR + PLX3397 group. (G) Retinal acellular capillaries were detected by retinal trypsin digestion. Yellow arrows indicate acellular capillaries. Scale bar: 40 μm. p < 0.05 versus the normal control group. #p < 0.05 versus the DR group. &p < 0.05 between the DR + PLX3397 group.
Figure 7
Figure 7
CSF1 activates CSF1R endocytosis and the p-CSF1R-mediated MAPK signaling pathway in microglia (A) HMC3 cells were treated with PLX3397 or left untreated. Then, HMC3 cells were stimulated with or without CSF1 for 20 min. The expression levels of p-CSF1R, CSF1R, p-ERK1/2, ERK1/2, and GAPDH were detected by western blotting. p < 0.05. Each data point corresponds to quantification obtained from a single western blot analysis. n = 3/group. (B) HMC3 cells were treated with PLX3397 (100 μM) or left untreated. Then, HMC3 cells were stimulated with or without CSF1 for 20 min. The expression levels of surface CSF1R, total CSF1R, and GAPDH were detected by western blotting. Data points represent quantification from a single western blotting. n = 3/group. (C) Following endocytosis, CSF1R undergoes trafficking to the lysosome for degradation. The degradation of CSF1R is inhibited by the presence of PLX3397 (100 μM). p < 0.05. Each data point corresponds to quantification obtained from a single western blot analysis. n = 3/group.

Similar articles

Cited by

References

    1. Klemm F., Maas R.R., Bowman R.L., Kornete M., Soukup K., Nassiri S., Brouland J.-P., Iacobuzio-Donahue C.A., Brennan C., Tabar V., et al. Interrogation of the Microenvironmental Landscape in Brain Tumors Reveals Disease-Specific Alterations of Immune Cells. Cell. 2020;181:1643–1660.e17. doi: 10.1016/j.cell.2020.05.007. - DOI - PMC - PubMed
    1. Amersfoort J., Eelen G., Carmeliet P. Immunomodulation by endothelial cells - partnering up with the immune system? Nat. Rev. Immunol. 2022;22:576–588. doi: 10.1038/s41577-022-00694-4. - DOI - PMC - PubMed
    1. Weber E.W., Maus M.V., Mackall C.L. The Emerging Landscape of Immune Cell Therapies. Cell. 2020;181:46–62. doi: 10.1016/j.cell.2020.03.001. - DOI - PMC - PubMed
    1. Fan W., Huang W., Chen J., Li N., Mao L., Hou S. Retinal microglia: Functions and diseases. Immunology. 2022;166:268–286. doi: 10.1111/imm.13479. - DOI - PubMed
    1. Hanisch U.-K., Kettenmann H. Microglia: active sensor and versatile effector cells in the normal and pathologic brain. Nat. Neurosci. 2007;10:1387–1394. doi: 10.1038/nn1997. - DOI - PubMed