. 2024 Feb 9;27(3):109157.
doi: 10.1016/j.isci.2024.109157. eCollection 2024 Mar 15.

Coordinated metabolic responses to cyclophilin D deletion in the developing heart

Affiliations

Coordinated metabolic responses to cyclophilin D deletion in the developing heart

Gisela Beutner et al. iScience. .

Abstract

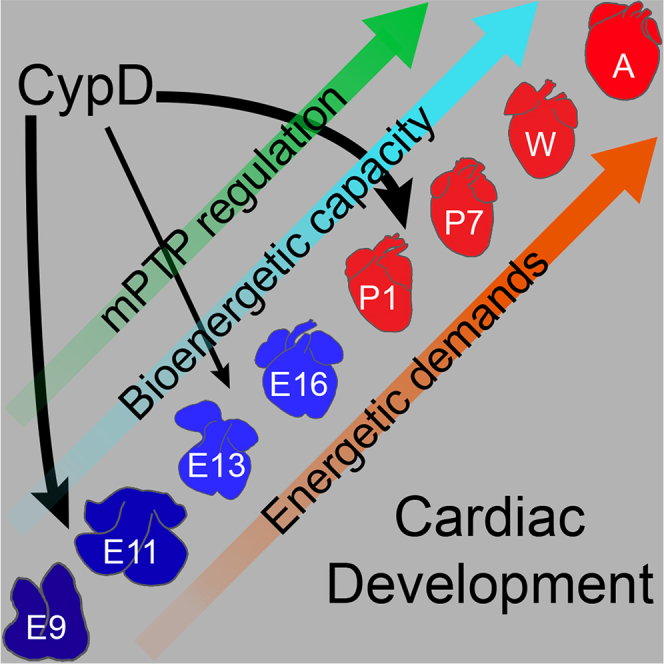
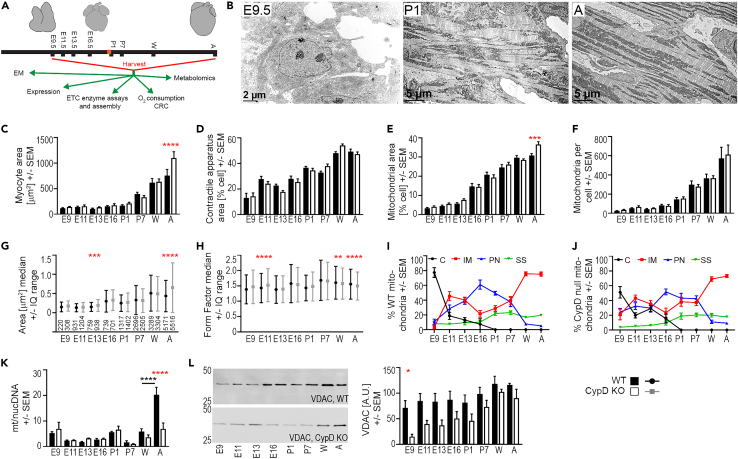
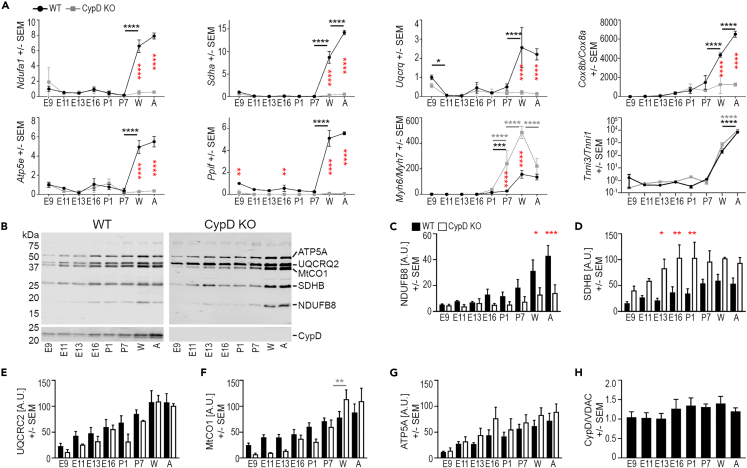
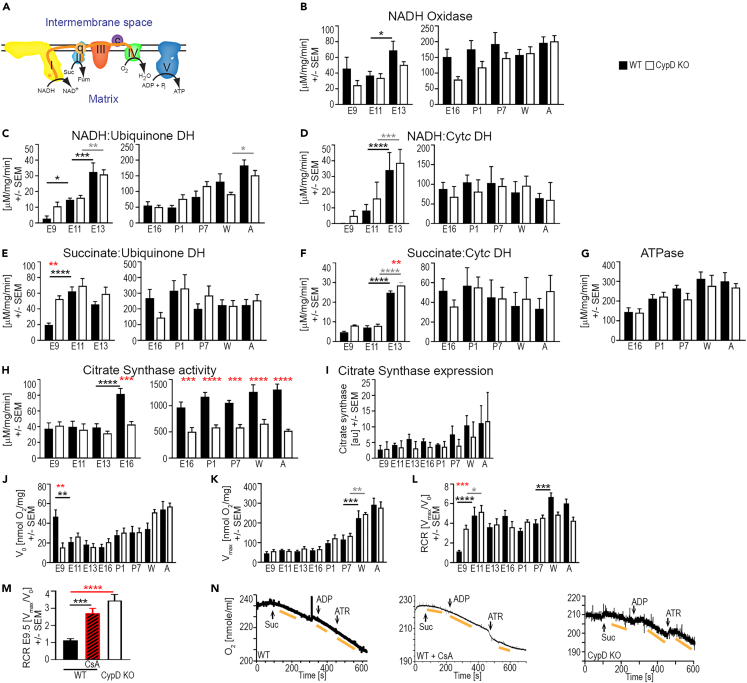
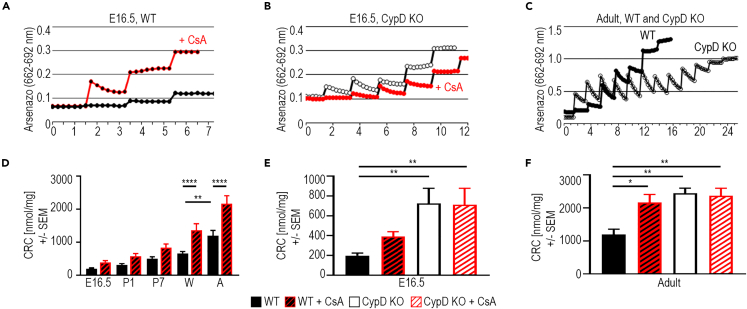
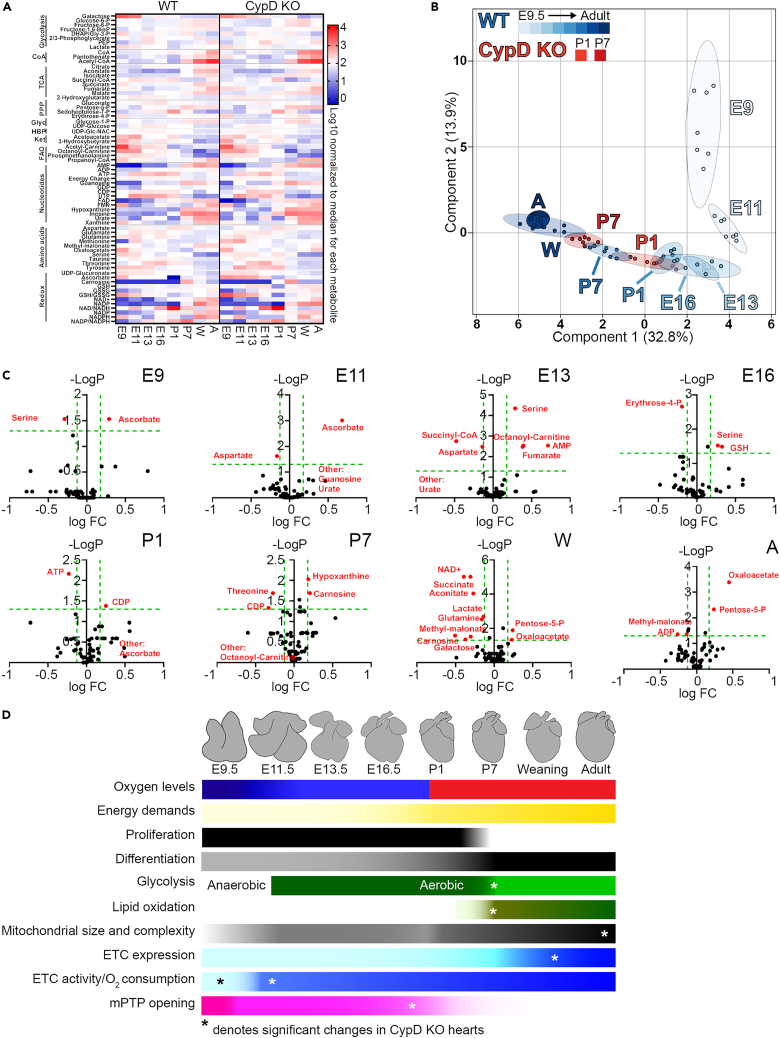
In the embryonic heart, the activation of the mitochondrial electron transport chain (ETC) coincides with the closure of the cyclophilin D (CypD) regulated mitochondrial permeability transition pore (mPTP). However, it remains to be established whether the absence of CypD has a regulatory effect on mitochondria during cardiac development. Using a variety of assays to analyze cardiac tissue from wildtype and CypD knockout mice from embryonic day (E)9.5 to adult, we found that mitochondrial structure, function, and metabolism show distinct transitions. Deletion of CypD altered the timing of these transitions as the mPTP was closed at all ages, leading to coupled ETC activity in the early embryo, decreased citrate synthase activity, and an altered metabolome particularly after birth. Our results suggest that manipulating CypD activity may control myocyte proliferation and differentiation and could be a tool to increase ATP production and cardiac function in immature hearts.

Keywords: Biological sciences; Cell biology; Metabolomics; Physiology.


Conflict of interest statement

GAPJr is the Inventor and the University of Rochester is the Assignee of United States Patent No. “US 10,179,161 B2” dated 1/15/19 and entitled “Compositions and methods for enhancing cardiac function in the neonate” that is related to the work reported herein. All other authors declare no competing interests.

Figures

None
Graphical abstract
Figure 1
Figure 1
Myocyte and mitochondrial morphology and biogenesis during cardiac development (A) Graphical representation of work flow with silhouettes of hearts at various ages. Birth is marked in red on the timeline. (B) Representative electron micrographs of E9.5, P1, and Adult (A) WT cardiac myocytes. (C–J) Morphometry was performed using low- and high-powered electron micrographs, a tablet to outline cellular structures, and Fiji/ImageJ. Shape descriptors were copied into Excel spreadsheets and data was compiled for statistical analysis. Myocyte morphometry from electron micrographs shows changes in cell size (C), contractile apparatus area (D) and mitochondrial area (E) as a percentage of cell area, and mitochondrial number per cell (F) at each age and genotype (WT, CypD KO). Morphometry of individual mitochondria shows changes in mitochondrial area (G) and form factor (H) during development. Plot of mitochondria subgroups (% of total mitochondrial number/cell (D)) in WT (I) and CypD KO (J) mitochondria (C-cytoplasmic, IM-intermyofibrillar, PN-perinuclear, SS-subsarcolemmal). (K) Mitochondrial to nuclear (mt/nuc) DNA ratio of WT and CypD KO hearts at different ages using primers to mt-CO1 and 18s rRNA for qPCR. (L) Expression of the voltage-dependent anion channel (VDAC) in homogenates from hearts at each age and genotype analyzed by densitometry of denaturing immunoblots normalized to protein loading (A.U., arbitrary units). Data presented as Mean ± SEM and analyzed by one-way ANOVA with Sidak’s multiple comparison test (C-F, I-L) or Median +/− interquartile (IQ) range and Kruskal-Wallis with Dunn’s multiple comparison test (G, H) to compare data between WT and CypD KO cells at each age (red stars, C-H, K, L) and for differences between successive ages of the same genotype (black stars/bar, K). Only significant differences noted, ∗p <0.05, ∗∗p < 0.01, ∗∗∗p < 0.001, ∗∗∗∗p < 0.0001; N: C-F, I, J = 9 cells or 18 cells for E11.5 and E13.5, G-H presented in G above the X axis, K = 3–6, L = 3. See also Figures S1–S6.
Figure 2
Figure 2
CypD deletion alters mitochondrial gene and protein expression in the developing heart (A) qRT-PCR analyses of mitochondrial (Ndufa1, Sdha, Uqcrq, Cox8a, Cox8b, Atp5e, and Ppif) and contractile apparatus (Myh6, Myh7, Tnni1, Tnni3) gene expression. Data for Cox8b/a, Myh6/7, and Tnni3/1 are expressed as ratios and all data was normalized to the expression of Polr2A. (B–G) Representative immunoblot images (B) and graphs of the expression of NDUFB6 (C), SDHB (D), UQCRC2 (E), MtCO1 (F), and ATP5A (G) and CypD (H) demonstrate changes in proteins levels during development in tissue homogenates. Data from immunoblots for ETC proteins (C-G) was normalized to protein loading (A.U., arbitrary units) and not VDAC labeling due to data in Figure 1L. Note: an additional lane of adult homogenate in the top WT panel was removed from between E13.5 and E16.5 for clarity. (H) CypD protein expression normalized to VDAC expression is stable during cardiac development in WT hearts. Data is presented as Mean ± SEM and analyzed by one-way ANOVA with Tukey’s or Sidak’s multiple comparison test to compare data between WT and CypD KO cells at each age (red stars in A) and also between successive ages of the same genotype (WT-underlined black stars, CypD KO-underlined gray stars). Only significant differences noted, ∗p < 0.05, ∗∗p < 0.01, ∗∗∗p < 0.001, ∗∗∗∗p < 0.0001; N: A = 3–6, C-H = 3 hearts/age and genotype.
Figure 3
Figure 3
Deletion of CypD alters embryonic ETC, OXPHOS, and citrate synthase activity throughout development (A) Schematic of ETC activity and electron flux (e); c/Cytc: cytochrome c, ETC complexes: I, II, III, IV and V, ubiquinone: q. (B–G) Assays of ETC Cx I, II, and V activity in embryonic heart homogenates or fetal and postnatal isolated heart mitochondria (left and right side of panels, respectively) were performed in a spectrophotometer and represent: NADH oxidase (B, NADH->NAD+ in Cx I), NADH:Ubiquinone dehydrogenase (DH) (C, electron flux from NADH through Cx I to q), NADH:Cytochrome c DH (D, electron flux from NADH through Cx I to Cytc), Succinate:Ubiquinone DH (E, electron flux from succinate to q via Cx II), Succinate:Cytc DH (F, electron flux from succinate to Cytc), and ATP hydrolase (G, reverse reaction of ATP synthase/Cx V). (H) Citrate synthase activity in embryonic homogenates (left) and isolated mitochondria from fetal to adult hearts (right). (I) Citrate synthase protein expression in homogenates from embryonic to adult hearts by immunoblotting and normalized to protein loading (au, arbitrary units). (J–N) OXPHOS activity was measured in a Clark oxygen electrode in homogenates from hearts throughout development. (J–L) Substrate-mediated oxygen consumption (V0, succinate for E9.5-E11.5, malate/glutamate E13.5-A), maximal oxygen consumption (Vmax, substrate +ADP), and respiratory control ratio (RCR, = Vmax/V0, a measure of coupling electron transport to ATP generation) values at each age and genotype. (M and N) Composite RCR data (M) and representative traces (N) of oxygen consumption in WT (+/−1 μm CsA) and CypD KO E9.5 heart homogenates; arrows in N denote the addition of 10 mM succinate (Suc), 1 mM ADP, and 0.1 mM atractyloside (ATR). V0 was measured after adding succinate, Vmax was measured after adding ADP, and rates of oxygen consumption are denoted by yellow bars. Data is presented as Mean ± SEM and analyzed by one-way ANOVA with Tukey’s or Sidak’s multiple comparison test to compare data between WT and CypD KO hearts (red stars) at each age and also between successive ages of the same genotype (WT-underlined black stars, CypD KO-underlined gray stars). ∗p < 0.05, ∗∗p < 0.01, ∗∗∗p < 0.001, ∗∗∗∗p < 0.0001. N: (B–H) 3–12 (I) 3, and (J-M) 6–15 samples per age/genotype.
Figure 4
Figure 4
mPTP open probability decreases during cardiac development The calcium retention capacity (CRC) is a measure of mPTP. Mitochondria are exposed to pulses of calcium in the presence of arsenazo III in the solution, which fluoresces upon the binding of calcium. With each pulse, fluorescence increases and then decreases as mitochondria sequester the calcium until the calcium concentration in the mitochondrial matrix rises to a level that opens the mPTP (the CRC [nmol Ca2+/mg mitochondrial protein]), releasing all the calcium and causing a plateau in the arsenazo fluorescence. (A–C) Representative CRC traces from E16.5 WT +/−1 μM CsA (A), E16.5 CypD KO +/−1 μM CsA (B), and Adult WT and CypD KO (C) heart mitochondria. Calcium pulses were 10 μM in E16.5 and 20 μM in Adult experiments. (D) CRC of WT mitochondria from E16.5, P1, P7, weanling (W) and adult (A) hearts, +/− 1 μM CsA. (E and F) CRC levels in mitochondria from WT and CypD KO E16.5 (E) and adult (F) hearts +/− treatment with 1 μM CsA. Data in D-F is presented as Mean ± SEM and analyzed by one-way ANOVA with Tukey’s or Sidak’s multiple comparison test. ∗p < 0.05, ∗∗p < 0.01, ∗∗∗∗p < 0.0001. N: 3–5 samples per condition.
Figure 5
Figure 5
Metabolomic profile of WT and CypD KO hearts during development Sixty four metabolites were recovered by steady state, LC MS/MS metabolomics from 7 hearts at each indicated age (E9.5, E11.5, E13.5, E16.5, P1, P7, W, A) and each genotype (WT, CypD KO). (A) Heatmap of mean data for each age and genotype. Metabolites are grouped along the Y axis as metabolic pathways. (B) Sparse partial least squares-discriminant analysis plots of all WT groups and P1 and P7 CypD KO groups shows individual specimens represented as small circles and groups as larger, similarly colored ovals, while each group is marked by age. Percentage of variability explained for Components 2 and 1 are as labeled. All metabolomics data were analyzed together in MetaboAnalyst to create this plot, but some groups (CypD KO E9.5, E11.5, E13.5, E16.5, W, A) were selectively removed to make the plot legible. WT and CypD KO data are shown separately in additional plots in Figure S7C. (C) Volcano plots of metabolite changes in WT versus CypD KO hearts at each age during development, reported as the -log p value versus the log FC (fold change, CypD KO values/WT values) with green dashed lines demarcating a q value of 0.05 (horizontal) and FC of 0.75 and 1.5 (vertical). Significantly different metabolites are marked by red circles with their identity indicated. “Other” metabolites indicate that one group had essentially a 0 value while the other group had a measurable value. (D) Depiction of changes in cardiac myocyte physiology, maturation, fuel supply and mitochondrial function observed during the development of the WT heart from E9.5 to adult. ∗ denotes the timing of significant changes in CypD KO compared to WT hearts (note that probability of mPTP opening is different throughout development between the two genotypes). See also Figures S7–S14.

Similar articles

Cited by

References

    1. Baker C.N., Ebert S.N. Development of aerobic metabolism in utero: Requirement for mitochondrial function during embryonic and fetal periods. OA Biotechnol. 2013;2:16.
    1. Porter G.A., Jr., Hom J., Hoffman D., Quintanilla R., de Mesy Bentley K., Sheu S.S. Bioenergetics, mitochondria, and cardiac myocyte differentiation. Prog. Pediatr. Cardiol. 2011;31:75–81. doi: 10.1016/j.ppedcard.2011.02.002. - DOI - PMC - PubMed
    1. Ali H., Braga L., Giacca M. Cardiac regeneration and remodelling of the cardiomyocyte cytoarchitecture. FEBS J. 2020;287:417–438. doi: 10.1111/febs.15146. - DOI - PubMed
    1. Hom J.R., Quintanilla R.A., Hoffman D.L., de Mesy Bentley K.L., Molkentin J.D., Sheu S.S., Porter G.A., Jr. The permeability transition pore controls cardiac mitochondrial maturation and myocyte differentiation. Dev. Cell. 2011;21:469–478. doi: 10.1016/j.devcel.2011.08.008. - DOI - PMC - PubMed
    1. Beutner G., Eliseev R.A., Porter G.A., Jr. Initiation of electron transport chain activity in the embryonic heart coincides with the activation of mitochondrial complex 1 and the formation of supercomplexes. PLoS One. 2014;9 doi: 10.1371/journal.pone.0113330. - DOI - PMC - PubMed

LinkOut - more resources