. 2024 Feb 6;27(3):109146.
doi: 10.1016/j.isci.2024.109146. eCollection 2024 Mar 15.

Myoglobin modulates the Hippo pathway to promote cardiomyocyte differentiation

Affiliations

Myoglobin modulates the Hippo pathway to promote cardiomyocyte differentiation

Krithika Rao et al. iScience. .

Abstract

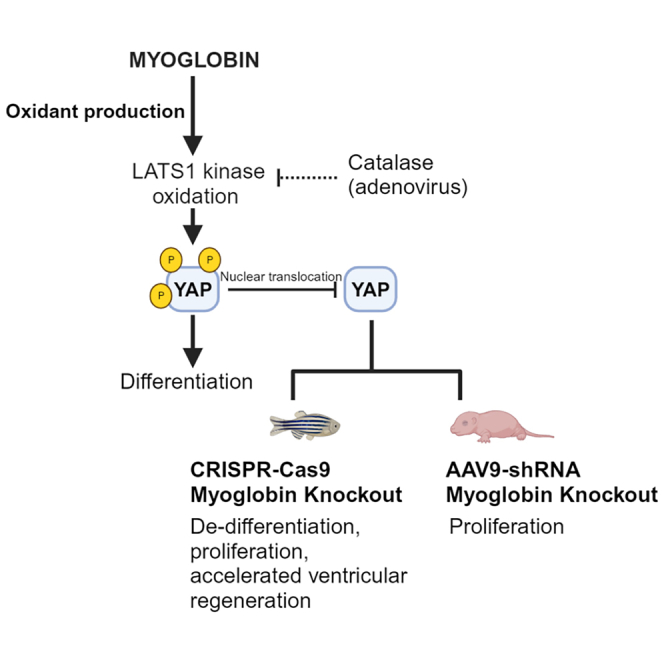
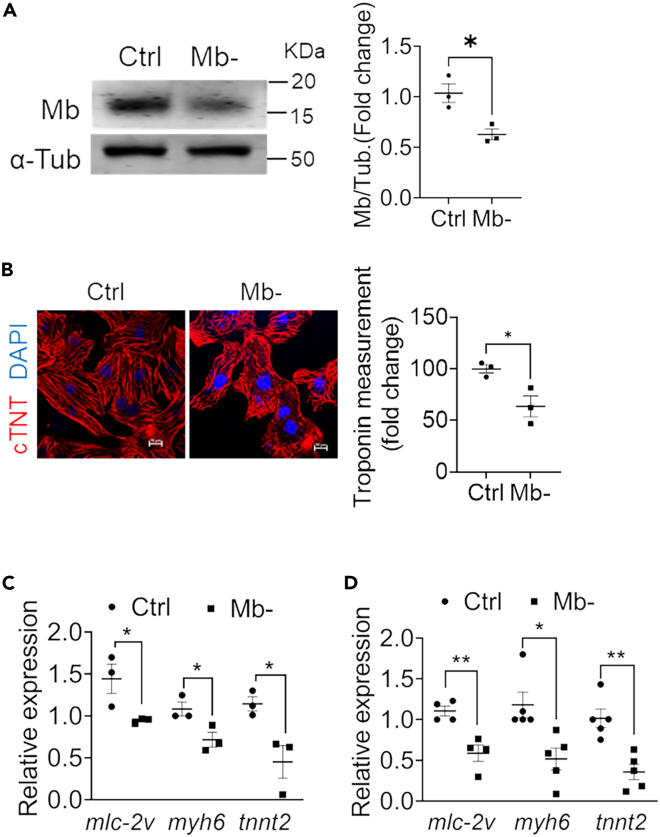
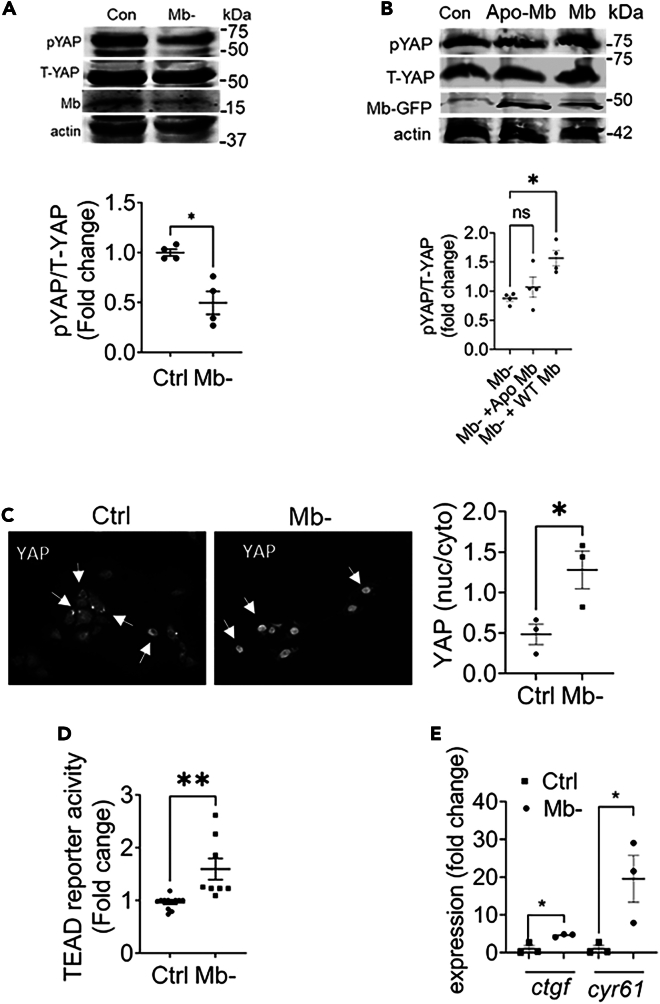
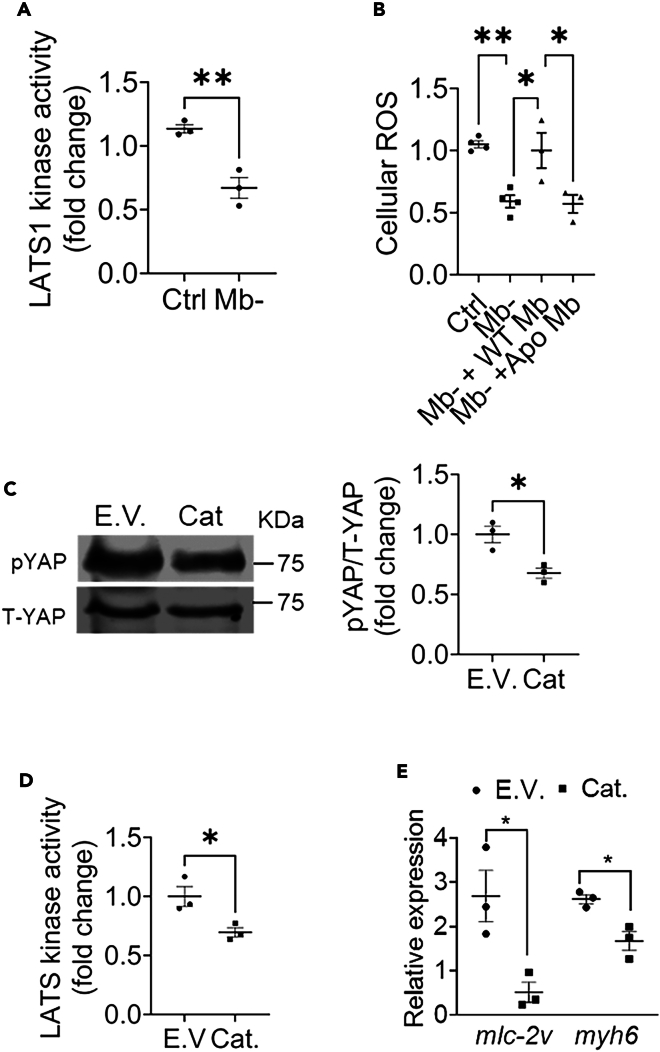
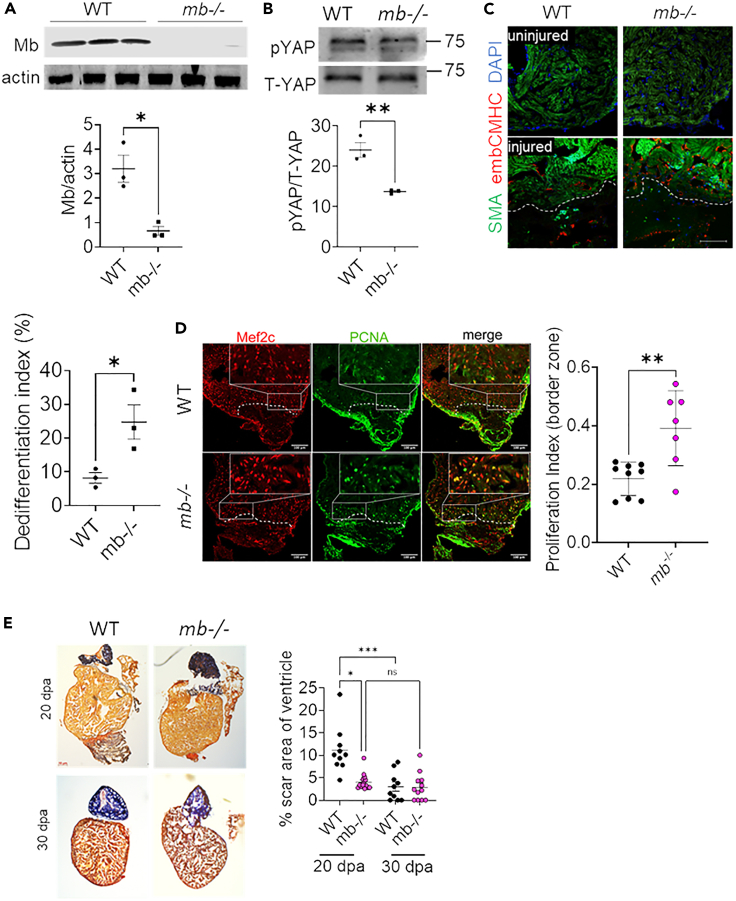
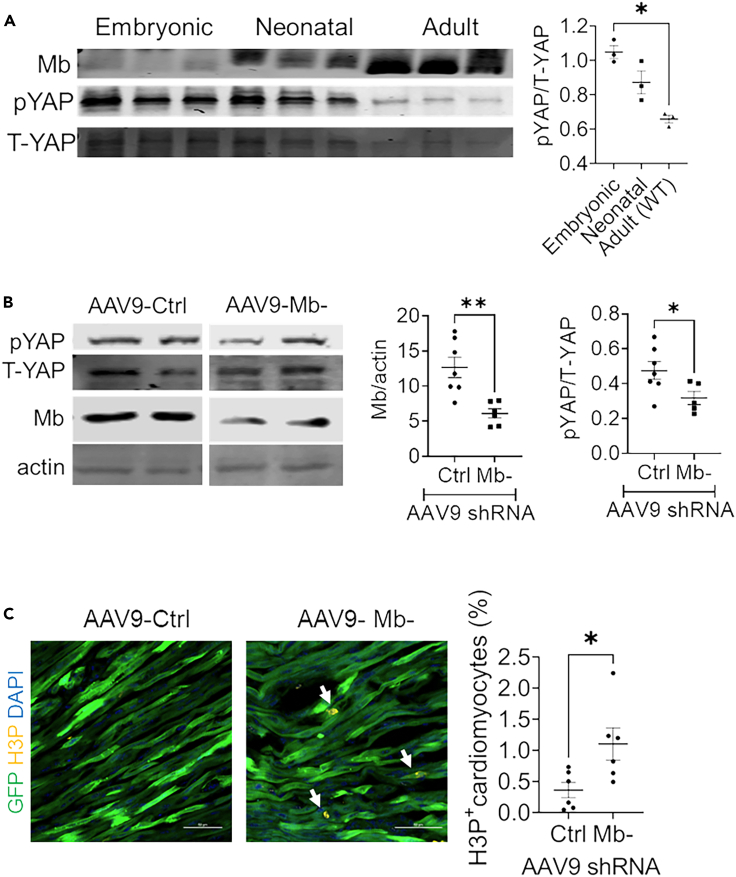
The endogenous mechanisms that propagate cardiomyocyte differentiation and prevent de-differentiation remain unclear. While the expression of the heme protein myoglobin increases by over 50% during cardiomyocyte differentiation, a role for myoglobin in regulating cardiomyocyte differentiation has not been tested. Here, we show that deletion of myoglobin in cardiomyocyte models decreases the gene expression of differentiation markers and stimulates cellular proliferation, consistent with cardiomyocyte de-differentiation. Mechanistically, the heme prosthetic group of myoglobin catalyzes the oxidation of the Hippo pathway kinase LATS1, resulting in phosphorylation and inactivation of yes-associated protein (YAP). In vivo, myoglobin-deficient zebrafish hearts show YAP dephosphorylation and accelerated cardiac regeneration after apical injury. Similarly, myoglobin knockdown in neonatal murine hearts shows increased YAP dephosphorylation and cardiomyocyte cycling. These data demonstrate a novel role for myoglobin as an endogenous driver of cardiomyocyte differentiation and highlight myoglobin as a potential target to enhance cardiac development and improve cardiac repair and regeneration.

Keywords: Biochemistry; Biological sciences; Cell biology; Natural sciences; Specialized functions of cells.


Conflict of interest statement

The authors declare no competing interests.

Figures

None
Graphical abstract
Figure 1
Figure 1
Deletion of endogenous myoglobin inhibits cardiomyocyte differentiation (A) Representative western blot and quantification of Mb in NRVMs treated with control (Ctrl) or Mb targeted siRNA (Mb−). N = 3. (B) Representative immunofluorescence images of NRVMs stained for cardiac troponin T (cTNT; red) to visualize sarcomeric structures and DAPI for nuclei (blue). Relative quantification of troponin fiber lengths in Mb− cells relative to control cells. Scale bar: 10 μm. N = 3. (C) Relative mRNA expression of cardiac structural differentiation markers-mlc-2v (myosin light chain), myh6 (myosin heavy chain), tnnt2 (cardiac troponinT)- in NRVM compared to control undifferentiated cells after Mb knockdown. N = 3. (D) Relative mRNA expression levels of cardiac structural differentiation markers in control and Mb− H9C2 cells. N = 4–5. Data are mean ± SEM; ∗p < 0.05, ∗∗p < 0.01.
Figure 2
Figure 2
Myoglobin propagates YAP phosphorylation and inhibits its activity (A) Representative western Blot and quantification of phospho-YAP (pYAP) and total YAP (T-YAP) in control and Mb− cells 48 h after knockdown, quantified as fold change of control; N = 4. (B) Representative western blot and quantitation of pYAP and T-YAP levels in cells with Mb knockdown (control), followed by overexpression of Mb or Apo-Mb for 48 h using GFP tagged Mb or Apo-Mb plasmid. N = 4. (C) Representative immunofluorescence images depicting YAP cellular localization in control and Mb− H9C2 cells. Arrows point to instance of cytoplasmic signal (Ctrl) and nuclear signal (Mb− image). Quantification is the ratio of nuclear to cytoplasmic staining intensity of YAP from 6 high-power field per sample; N = 3. Scale bar: 100 μm. (D) TEAD-luciferase reporter signal in Mb− expressed as fold change of control cells; N = 3. (E) Fold change over control in relative mRNA expression of YAP transcriptional target genes -ctgf and cyr61-in control and Mb− cells; N = 3. Data are mean ± SEM. ∗p < 0.05, ∗∗p < 0.01, n.s. = not significant.
Figure 3
Figure 3
Scavenging H2O2 inhibits LATS1 activity (A) LATS1 kinase activity of immunoprecipitated LATS1 from control and Mb− cells. N = 3. (B) Cellular H2O2 levels in control, Mb−, Mb− cells with Mb overexpression and Apo-Mb overexpression; N = 3–4. (C) Representative western blot and quantification for pYAP and T-YAP levels in H9C2 cells transduced with empty vector (Ad E.V.) or with adenoviral catalase (Ad Cat) expression; N = 3. (D) LATS1 kinase activity in empty vector (Ad E.V.) or adenoviral catalase (Ad Cat) transduced H9C2 cells; N = 3. (E) Relative expression of mRNA of cardiac differentiation markers in cells overexpressing empty vector control and catalase adenovirus compared with undifferentiated cells; N = 3. Data are mean ± SEM. ∗p < 0.05, ∗∗p < 0.01.
Figure 4
Figure 4
Loss of Mb promotes cardiomyocyte proliferation and regeneration in vivo (A) Western blot and quantification of Mb in WT and mb−/− zebrafish hearts; N = 3 biological replicates. (B) Representative western blot and quantification of pYAP and T-YAP WT and mb−/− zebrafish hearts; N = 3. (C) Zebrafish heart section demonstrating the staining for de-differentiation marker embCMHC in red and α-sarcomeric actin in green at 7 days post amputation, and quantification of embCMHC cardiomyocytes (Differentiation index: % of cardiomyocytes expressing embCMHC in border zone of injury) from WT and mb−/− hearts; N = 3 from each group. Scale bar: 100 μm. (D) Heart sections from WT and mb−/− zebrafish stained for Mef2c transcription factor (red) to identify cardiomyocytes and PCNA (green) to identify proliferating cells at 7 days post amputation: N = 7–9 individual zebrafish per group. Scale bar: 100 μm. (E) Representative histological sections of AFOG stained tissue from WT and mb−/− zebrafish at 20- and 30-days post amputation stained to visualize fibrin (red), collagen (blue) and cardiac muscle (orange). Graph demonstrates the quantification of scar area on each section normalized to total ventricular area; N = 9–16 individual zebrafish per group. Scale bar: 100 μm. Data are mean ± SEM. ∗p < 0.05, ∗∗p < 0.01, ∗∗∗∗p < 0.0001.
Figure 5
Figure 5
Deletion of Mb inhibits YAP phosphorylation in neonatal mouse hearts (A) Western blot and relative quantification of pYAP to T-YAP ratios in embryonic (E14.5), fetal (postnatal day 3) and adult (10-week-old) mice. N = 3 mice per age. (B) Representative western blot and relative quantification of pYAP to T-YAP ratios in postnatal day 7 mouse hearts after injection of AAV9 virus encoding a scramble control or Mb targeting shRNA into postnatal day 1 mice. N = 5–7 mice per group. (C) Representative tissue sections and quantification of phospho histone 3 (H3P) staining from mice injected with control or Mb− targeted shRNA expressing AAV9. N = 6 mice per group. Arrow indicates H3P+ nuclei and green represents the GFP cardiomyocytes infected with AAV9. Scale bar: 50 μm. Data are mean ± SEM. ∗p < 0.05, ∗∗p < 0.01.

Similar articles

Cited by

References

    1. Ahuja P., Sdek P., MacLellan W.R. Cardiac myocyte cell cycle control in development, disease, and regeneration. Physiol. Rev. 2007;87:521–544. doi: 10.1152/physrev.00032.2006. - DOI - PMC - PubMed
    1. Soonpaa M.H., Kim K.K., Pajak L., Franklin M., Field L.J. Cardiomyocyte DNA synthesis and binucleation during murine development. Am. J. Physiol. 1996;271 doi: 10.1152/ajpheart.1996.271.5.H2183. - DOI - PubMed
    1. Guo Y., Pu W.T. Cardiomyocyte Maturation: New Phase in Development. Circ. Res. 2020;126:1086–1106. doi: 10.1161/circresaha.119.315862. - DOI - PMC - PubMed
    1. Hirschy A., Schatzmann F., Ehler E., Perriard J.C. Establishment of cardiac cytoarchitecture in the developing mouse heart. Dev. Biol. 2006;289:430–441. doi: 10.1016/j.ydbio.2005.10.046. - DOI - PubMed
    1. Ahuja P., Perriard E., Perriard J.C., Ehler E. Sequential myofibrillar breakdown accompanies mitotic division of mammalian cardiomyocytes. J. Cell Sci. 2004;117:3295–3306. doi: 10.1242/jcs.01159. - DOI - PubMed

LinkOut - more resources