. 2024 Feb 8;27(3):109181.
doi: 10.1016/j.isci.2024.109181. eCollection 2024 Mar 15.

DUB3 is a MAGEA3 deubiquitinase and a potential therapeutic target in hepatocellular carcinoma

Affiliations

DUB3 is a MAGEA3 deubiquitinase and a potential therapeutic target in hepatocellular carcinoma

Yuanhong Chen et al. iScience. .

Abstract

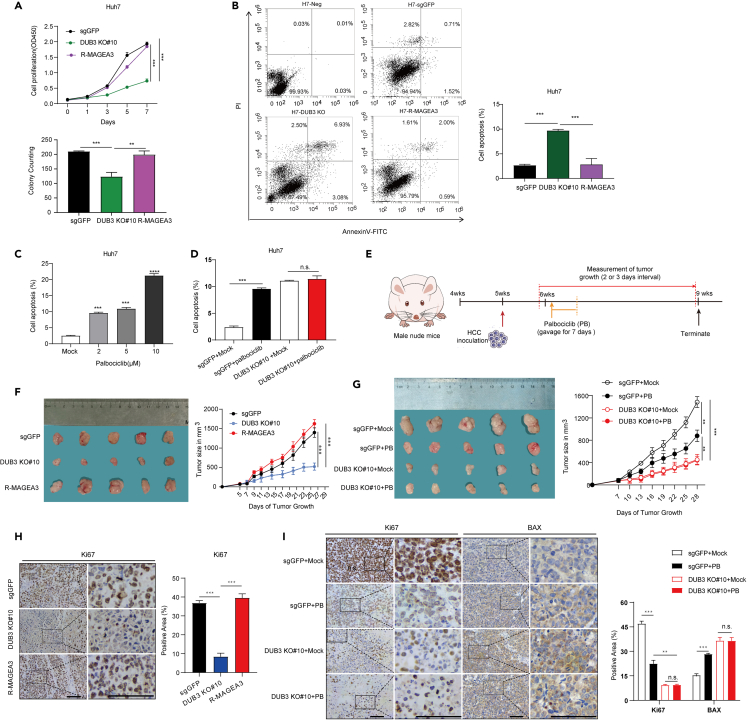
Although melanoma-associated antigen A3 and A6 (MAGEA3/6)-specific tumor vaccines have shown antitumor effects in melanoma and non-small cell lung cancer (NSCLC), many cancers do not respond because MAGEA3 can promote cancer without triggering an immune response. Here, we identified DUB3 as the MAGEA3 deubiquitinase. DUB3 interacts with, deubiquitinates and stabilizes MAGEA3. Depletion of DUB3 in hepatocellular carcinoma (HCC) cells results in MAGEA3 degradation and P53-dependent growth inhibition. Moreover, DUB3 knockout attenuates HCC tumorigenesis in vivo, which can be rescued by restoration of MAGEA3. Intriguingly, pharmacological inhibition of DUB3 by palbociclib promotes degradation of MAGEA3 and inhibits tumor growth in preclinical models implanted with parental HCC cells but not with DUB3 knockout HCC cells. In patients with HCC, DUB3 is highly expressed, and its levels positively correlate with MAGEA3 levels. Taken together, DUB3 is a MAGEA3 deubiquitinase, and abrogating DUB3 enzymatic activity by palbociclib is a promising therapeutic strategy for HCC.

Keywords: Cancer; Molecular biology.


Conflict of interest statement

The authors do not have any commercial or financial conflicts of interest to disclose.

Figures

None
Graphical abstract
Figure 1
Figure 1
DUB3 is a MAGEA3-interacting deubiquitinase (A) Nine of 65 DUBs could stabilize the expression of MAGEA3. Each SFB-tagged DUB was transfected into HEK293T MYC-MAGEA3 stable cells, followed by treatment with 100 μg/mL CHX for 9 h. Cells were collected and immunoblotted with antibodies against FLAG, MAGEA3 and HSP90. DUBs labeled in red indicate the candidates. (B) Seven of 9 candidate DUBs could stabilize the expression of MAGEA3. SFB-tagged DUBs were individually transfected into HEK293T MYC-MAGEA3 stable cells and then subjected to 100 μg/mL CHX treatment for 9 h. Cells were harvested and immunoblotted with antibodies against FALG, MAGEA3 and HSP90. (C) MYC-MAGEA3 was co-transfected with each SFB-tagged DUB or GFP into HEK293T cells, and then cell lysates were subjected to a pulldown assay with S- protein beads and immunoblotting with antibodies against MYC and FLAG. (D) SFB-tagged DUBs or GFP were individually transfected into HEK293T MYC-MAGEA3 stable cell lines, followed by immunoprecipitation with MYC agarose beads and immunoblotting with antibodies against MYC and FLAG. HC: heavy chain; LC: light chain. The red asterisk represents the specific band corresponding to USP8. (E) SFB-OTUD1 and SFB-DUB3 were individually co-transfected with MYC-MAGEA3 and HA-ubiquitin into HEK293T cells. After treatment with 10 μM MG132 for 6 h, cells were collected and subjected to immunoprecipitation with MYC agarose beads and immunoblotting with antibodies against HA, MYC and FLAG. (F) Kaplan‒Meier plot analyzing the correlation between DUB3 (USP17L2) expression and the prognosis of hepato1cellular carcinoma (HCC) patients from 82 metastatic subtype tumor samples.
Figure 2
Figure 2
DUB3 directly interacts with and stabilizes MAGEA3 through deubiquitination (A) GST-DUB3 (left) and MAGEA3-His (right) proteins purified from bacteria were incubated with purified MAGEA3-His or GST-DUB3 protein, followed by a pulldown assay with glutathione Sepharose beads or Ni-NTA agarose beads and immunoblotting with an antibody against MAGEA3 or DUB3. Purified proteins were analyzed by SDS‒PAGE and Coomassie blue staining. (B) MYC-MAGEA3 HEK293T stable cell line was transiently transfected with DUB3 (wild-type or C89S) or treated with or without MG132. Cells were collected, and cell lysates were subjected to western blotting analysis with antibodies against MAGEA3, DUB3 and GAPDH. (C) DUB3 (wild-type or C89S) was transfected into stable MAGEA3-overexpressing HEK293T cells. After treatment with 100 μg/mL CHX, cells were harvested at the indicated times and immunoblotted with antibodies against MAGEA3, MYC and GAPDH. MAGEA3 protein levels were measured by grayscale analysis (normalized to GAPDH). (D) SFB-MAGEA3 was individually co-transfected with MYC-tagged GFP or DUB3 (wild-type or C89S) and HA-ubiquitin into HEK293T cells. After 10 μM MG132 treatment for 6 h, cells were harvested, and cell lysates were subjected to a pulldown assay with S-protein beads and immunoblotting with antibodies against HA, FLAG and MYC. (E) GST-DUB3 (wild-type or C89S) and GST-His proteins were individually incubated with ubiquitinated SFB-MAGEA3 protein purified from HEK293T cells. After in vitro deubiquitination, the proteins bound to S-protein beads were eluted and immunoblotted with antibodies against HA and FLAG. Purified proteins were analyzed by SDS‒PAGE and Coomassie blue staining. (F) HEK293T cells transfected with SFB-MAGEA3, various HA-ubiquitin mutants, or MYC-DUB3 for 48 h were treated with 10 μM MG132 for 6 h. Cell lysates were subjected to a pulldown assay with S-protein beads and immunoblotting with antibodies against HA, FLAG and MYC. (G) HEK293T cells transfected with HA-ubiquitin and WT SFB-MAGEA3 or the indicated SFB-MAGEA3 mutants as indicated for 48 h were treated with 10 μM MG132 for 6 h. Cell lysates were subjected to a pulldown assay with S-protein beads and immunoblotting with antibodies against HA and FLAG. (H) HEK293T cells transfected with HA-ubiquitin, WT SFB-MAGEA3 or SFB-MAGEA3 (K244R) and MYC-DUB3 for 48 h were treated with 10 μM MG132 for 6 h. Cell lysates were subjected to a pulldown assay with S protein beads and immunoblotting with antibodies against HA, FLAG and MYC. (I) SFB-MAGEA3 (wild-type or K244R) and MYC-GFP were co-transfected into HEK293T cells. After treatment with 100 μg/mL CHX, the cells were harvested at the indicated times and immunoblotted with antibodies against MAGEA3 and MYC. MAGEA3 protein levels were measured by grayscale analysis (normalized to GFP).
Figure 3
Figure 3
DUB3 regulates MAGEA3 expression in HCC cells through enzyme activity (A) The protein expression of MAGEA3 and DUB3 was detected in various HCC cell lines. (B) DUB3 was depleted in Huh7 cells using CRISPR‒Cas9 technology, and two DUB3 KO subclones of Huh7 cells (KO#6 and KO#10) were employed to detect the protein expression of MAGEA3 when these cells were subjected to treatment with 100 μg/mL CHX for the indicated times. Endogenous MAGEA3 and DUB3 were detected by western blotting and quantified using grayscale analysis (normalized to GAPDH). Data represent the average of three independent experiments (mean ± SD). (C) SFB-MAGEA3 and HA-ubiquitin were co-expressed with/without MYC-DUB3 (wild-type or C89S) in Huh7 cells. After treatment with 10 μM MG132 for 6 h, the cells were harvested and subjected to a pulldown assay with S-protein beads and immunoblotting with antibodies against FLAG, MYC and HA. (D) Endogenous DUB3 and MAGEA3 were immunoprecipitated (IP) from Huh7 and LM3 cells and immunoblotted with antibodies against MAGEA3 and DUB3. (E) Huh7 DUB3 knockout (KO) subclones transiently expressed DUB3 (wild-type or C89S). After treatment with 100 μg/mL CHX for the indicated times, cells were collected, and cell lysates were subjected to western blotting analysis with antibodies against MAGEA3, DUB3 and GAPDH. The DUB3 gene sequence was mutated to resist the effects of sgRNAs. (F) Huh7 cells were treated with palbociclib at various concentrations (0.1% DMSO (mock), 5 μM or 10 μM) for 48 h. After treatment with 100 μg/mL CHX for the indicated times, cells were collected, and western blotting was performed to detect the protein expression of MAGEA3, DUB3 and GAPDH. MAGEA3 protein levels were measured by grayscale analysis (normalized to that of GAPDH). (G) The Huh7 cell line co-expressed SFB-MAGEA3 and HA-ubiquitin. After treatment with 2 μM palbociclib for 48 h, 10 μM MG132 was added for another 6 h. Then, the cells were harvested and immunoblotted with antibodies against FLAG, DUB3 and HA. (H) The expression of MAGEA3 in HCC tissue is positively correlated with the expression of DUB3. Upper right: the layout of 80 pairs of HCC and their corresponding adjacent tissue samples on glass slides. Lower right: The relative protein expression of MAGEA3 (left) and DUB3 (right) in tumor and normal tissues was detected via immunofluorescence staining. HCC tissue was immunoblotted with MAGEA3-specific antibody (green) and DUB3-specific antibody (red). Error bars are presented as SEM. p values were evaluated according to a two-tailed t test. Upper left: Protein expression patterns of MAGEA3 (left) and DUB3 (right) in 80 HCC patients. Lower left: Pearson’s product-moment correlation analysis was used to evaluate the correlation between DUB3 and MAGEA3. ∗p < 0.05; ∗∗p < 0.01; ∗∗∗p < 0.001; ∗∗∗∗p < 0.0001.
Figure 4
Figure 4
DUB3 drives HCC tumorigenesis through stabilization of MAGEA3 (A) Growth curves and colony formation were measured in Huh7 cells transduced with GFP sgRNA (sgGFP), DUB3 sgRNA and DUB3 sgRNA with MAGEA3 overexpression (DUB3 KO#6 and KO#10 are two independently generated KO lines). Data represent the average of three independent experiments (mean ± SD). Statistical significance was determined by a two-tailed, unpaired Student’s t test. ∗p < 0.05; ∗∗p < 0.01; ∗∗∗p < 0.001. (B) Flow cytometry analyses of the percentage of cell apoptosis in Huh7 subclones (sgGFP, DUB3 KO#10 and R-MAGEA3) using FITC-Annexin V and PI double staining. Representative images of the scatterplot (left) and quantification data are shown. Data represent the average of three independent experiments (mean ± SD). Statistical significance was determined by a two-tailed, unpaired Student’s t test. ∗p < 0.05; ∗∗p < 0.01; ∗∗∗p < 0.001. (C) Flow cytometry analysis of the percentage of apoptotic Huh7 cells after treatment with palbociclib (0, 2, 5 and 10 μM) for 24 h. Data represent the average of three independent experiments (mean ± SD). Statistical significance was determined by a two-tailed, unpaired Student’s t test., ∗p < 0.05; ∗∗p < 0.01; ∗∗∗p < 0.001. (D) Flow cytometry was used to analyze the percentage of apoptotic Huh7 subclones (sgGFP and DUB3 KO#10) with or without 5 μM palbociclib treatment for 24 h. Data represent the average of three independent experiments (mean ± SD). Statistical significance was determined by a two-tailed, unpaired Student’s t test. ∗p < 0.05; ∗∗p < 0.01; ∗∗∗p < 0.001; n.s., not significant. (E) Flow diagram of the animal experiment. (F) Knockout of DUB3 inhibits HCC xenograft tumor growth, and overexpression of MAGEA3 restores tumor growth. A subcutaneous xenograft tumor model was established using different Huh7 subclones (sgGFP, DUB3 KO#10, R-MAGEA3). Tumor volume was measured at 2-day intervals, and tumor growth curves were displayed to compare the differences among groups (right panel). Images of tumors obtained from mice are presented (left panel). Error bars are presented as SEM. Statistical significance was determined by a two-tailed, unpaired Student’s t test. ∗p < 0.05; ∗∗p < 0.01; ∗∗∗p < 0.001. (G) Palbociclib treatment inhibited tumor growth in the control group but had no effect on tumor growth in the DUB3 KO group. A subcutaneous xenograft tumor model was established using Huh7 subclones (sgGFP, DUB3 KO#10). Tumor volume was measured at 3-day intervals, and tumor growth curves were displayed to compare the differences among groups (right panel). Images of tumors obtained from mice are presented (left panel). Error bars are presented as SEM. Statistical significance was determined by a two-tailed, unpaired Student’s t test. ∗p < 0.05; ∗∗p < 0.01; ∗∗∗p < 0.001. (H) IHC analysis of Ki67 expression in xenograft tumor samples as indicated. Representative images of Ki67 staining (left panel) and quantification data (right panel) are shown; scale bar, 50 μm. Error bars are presented as SD. Statistical significance was determined by a two-tailed, unpaired Student’s t test. ∗p < 0.05; ∗∗p < 0.01; ∗∗∗p < 0.001. (I) IHC analysis of Ki67 and proapoptotic BAX expression in xenograft tumor samples as indicated. Representative images of Ki67 and BAX staining (left panel) and quantification data (right panel) are shown; scale bar, 50 μm. Error bars are presented as SD. Statistical significance was determined by a two-tailed, unpaired Student’s t test; ∗p < 0.05; ∗∗p < 0.01; ∗∗∗p < 0.001; n.s., not significant.
Figure 5
Figure 5
The DUB3-MAGEA3-P53 axis regulates cell proliferation in HCC (A) The protein expression of P53, P21 and BAX was detected in Huh7 and LM3 cells transduced with scrambled shRNA, MAGEA3 shRNA, and MAGEA3 shRNA with MAGEA3 overexpression by western blotting. (B) The protein expression of DUB3, MAGEA3, P53, P21 and BAX was detected in Huh7 and LM3 cells transduced with GFP sgRNA (sgGFP), DUB3 sgRNA and DUB3 sgRNA with MAGEA3 overexpression by western blotting. (C) Immunohistochemistry (IHC) analysis of the protein expression of P53, P21 and BAX in xenograft tumor samples (sgGFP, DUB3 KO#10, R-MAGEA3). Representative images of IHC staining (left panel) and the quantification data of protein expression (right panel) are shown. Box areas in the left pictures are magnified on the right. Scale bar, 50 μm. Error bars are presented as SD. Statistical significance was determined by a two-tailed, unpaired Student’s t test. ∗p < 0.05; ∗∗p < 0.01; ∗∗∗p < 0.001. (D) MYC-P53 and HA-ubiquitin were expressed in Huh7 DUB3 KO cells transduced with GFP, DUB3 and MAGEA3. After treatment with 10 μM MG132 for 6 h, cells were harvested, followed by a pulldown assay with MYC beads and immunoblotting with MYC, HA, MAGEA3 and DUB3. The DUB3 gene sequence was mutated to resist the effects of sgRNA. (E) Endogenous TRIM28 was immunoprecipitated (IP) from Huh7 cells and immunoblotted with antibodies against MAGEA3. (F) GST-MAGEA3 or GST-His proteins purified from bacteria were incubated with purified TRIM28-His protein, followed by a pulldown assay with glutathione Sepharose beads and immunoblotting with an antibody against TRIM28 and GST. Purified proteins were analyzed by SDS‒PAGE and Coomassie blue staining. (G) TRIM28, P53 and MAGEA3 protein expression was detected via western blotting in Huh7 cells transduced with scrambled shRNA, MAGEA3 shRNA or MAGEA3 shRNA combined with TRIM28 shRNA. (H) MYC-P53, HA-linked ubiquitin with MAGEA3 or TRIM28 or MAGEA3 and TRIM28 were co-expressed in Huh7 cells. After treatment with 10 μM MG132 for 6 h, the cells were harvested, subjected to a pulldown assay with MYC beads and immunoblotting with MYC, HA, MAGEA3 and TRIM28. (I) MAGEA3, P53, BAX and P21 protein expression was detected in LM3 cells transduced with scrambled shRNA, MAGEA3 shRNA and MAGEA3 shRNA with P53 shRNA simultaneously by western blotting. (J)The protein expression of MAGEA3, P53, BAX and P21 was detected in Huh7 cells transduced with GFP, MAGEA3 individual and MAGEA3 with P53. (K) Growth curve, colony formation and EdU staining were measured in Huh7 subclones as indicated. Data represent the average of three independent experiments (mean ± SD). Statistical significance was determined by a two-tailed, unpaired Student’s t test. ∗p < 0.05; ∗∗p < 0.01; ∗∗∗p < 0.001. (L) Growth curve, colony formation and EdU staining were measured in Huh7 subclones as indicated. Data represent the average of three independent experiments (mean ± SD). Statistical significance was determined by a two-tailed, unpaired Student’s t test. ∗p < 0.05; ∗∗p < 0.01; ∗∗∗p < 0.001.
Figure 6
Figure 6
Model for the regulation of HCC progression by the DUB3-MAGEA3/6-P53 axis In brief, MAGEA3/6 are highly expressed in HCC cells compared with normal liver cells. The accumulation of MAGEA3/6 in complex with TRIM28 attenuates P53 expression via ubiquitination-mediated degradation, further enhancing the proliferative capacity of HCC cells and driving tumorigenesis. Palbociclib inhibits DUB3 activity and promotes MAGEA3 degradation to attenuate HCC tumorigenesis.

Similar articles

References

    1. Lee A.K., Potts P.R. A Comprehensive Guide to the MAGE Family of Ubiquitin Ligases. J. Mol. Biol. 2017;429:1114–1142. doi: 10.1016/j.jmb.2017.03.005. - DOI - PMC - PubMed
    1. Wei X., Chen F., Xin K., Wang Q., Yu L., Liu B., Liu Q. Cancer-Testis Antigen Peptide Vaccine for Cancer Immunotherapy: Progress and Prospects. Transl. Oncol. 2019;12:733–738. doi: 10.1016/j.tranon.2019.02.008. - DOI - PMC - PubMed
    1. Ravichandran R., Kodali K., Peng J., Potts P.R. Regulation of MAGE-A3/6 by the CRL4-DCAF12 ubiquitin ligase and nutrient availability. EMBO Rep. 2019;20 doi: 10.15252/embr.201847352. - DOI - PMC - PubMed
    1. Wascher R.A., Bostick P.J., Huynh K.T., Turner R., Qi K., Giuliano A.E., Hoon D.S. Detection of MAGE-A3 in breast cancer patients' sentinel lymph nodes. Br. J. Cancer. 2001;85:1340–1346. doi: 10.1054/bjoc.2001.2079. - DOI - PMC - PubMed
    1. Gao X., Chen G., Cai H., Wang X., Song K., Liu L., Qiu T., He Y. Aberrantly enhanced melanoma-associated antigen (MAGE)-A3 expression facilitates cervical cancer cell proliferation and metastasis via actuating Wnt signaling pathway. Biomed. Pharmacother. 2020;122 doi: 10.1016/j.biopha.2019.109710. - DOI - PubMed