. 2024 Feb 9;27(3):109172.
doi: 10.1016/j.isci.2024.109172. eCollection 2024 Mar 15.

Disruption of mitochondrial energy metabolism is a putative pathogenesis of Diamond-Blackfan anemia

Affiliations

Disruption of mitochondrial energy metabolism is a putative pathogenesis of Diamond-Blackfan anemia

Rudan Xiao et al. iScience. .

Abstract

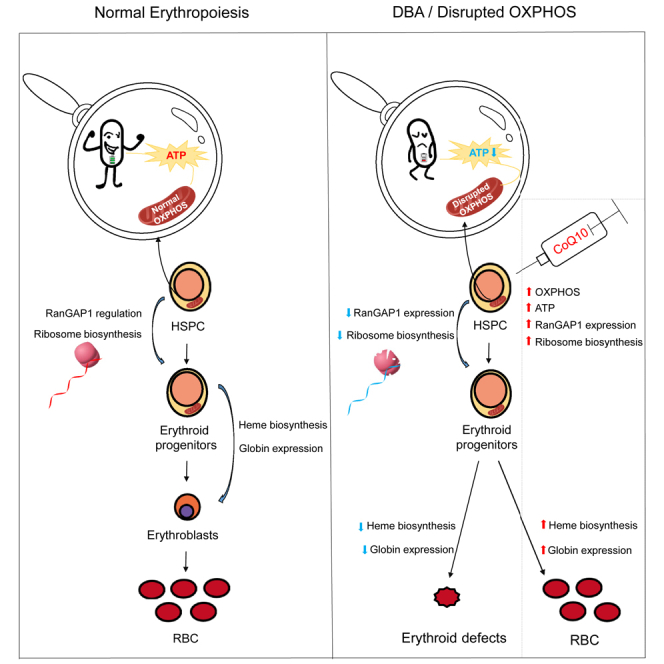
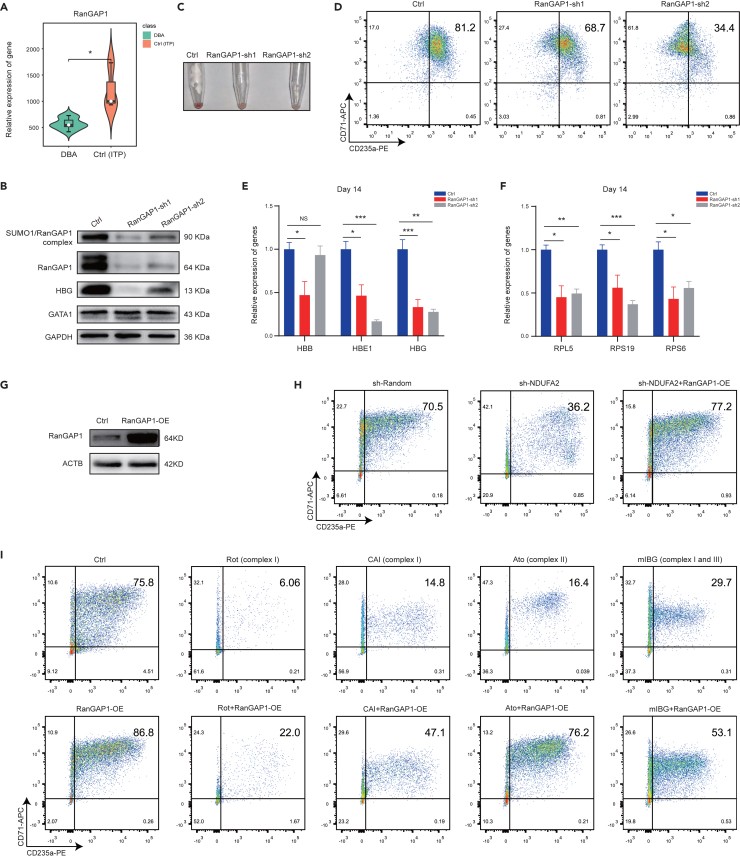
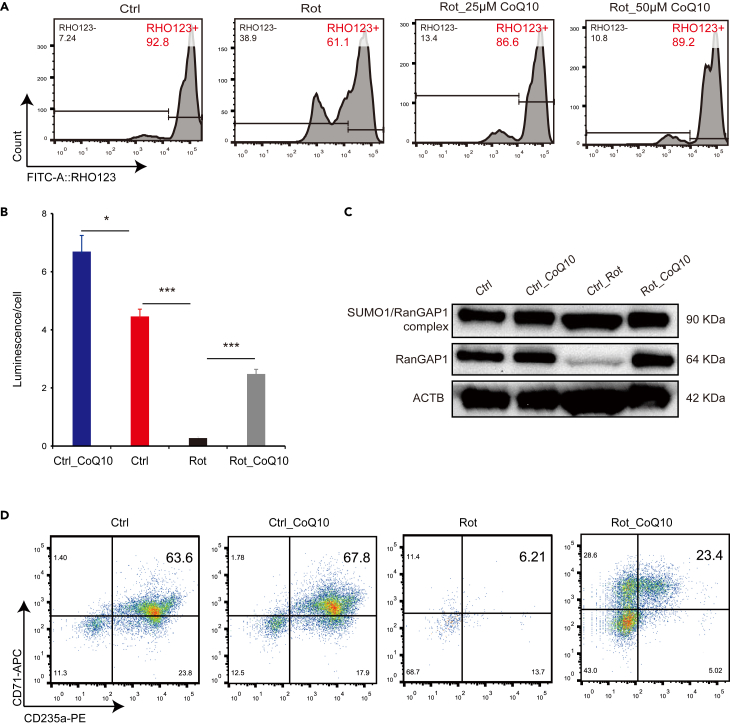
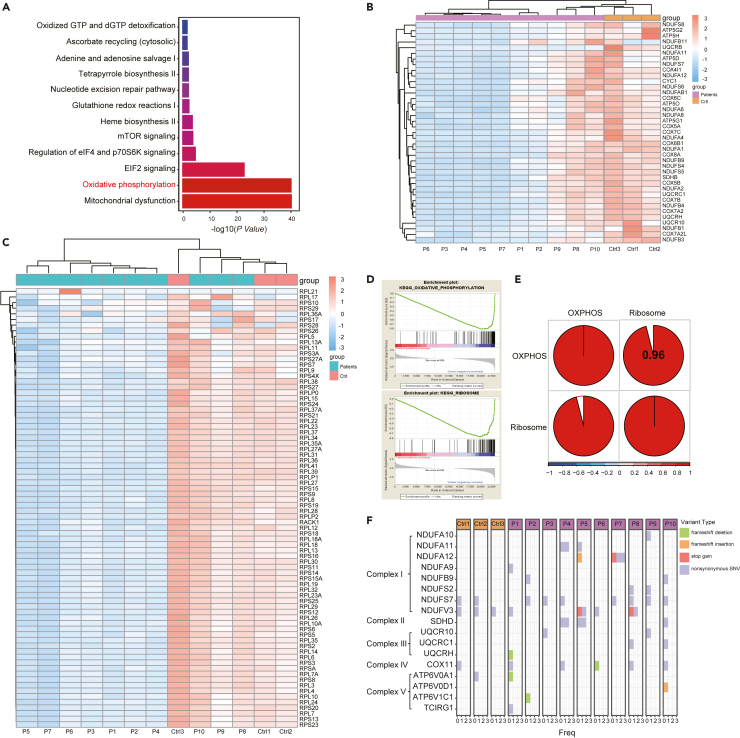
Energy metabolism in the context of erythropoiesis and related diseases remains largely unexplored. Here, we developed a primary cell model by differentiating hematopoietic stem progenitor cells toward the erythroid lineage and suppressing the mitochondrial oxidative phosphorylation (OXPHOS) pathway. OXPHOS suppression led to differentiation failure of erythroid progenitors and defects in ribosome biogenesis. Ran GTPase-activating protein 1 (RanGAP1) was identified as a target of mitochondrial OXPHOS for ribosomal defects during erythropoiesis. Overexpression of RanGAP1 largely alleviated erythroid defects resulting from OXPHOS suppression. Coenzyme Q10, an activator of OXPHOS, largely rescued erythroid defects and increased RanGAP1 expression. Patients with Diamond-Blackfan anemia (DBA) exhibited OXPHOS suppression and a concomitant suppression of ribosome biogenesis. RNA-seq analysis implied that the substantial mutation (approximately 10%) in OXPHOS genes accounts for OXPHOS suppression in these patients. Conclusively, OXPHOS disruption and the associated disruptive mitochondrial energy metabolism are linked to the pathogenesis of DBA.

Keywords: Cell biology; Cellular physiology; Developmental biology.


Conflict of interest statement

The authors declare that there are no competing financial interests in this study.

Figures

None
Graphical abstract
Figure 1
Figure 1
Suppression of OXPHOS leads to differentiation failure of erythroid progenitors (A) Colony-forming potential analysis of Rot-treated HSPCs indicating erythroid defects that were not observed in other lineages. Data are represented as mean ± SEM, and the results are from three independent experiments. (B) Representative flow cytometry analysis indicating a significantly reduced number of CD71+GlyA+ double-positive erythroid cells differentiated from Rot-treated HSPCs on Day 7 compared to that of the control cells. Five independent experiments were conducted. The pellets of differentiated cells with or without Rot treatment were showed. (C) Representative flow cytometry analysis revealing blockage at the stage of erythroid progenitors (CD34CD36+) in differentiated HSPCs derived from human healthy BM and cord blood with 0.1 μM Rot treatment on Day 7. CB: cord blood. (D) Real-time PCR analysis indicating a significant decrease in the expression of erythroid-specific globin genes in Rot-treated erythroid cells (Day 7) compared to that in control cells. Data are represented as mean ± SEM. ∗∗p < 0.01; ∗∗∗p < 0.001. (E) Real-time PCR analysis indicated a significant decrease in heme biosynthesis-related genes and erythroid-specific transcription factors in erythroid cells on Day 7 when differentiated from Rot-treated CB HSPCs compared to that of control cells. ACTIN was used as the reference gene in real-time PCR assays. Data are represented as mean ± SEM. Student’s t test was used in this study: ∗p < 0.05; ∗∗p < 0.01; ∗∗∗p < 0.001. (F) The integrative analysis of proteome and transcriptome data revealing erythroid defects as indicated by the decreased expression of erythroid-specific proteins and genes, including erythroid markers, transcription factors, hemoglobin, and heme biosynthesis pathway-related components, in differentiated cells on Day 7 with Rot treatment. (G) Evaluation of the effect of knockdown of NDUFA2 on erythroid differentiation. The number of CD71+GlyA + erythroid cells (day 7) in GPF-positive cells with NDUFA2 knockdown was compared between two samples using flow cytometry. (H) Evaluation of the effects of three OXPHOS complex inhibitors on erythroid differentiation. Two doses of each inhibitor were tested. The number of CD71+GlyA + double-positive erythroid cells (day 7) was compared between the samples with or without inhibitor treatment using flow cytometry. See also Figure S1.
Figure 2
Figure 2
Suppression of OXPHOS leads to ribosomal defects (A) Schematic illustration of transcriptome analysis of differentiated HSPCs with OXPHOS inhibition. Differentiated cells toward erythroid lineage on days 3 and 7 treated with or without Rot were collected and evaluated using bulk transcriptome sequencing. Ribosome biogenesis and globin biosynthesis are the representative biological events that occurred on days 3 and 7 of erythropoiesis, respectively. (B) Enrichment analysis of GO terms enriched by up- and downregulated DEGs in differentiated HSPCs on days 3 and 7 and DBA patient samples, respectively. The biological pathways or events, including OXPHOS and ribosome biogenesis, were suppressed and enriched in differentiated HSPCs with OXPHOS inhibition and DBA samples. (C) Representative Agilent Bioanalyzer 5400 electrophoretogram profiles of total RNA from differentiated erythroid cells on Day 7. rRNA species were disturbed in differentiated HSPCs treated with different concentrations of Rot. The highlighted areas indicate altered rRNA species (reduced 18s rRNA: red; newly synthesized rRNA species: dark blue and red arrows) in ribosomes in differentiated erythroid cells with OXPHOS inhibition. (D) Comparison of polysome profiling between differentiated erythroid cells with or without 0.1 μM Rot treatment. (E) Real-time PCR analysis indicating a significant overall reduction in the expression of most DBA-causative genes in differentiated HSPCs with OXPHOS inhibition on Day 7. ACTIN was used as the reference gene. Data are represented as mean ± SEM. ∗p < 0.05; ∗∗p < 0.01. (F) Integrative analysis of proteome and transcriptome data revealing the overall reduction of all constitutive ribosomal proteins at both the protein and mRNA levels. OXPHOS suppression leads to the comprehensive reduction of ribosomal proteins in differentiated erythroid cells. (G) Real-time PCR analysis indicating a decrease in the gene expression of RPS6 in differentiated HSPCs with OXPHOS inhibition on Day 7. GAPDH was used as a reference gene in real-time PCR assays. Data are represented as mean ± SEM. ∗p < 0.05; ∗∗∗p < 0.001. (H) Immunofluorescence analysis of RPS6 revealing defects in ribosome levels in differentiated HSPCs with OXPHOS inhibition on Day 7. Scale bar: 60 μm. See also Figure S2.
Figure 3
Figure 3
OXPHOS pathway correlates with ribosome biogenesis during normal erythropoiesis in bone marrow (A) UMAP plot of single-cell cluster distribution of cells in the BM from healthy individuals. Transcriptome data of 49,707 BM single cells were collected from previously published databases GSE139369 and GSE150774. The differentiated cells toward the erythroid lineage, including MEP, BFU-E, CFU-E, Pro-E, Baso-E, Poly-E and Ortho-E, that were labeled with red. The erythropoiesis path can be visualized in the plot. (B) Enrichment analysis of the KEGG pathways in normal BM. The KEGG pathway activity score within each cell was calculated using the R package testSctpa, and the mean ribosome biogenesis, OXPHOS, and erythroid differentiation-related pathway scores were calculated and visualized for each cell type and indicated suddenly initiated activities of these pathways at the stage of proerythroblasts but not erythroid progenitors. (C) The trend curve of gene expression regarding the OXPHOS pathway and ribosome biogenesis throughout erythropoiesis. The gene module score was calculated using the AddModuleScore function in the R package Seurat. The key genes (same in Figures 6B and 6C) in OXPHOS or the ribosome biogenesis pathway were used for this analysis. (D) Correlation analysis of OXPHOS and ribosome biogenesis. The scoring value of the pathway activity in each cell was calculated by the R package testSctpa using the AUCell algorithm, where go.bp was selected by the pathway parameter. Correlation between pathways was calculated by Pearson correlation analysis.
Figure 4
Figure 4
RanGAP1 is a target of mitochondrial OXPHOS in erythroid differentiation (A) The suppressed expression of RanGAP1 was evaluated in the DBA patient samples compared to expression in control samples. The x axis was the count of reads for the gene, and the significance was added by stat_compare_means in the R package ggpubr. (B) Western blotting assay revealing the knockdown of RanGAP1 protein expression by two independent shRNA in differentiated HSPCs on Day 7. The expression of representative erythroid-specific proteins, including HBG and GATA1, was detected. Lysates for differentiated cells were loaded into SDS-PAGE gel. The expression of the SUMO1/RanGAP1 complex was simultaneously detected using the RanGAP1 antibody. Actin was used as a loading control. (C) Representative result indicating RanGAP1 knockdown delays erythroid differentiation as revealed by the color of the cell pellets on Day 7. Differentiated cells containing the control vector appeared as a red pellet, whereas pelleted cells with RanGAP1 knockdown did not. (D) Representative flow cytometry analysis indicating decreased number of CD71+GlyA+ double-positive erythroid cells differentiated from human cord blood HSPCs with RanGAP1 knockdown on Day 7. Three independent experiments were performed in this study. (E) A decrease was observed in the expression of globin genes in differentiated cells with RanGAP1 knockdown on Day 14 by real-time PCR analysis. Data are represented as mean ± SEM. ∗p < 0.05; ∗∗p < 0.01; ∗∗∗p < 0.001. (F) Real-time PCR analysis revealing a decrease in the expression of ribosomal representative DBA causative genes in differentiated cells with RanGAP1 knockdown on Day 14. HSPCs were derived from human cord blood, and GAPDH was used as a reference gene in real-time PCR assays. Data are represented as mean ± SEM. ∗p < 0.05; ∗∗∗p < 0.001. (G) Western blotting detection of RanGAP1 overexpression in differentiated erythroid cells on day 7. (H) Overexpression of RanGAP1 rescues erythroid defects caused by OXPHOS suppression resulting from knockdown of NDUFA2. The percentage of CD71+GlyA + erythroid cells on day 7 in GFP-positive cells was compared using flow cytometry. (I) Overexpression of RanGAP1 rescues erythroid defects caused by OXPHOS suppression resulting from other mitochondrial OXPHOS complex inhibitors including Rot (0.1 μM), CAI (12 μM), Atovaquone (Ato, 40 μM) and mIBG (50 μM). The detection of CD71+GlyA+ double-positive erythroid cells (day 7) in GFP-positive cells with RanGAP1 overexpression using flow cytometry was conducted. See also Figures S3 and S4.
Figure 5
Figure 5
CoQ10 alleviates erythroid defects in differentiated cells with OXPHOS inhibition (A) Representative flow cytometry analysis revealing CoQ10 largely recovers the inhibition of OXPHOS caused by Rot treatment in differentiated HSPCs. The level of OXPHOS inhibition was inversely proportional to the ratio of the right peak count to the total count. (B) The ATP level was largely rescued by CoQ10 following Rot treatment in differentiated HSPCs. The data are from three independent experiments. Data are represented as mean ± SEM. ∗p < 0.05; ∗∗∗p < 0.001. (C) Expression of RanGAP1 was almost completely rescued by the addition of CoQ10 to differentiated HSPCs with OXPHOS suppression on Day 7. Expression of the SUMO1/RanGAP1 complex was detected using an anti-RanGAP1 antibody. (D) Representative flow cytometry analysis indicating an increased number of CD71+GlyA+ double-positive erythroid cells following the addition of CoQ10 to differentiating HSPCs with OXPHOS suppression on Day 7. Three independent experiments were performed.
Figure 6
Figure 6
Association of suppressed OXPHOS pathway with DBA pathology (A) Pathway enrichment analysis of downregulated DEGs in DBA samples against control samples indicating that the OXPHOS pathway was significantly suppressed in patients with DBA. In addition to the known mTOR and heme biosynthesis pathways, suppressed EIF2 signaling was also identified in DBA BM. (B) Heatmap analysis of genes in the OXPHOS pathway mapped to all DBA and control samples indicating that the OXPHOS pathway was suppressed in seven out of ten patients with DBA. P1-10 indicate the 10 patients with DBA; The gene set used is the same as in Figure 1B. (C) Heatmap analysis of genes in the ribosome biogenesis pathway against all DBA and control samples revealing that the ribosome biogenesis pathway was also suppressed in the same batch of DBA samples (7 of 10) as in those with the suppressed OXPHOS pathway. The gene set used is the same as in Figure 1C. P1-P10 indicates the 10 patients with DBA; (D). GSEA analysis revealing the enrichment of suppressed OXPHOS and ribosome pathway in DBA samples compared to that in controls. (E) Correlation analysis of OXPHOS and ribosome biogenesis pathway in patients with DBA. (F) Distribution of gene mutations in OXPHOS across 10 patients with DBA. The gene mutations that occurred in exons were comprehensively analyzed using the RNA-seq data of patients with DBA. See also Tables S1‒S3.

Similar articles

Cited by

References

    1. Oburoglu L., Romano M., Taylor N., Kinet S. Metabolic regulation of hematopoietic stem cell commitment and erythroid differentiation. Curr. Opin. Hematol. 2016;23:198–205. doi: 10.1097/MOH.0000000000000234. - DOI - PubMed
    1. Liu X., Zhang Y., Ni M., Cao H., Signer R.A.J., Li D., Li M., Gu Z., Hu Z., Dickerson K.E., et al. Regulation of mitochondrial biogenesis in erythropoiesis by mTORC1-mediated protein translation. Nat. Cell Biol. 2017;19:626–638. doi: 10.1038/ncb3527. - DOI - PMC - PubMed
    1. Richard A., Vallin E., Romestaing C., Roussel D., Gandrillon O., Gonin-Giraud S. Erythroid differentiation displays a peak of energy consumption concomitant with glycolytic metabolism rearrangements. PLoS One. 2019;14 - PMC - PubMed
    1. Steele S.L., Prykhozhij S.V., Berman J.N. Zebrafish as a model system for mitochondrial biology and diseases. Transl. Res. 2014;163:79–98. doi: 10.1016/j.trsl.2013.08.008. - DOI - PubMed
    1. Chen M.L., Logan T.D., Hochberg M.L., Shelat S.G., Yu X., Wilding G.E., Tan W., Kujoth G.C., Prolla T.A., Selak M.A., et al. Erythroid dysplasia, megaloblastic anemia, and impaired lymphopoiesis arising from mitochondrial dysfunction. Blood. 2009;114:4045–4053. doi: 10.1182/blood-2008-08-169474. - DOI - PMC - PubMed