

A two-step neural network-based guiding system for obtaining reliable radiographs for critical shoulder angle measurement
- PMID: 38415118
- PMCID: PMC10895144
- DOI: 10.21037/qims-23-610
A two-step neural network-based guiding system for obtaining reliable radiographs for critical shoulder angle measurement
Abstract
Background: The critical shoulder angle (CSA) has been reported to be highly associated with rotator cuff tears (RCTs) and an increased risk of RCT re-tears. However, the measurement of the CSA is greatly affected by the malpositioning of the shoulder. To address this issue, a two-step neural network-based guiding system was developed to obtain reliable CSA radiographs, and its feasibility and accuracy was evaluated.
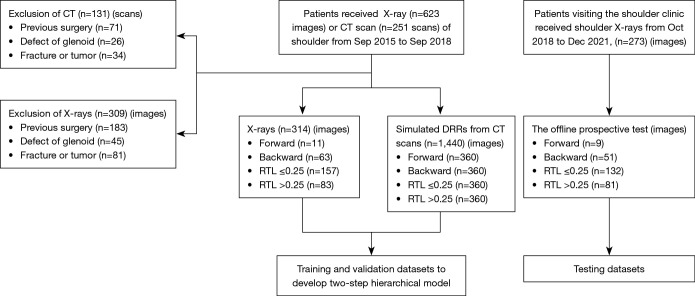
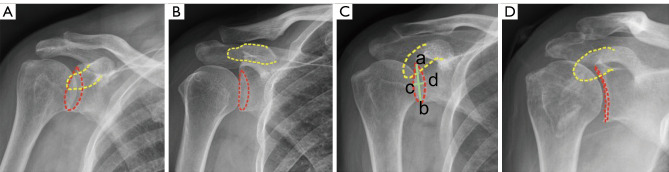
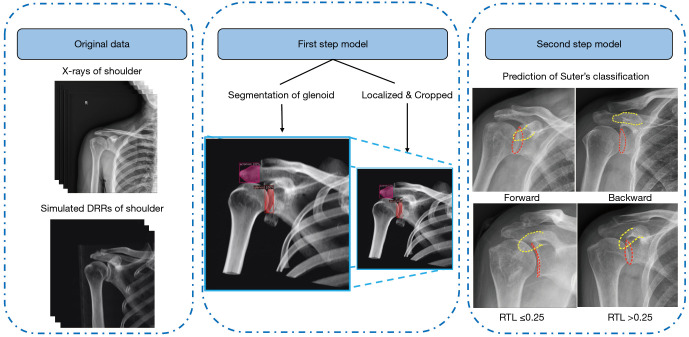
Methods: A total of 1,754 shoulder anteroposterior (AP) radiographs were retrospectively acquired to train and validate a two-step neural network-based guiding system to obtain reliable CSA radiographs. The study included patients aged 18 years or older who underwent X-rays and/or computed tomography (CT) scans of the shoulder. Patients who had undergone shoulder surgery, had a confirmed fracture, or were diagnosed with a musculoskeletal tumor or glenoid defect were excluded from the study. The system consisted of a two-step neural network that in the first step, localized the region of interest of the shoulder, and in the second step, classified the radiography according to type [i.e., 'forward' when the non-overlapping coracoid process is above the glenoid rim, 'backward' when the non-overlapping coracoid process is below or aligned with the glenoid rim, a ratio of the transverse to longitudinal diameter of the glenoid projection (RTL) ≤0.25, or a RTL >0.25]. The performance of the model was assessed in an offline, prospective manner, focusing on the sensitivity and specificity for the forward, backward, RTL ≤0.25, or RTL >0.25 types (denoted as SensF, B, -, + and SpecF, B, -, +, respectively), and Cohen's kappa was also reported.
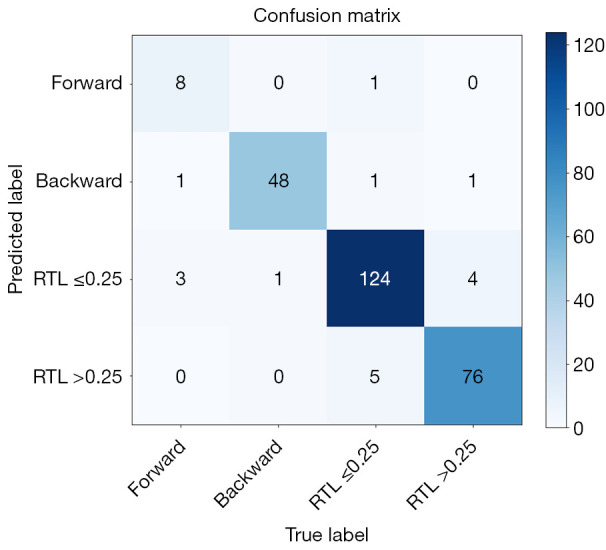
Results: Of 273 cases in the offline prospective test, the SensF, SensB, Sens-, and Sens+ were 88.88% [95% confidence interval (CI): 50.67-99.41%], 94.11% (95% CI: 82.77-98.47%), 96.96% (95% CI: 91.94-99.02%), and 95.06% (95% CI: 87.15-98.40%), respectively. The SpecF, SpecB, Spec-, and Spec+ were 98.48% (95% CI: 95.90-99.51%), 99.55% (95% CI: 97.12-99.97%), 95.04% (95% CI: 89.65-97.81%), and 97.39% (93.69-99.03%), respectively. A high classification rate (93.41%; 95% CI: 89.14-96.24%) and almost perfect agreement (Cohen's kappa: 0.903, 95% CI: 0.86-0.95) were achieved.
Conclusions: The guiding system can rapidly and accurately classify the types of AP shoulder radiography, thereby guiding the adjustment of patient positioning. This will facilitate the rapid obtainment of reliable CSA radiography to measure the CSA on proper AP radiographs.
Keywords: Computational neural networks; feasibility studies; shoulder radiography.
2024 Quantitative Imaging in Medicine and Surgery. All rights reserved.
Conflict of interest statement
Conflicts of Interest: All authors have completed the ICMJE uniform disclosure form (available at https://qims.amegroups.com/article/view/10.21037/qims-23-610/coif). R.Y. reports that this study received funding from the National Natural Science Foundation of China (No. 81972067), the Fundamental Research Funds for the Central Universities, Sun Yat-sen University (No. 2020004), and the National Natural Science Foundation of China (No. 82002342). The other authors have no conflicts of interest to declare.
Figures
Similar articles
-
The Ratio of the Transverse to Longitudinal Diameter of the Glenoid Projection Is of Good Predictive Value for Defining the Reliability of Critical Shoulder Angle in Nonstandard Anteroposterior Radiographs.Arthroscopy. 2021 Feb;37(2):438-446. doi: 10.1016/j.arthro.2020.08.036. Epub 2020 Oct 28. Arthroscopy. 2021. PMID: 33129967
-
The Critical Shoulder Angle Can be Accurately and Reliably Determined from Three-Dimensional Computed Tomography Images.Orthop Surg. 2023 Aug;15(8):2052-2061. doi: 10.1111/os.13652. Epub 2023 Jan 20. Orthop Surg. 2023. PMID: 36660945 Free PMC article.
-
Optimization of the Grashey View Radiograph for Critical Shoulder Angle Measurement: A Reliability Assessment With Zero Echo Time MRI.Orthop J Sports Med. 2022 Aug 12;10(8):23259671221109522. doi: 10.1177/23259671221109522. eCollection 2022 Aug. Orthop J Sports Med. 2022. PMID: 35982832 Free PMC article.
-
Critical shoulder angle and failure of conservative treatment in patients with atraumatic full thickness rotator cuff tears.BMC Musculoskelet Disord. 2022 Jun 10;23(1):561. doi: 10.1186/s12891-022-05519-y. BMC Musculoskelet Disord. 2022. PMID: 35689223 Free PMC article. Review.
-
Controversy on the Association of the Critical Shoulder Angle and the Development of Degenerative Rotator Cuff Tears: Is There a True Association? A Meta-analytical Approach.Am J Sports Med. 2022 Jul;50(9):2552-2560. doi: 10.1177/03635465211027305. Epub 2021 Aug 25. Am J Sports Med. 2022. PMID: 34432551
References
-
- İncesoy MA, Yıldız KI, Türk ÖI, Akıncı Ş, Turgut E, Aycan OE, Bayhan IA. The critical shoulder angle, the acromial index, the glenoid version angle and the acromial angulation are associated with rotator cuff tears. Knee Surg Sports Traumatol Arthrosc 2021;29:2257-63. 10.1007/s00167-020-06145-8 - DOI - PubMed
-
- Smith GCS, Liu V, Lam PH. The Critical Shoulder Angle Shows a Reciprocal Change in Magnitude When Evaluating Symptomatic Full-Thickness Rotator Cuff Tears Versus Primary Glenohumeral Osteoarthritis as Compared With Control Subjects: A Systematic Review and Meta-analysis. Arthroscopy 2020;36:566-75. 10.1016/j.arthro.2019.09.024 - DOI - PubMed
LinkOut - more resources
Full Text Sources