. 2024 Feb 14;3(2):pgae061.
doi: 10.1093/pnasnexus/pgae061. eCollection 2024 Feb.

Identifying content-invariant neural signatures of perceptual vividness

Affiliations

Identifying content-invariant neural signatures of perceptual vividness

Benjy Barnett et al. PNAS Nexus. .

Abstract

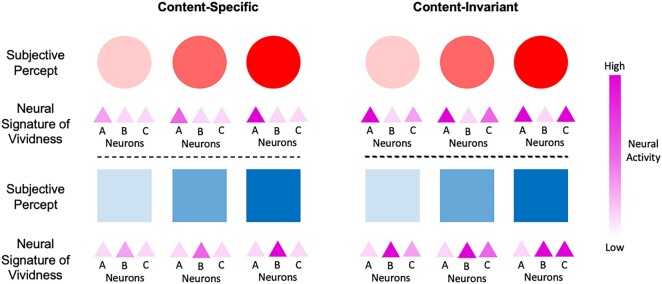
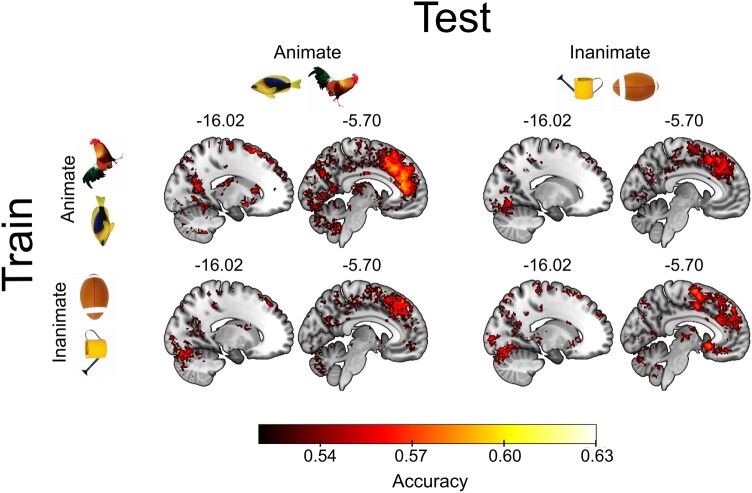
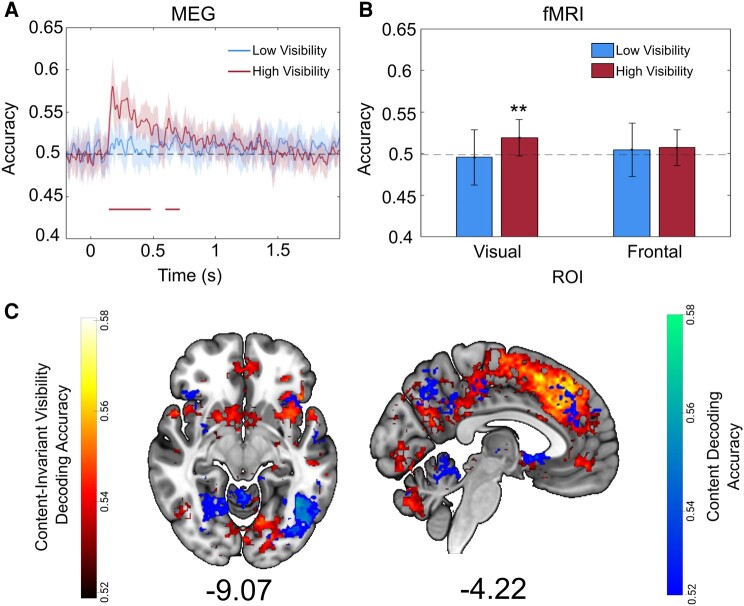
Some conscious experiences are more vivid than others. Although perceptual vividness is a key component of human consciousness, how variation in this magnitude property is registered by the human brain is unknown. A striking feature of neural codes for magnitude in other psychological domains, such as number or reward, is that the magnitude property is represented independently of its sensory features. To test whether perceptual vividness also covaries with neural codes that are invariant to sensory content, we reanalyzed existing magnetoencephalography and functional MRI data from two distinct studies which quantified perceptual vividness via subjective ratings of awareness and visibility. Using representational similarity and decoding analyses, we find evidence for content-invariant neural signatures of perceptual vividness distributed across visual, parietal, and frontal cortices. Our findings indicate that the neural correlates of subjective vividness may share similar properties to magnitude codes in other cognitive domains.

Keywords: MEG; awareness; fMRI; perception.


Figures

Fig. 1.
Fig. 1.
Hypothesized neural signatures of perceptual vividness. Left: Content-specific neural signatures associated with perceptual vividness. The subjective vividness of a red circle is associated with the strength of red circle–representing neurons (neuron A), while the vividness of a blue square is associated with the strength of blue square–representing neurons (neuron B). For example, as red circle–representing neurons increase their activity (top-left), the subjective percept of a red circle becomes more vivid. The neural signatures correlating with the vividness of red circles and blue squares are therefore different. Right: Content-invariant neural signatures associated with perceptual vividness. The subjective vividness of both red circles and blue squares is associated with a common neural signature (i.e. the activity of neuron C), which tracks vividness over and above any stimulus-specific neural activity (i.e. neurons A and B). Attention, emotion, and other cognitive factors may drive a content-invariant neural signal of vividness. We note that the hypothetical coding schemes represented here are not mutually exclusive, and it is possible that a combination of both schemes underpin the vividness of perceptual experience.
Fig. 2.
Fig. 2.
Experimental paradigms. A) Experimental paradigm for the MEG data collected by Andersen et al. (25). First, a fixation cross was presented for 500, 1,000, or 1,500 ms. Then, either a square or a diamond was shown for 33.3 ms, followed by a static noise mask for 2,000 ms. While the mask was shown, participants reported the identity of the target. Finally, they reported their awareness of the stimulus using the PAS scale. B) Stimuli used in Andersen et al. (25). C) Experimental paradigm for the fMRI data collected by Dijkstra et al. (26). A stimulus was presented for 17 ms, followed by a 66-ms ISI and a 400-ms mask. Participants then indicated whether the stimulus was animate or inanimate, and finally rated the visibility of the stimulus on a 4-point scale. D) Stimuli used in Dijkstra et al. (26).
Fig. 3.
Fig. 3.
Neural representations of perceptual visibility are abstract and graded. A) From left to right: Abstract-graded model where neural correlates of awareness ratings are independent of perceptual content and follow a graded structure; abstract-independent model where awareness ratings are independent of perceptual content but do not follow a graded structure; specific-graded model where awareness ratings are specific to the perceptual content to which they relate and follow a graded structure; specific-discrete (null hypothesis) model where there is no observable representational structure among awareness ratings (PAS ratings, NE, WG, ACE, CE). B) RSA reveals that the abstract-graded model was the best predictor of the representational structure of neural patterns in whole-brain sensor-level MEG data. Solid horizontal lines represent time points significantly different from 0 for a specific RDM at P < 0.05, corrected for multiple comparisons. Horizontal dots denote statistically significant paired comparisons between the different models at P < 0.05, corrected for multiple comparisons. We obtained similar findings across occipital (Fig. S1A) and frontal (Fig. S1B) sensors separately, as well as in datasets with stimulus contrast level regressed out (Fig. S2) and without baseline correction (Fig. S5). We also examined the pattern of classifier mistakes during cross-stimulus decoding, again revealing distance-like effects in perceptual visibility decoding (Fig. S4). C) Multidimensional scaling reveals a principal dimension encoding the magnitude of perceptual vividness across square stimuli (red squares) and diamond stimuli (blue diamonds). D) Shuffling and blending procedure. This analysis was performed to control for naturally occurring low-frequency content in neural data. E) Results from both shuffled models reflect the average Kendall's Tau over 1,000 shuffling permutations. Purple, red, and blue lines represent similarity of the abstract-graded, shuffled-discrete, and shuffled-graded models, respectively, with neural data. The shuffled-discrete line varies only slightly from 0 and is thus hard to see. The abstract-graded model is the only model under consideration that significantly predicted the neural data.
Fig. 4.
Fig. 4.
Abstract representations of perceptual visibility evolve rapidly over time. Main figure: Temporal generalization results for the classification of PAS ratings from MEG data (4 PAS responses; chance = 0.25). For each row, statistical comparisons between the two columns showed no significant differences in decoding accuracy between within- and cross-condition decoding. Nontranslucent regions within solid lines highlight above-chance decoding, as revealed by cluster-based permutation tests. We replicated these findings in nonbaseline-corrected data (Fig. S6).
Fig. 5.
Fig. 5.
Abstract representations of perceptual visibility are found across visual, parietal, and frontal cortex. Searchlight decoding in fMRI data revealed significantly above-chance accuracy in both cross-condition (off-diagonal cells of matrix) and within-condition (on-diagonal cells) in decoding of visibility ratings. Clusters of successful cross-condition decoding were found across the frontal, parietal, and visual cortex. Our statistical comparison of cross and within-condition decoding accuracy (comparing the on- and off-diagonal statistical maps) revealed no significant differences anywhere in the brain. Significance was assessed at P < 0.05, corrected for multiple comparisons with a false discovery rate of 0.01. Clusters are reported in Table S2.
Fig. 6.
Fig. 6.
Perceptual content can be decoded in high-visibility trials and shows distinct representations to visibility. A) Decoding of perceptual content on each trial (squares or diamonds) from participants’ whole-brain sensor-level MEG data for low-visibility (NE and WG) and high-visibility (ACE and CE) trials separately. Successful decoding was possible in high-visibility trials up to ∼700 ms poststimulus onset. Lines are smoothed using a Gaussian-weighted moving average with a window of 20 ms. Shaded area denotes 95% CIs. The solid horizontal line reflects above-chance decoding, as revealed by cluster-based permutation tests. B) Decoding of perceptual content on each trial (animate or inanimate) from participants’ fMRI data for low- and high-visibility trials separately. Decoding was successful in a visual ROI in high but not low-visibility trials, and unsuccessful in a frontal ROI. Asterisks denote significance at P < 0.01. Error bars illustrate 95% CIs. C) Searchlight decoding accuracy for content decoding in high visibility trials (blue) and for content-invariant visibility decoding (red). Clusters illustrate areas where content or content-invariant visibility could be decoded significantly above chance. Content-invariant representations of visibility were more widespread than content representations and extended into the prefrontal cortex, whereas both content and visibility could be decoded in distinct locations of the visual cortex. Significance was assessed at P < 0.05, corrected for multiple comparisons with an FDR of 0.01. Clusters are reported in Table S3.

Similar articles

References

    1. Chib VS, Rangel A, Shimojo S, O’Doherty JP. 2009. Evidence for a common representation of decision values for dissimilar goods in human ventromedial prefrontal cortex. J Neurosci. 29(39):12315–12320. - PMC - PubMed
    1. McNamee D, Rangel A, O’Doherty JP. 2013. Category-dependent and category-independent goal-value codes in human ventromedial prefrontal cortex. Nat Neurosci. 16(4):479–485. - PMC - PubMed
    1. Piazza M, Pinel P, Le Bihan D, Dehaene S. 2007. A magnitude code common to numerosities and number symbols in human intraparietal cortex. Neuron. 53(2):293–305. - PubMed
    1. Howard JD, Gottfried JA, Tobler PN, Kahnt T. 2015. Identity-specific coding of future rewards in the human orbitofrontal cortex. Proc Natl Acad Sci U S A. 112(16):5195–5200. - PMC - PubMed
    1. Klein-Flügge MC, Barron HC, Brodersen KH, Dolan RJ, Behrens TEJ. 2013. Segregated encoding of reward–identity and stimulus–reward associations in human orbitofrontal cortex. J Neurosci. 33(7):3202–3211. - PMC - PubMed