. 2024 Mar 29;134(7):892-912.
doi: 10.1161/CIRCRESAHA.122.322437. Epub 2024 Feb 28.

Acute Adenoviral Infection Elicits an Arrhythmogenic Substrate Prior to Myocarditis

Affiliations

Acute Adenoviral Infection Elicits an Arrhythmogenic Substrate Prior to Myocarditis

Rachel L Padget et al. Circ Res. .

Abstract

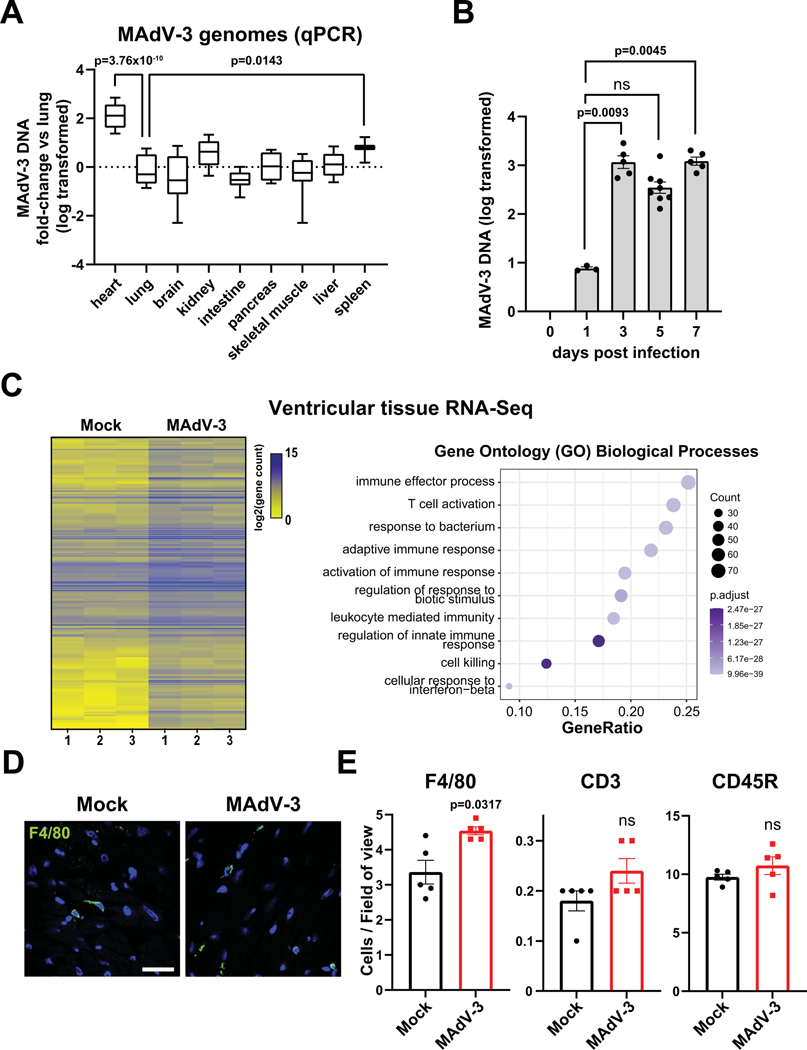
Background: Viral cardiac infection represents a significant clinical challenge encompassing several etiological agents, disease stages, complex presentation, and a resulting lack of mechanistic understanding. Myocarditis is a major cause of sudden cardiac death in young adults, where current knowledge in the field is dominated by later disease phases and pathological immune responses. However, little is known regarding how infection can acutely induce an arrhythmogenic substrate before significant immune responses. Adenovirus is a leading cause of myocarditis, but due to species specificity, models of infection are lacking, and it is not understood how adenoviral infection may underlie sudden cardiac arrest. Mouse adenovirus type-3 was previously reported as cardiotropic, yet it has not been utilized to understand the mechanisms of cardiac infection and pathology.

Methods: We have developed mouse adenovirus type-3 infection as a model to investigate acute cardiac infection and molecular alterations to the infected heart before an appreciable immune response or gross cardiomyopathy.

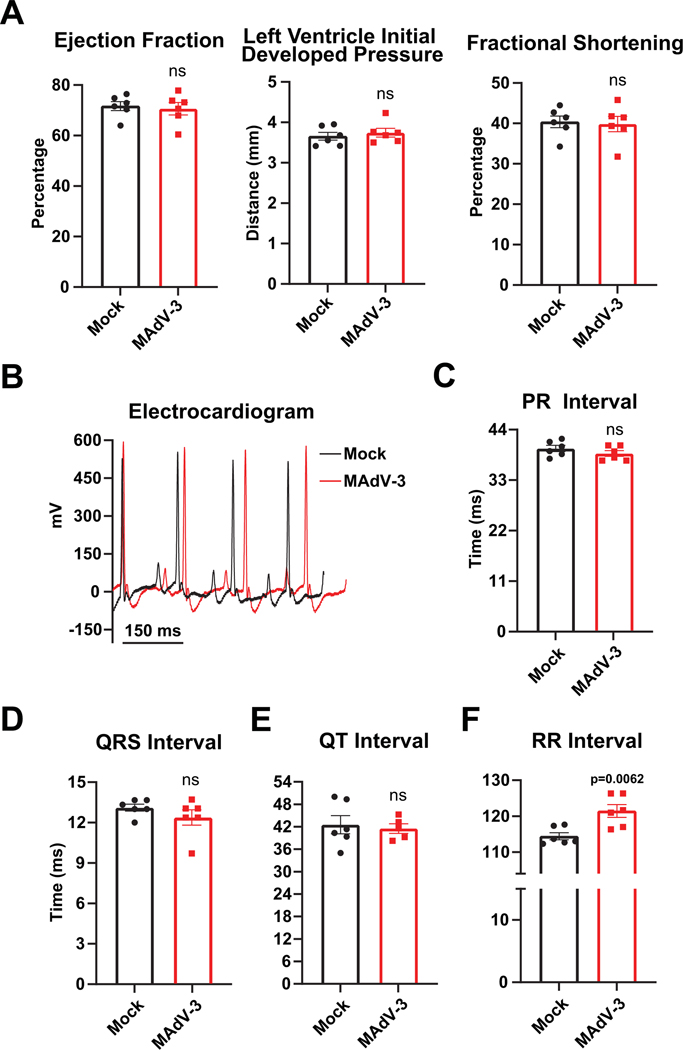
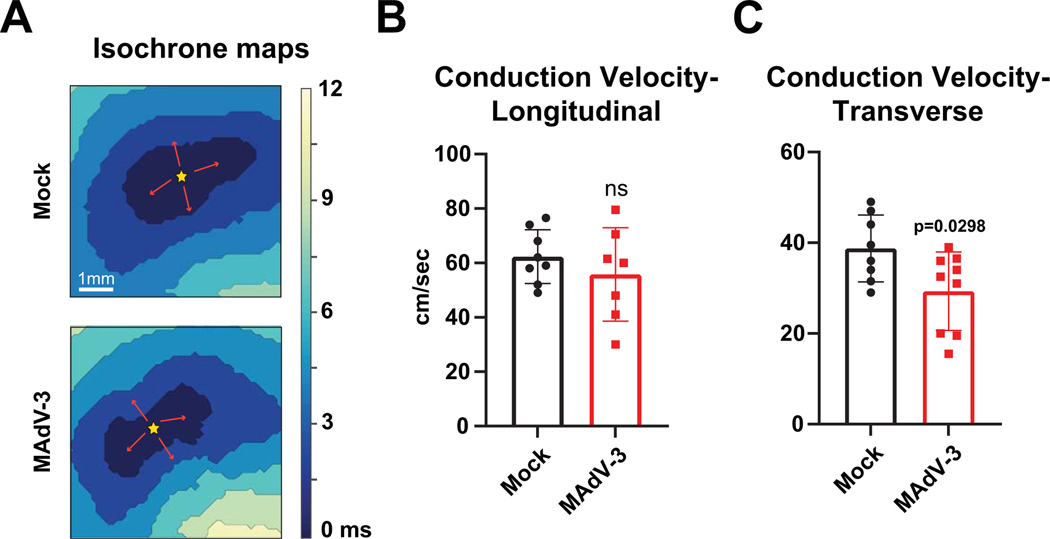
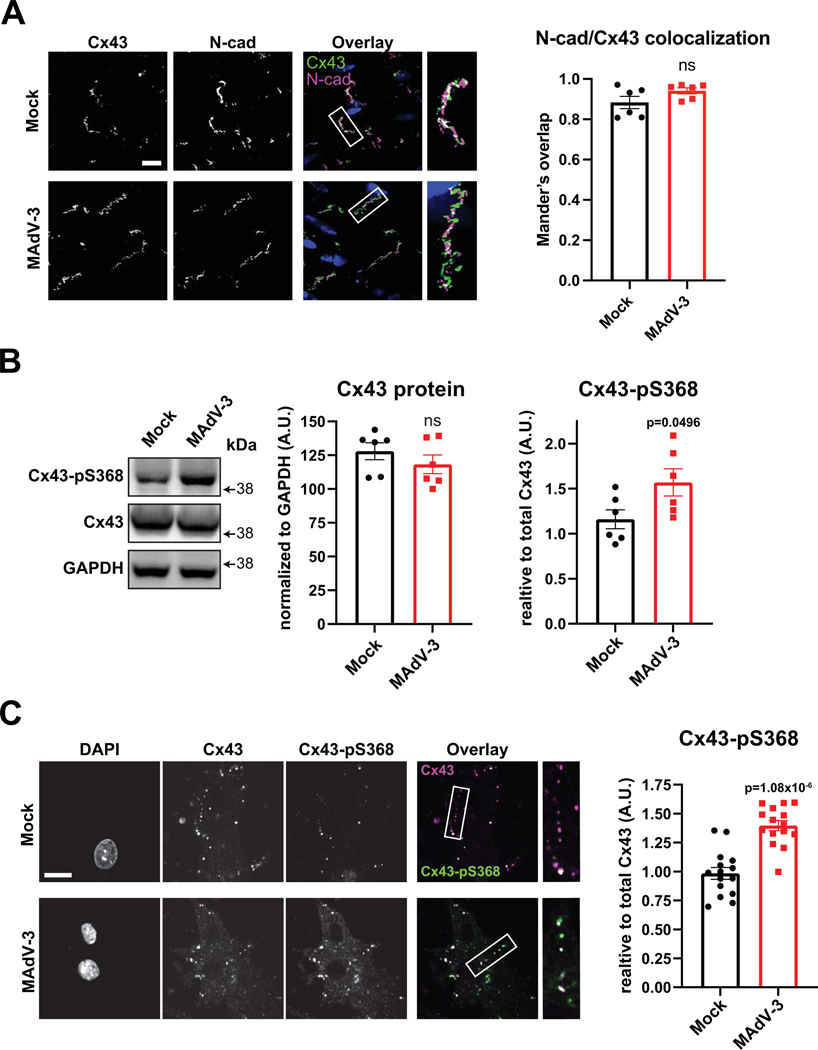
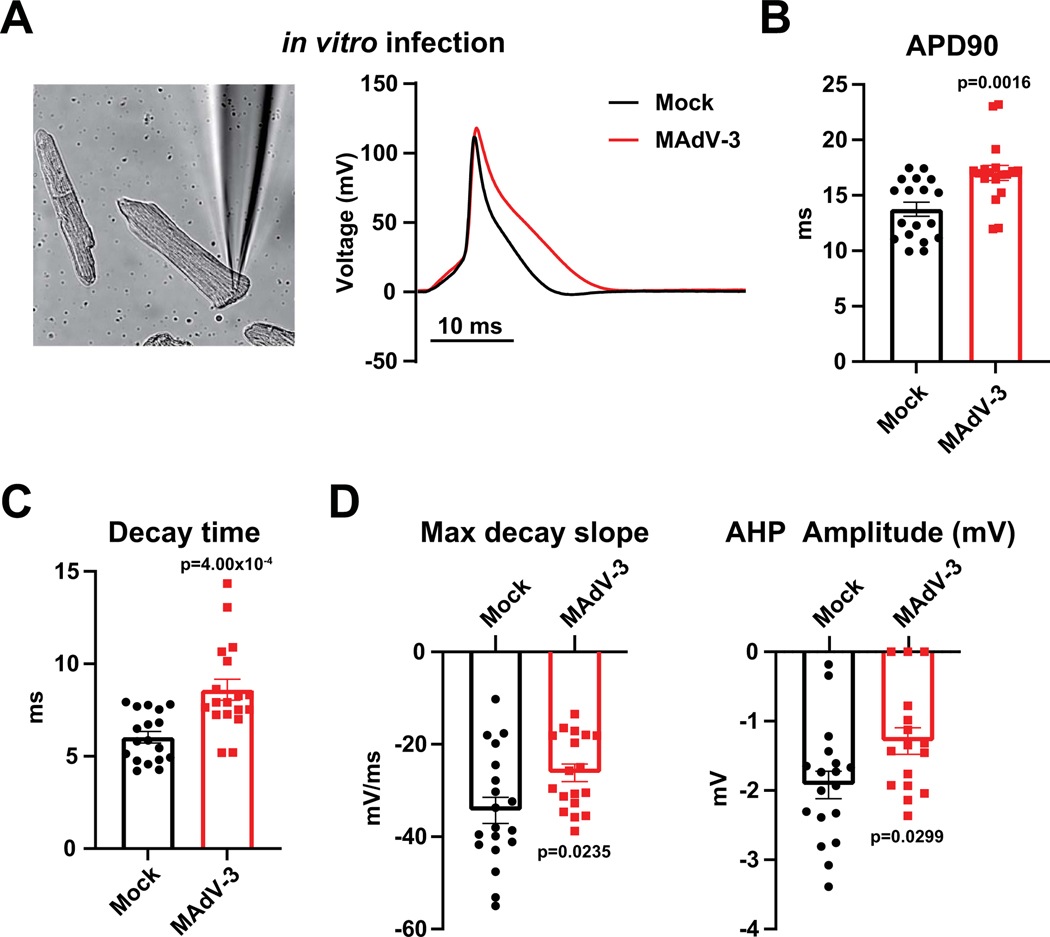
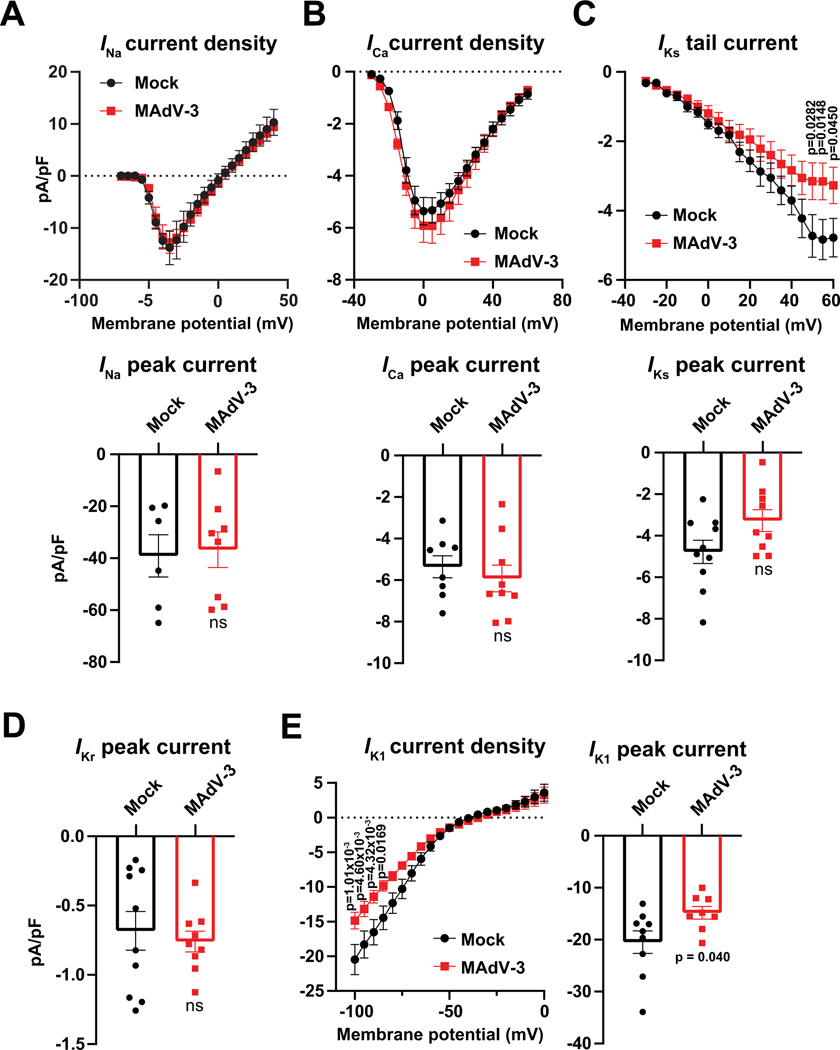
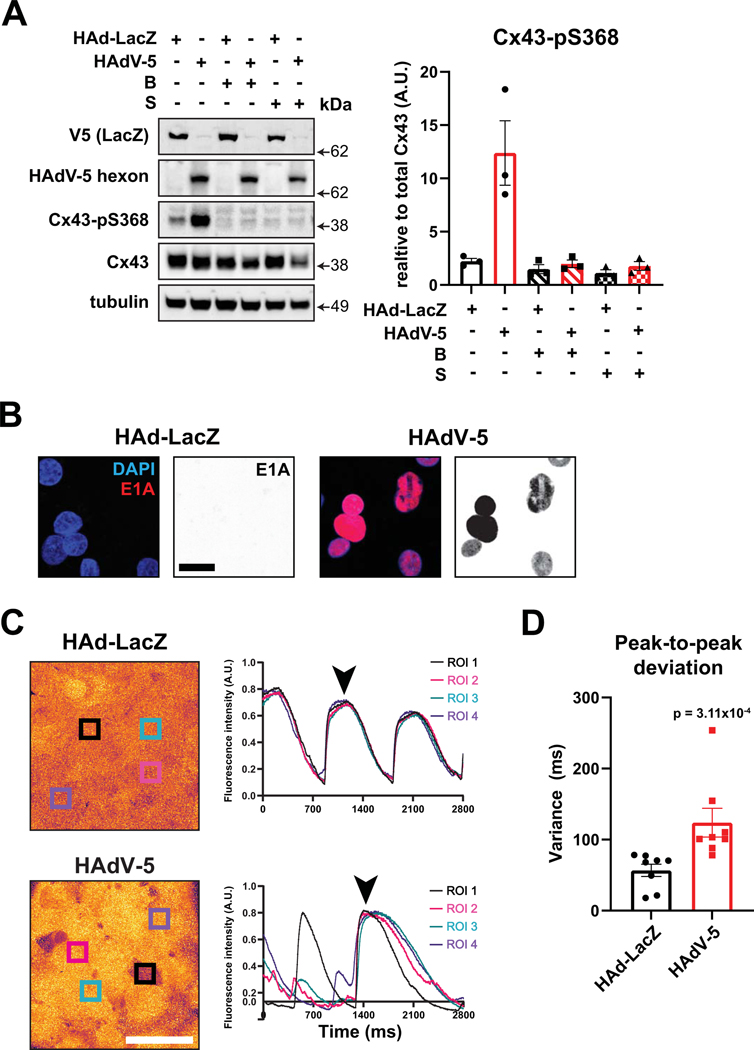
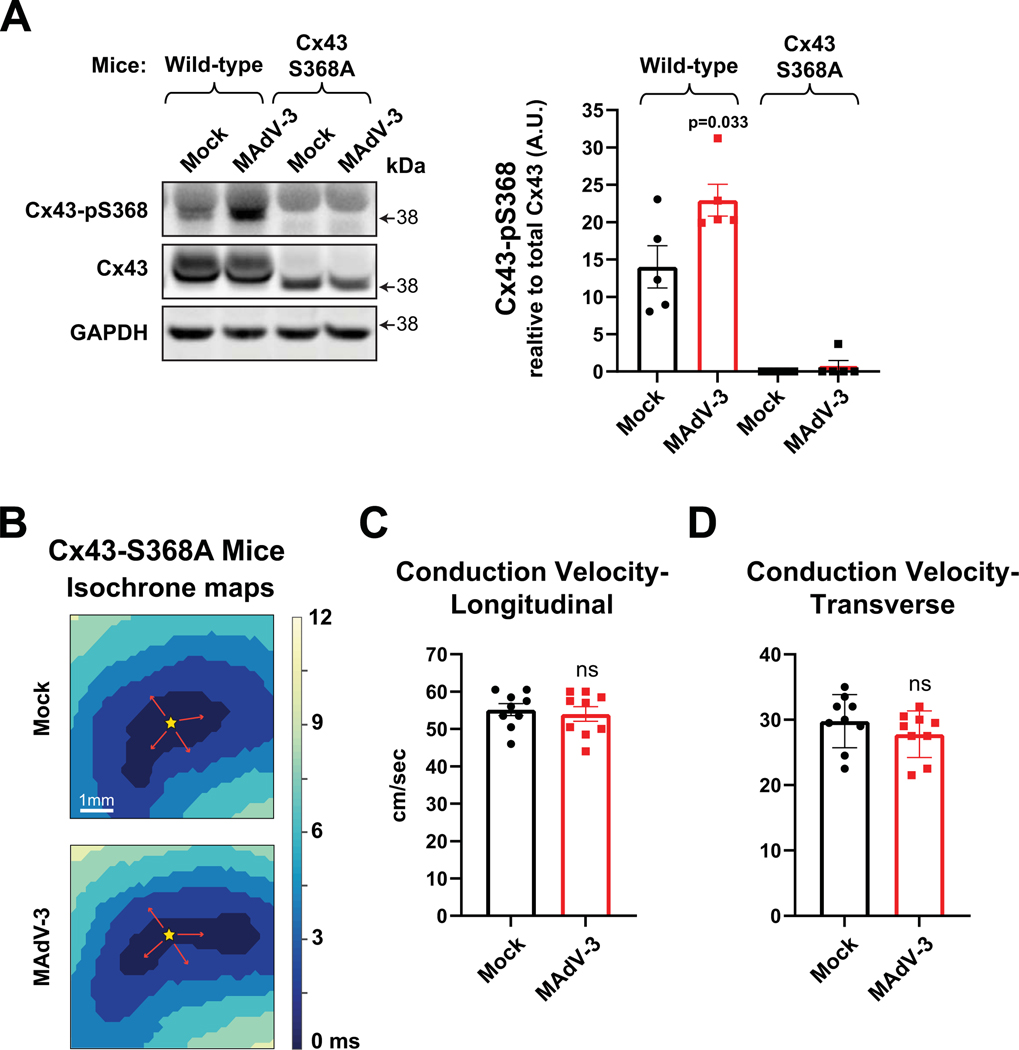
Results: Optical mapping of infected hearts exposes decreases in conduction velocity concomitant with increased Cx43Ser368 phosphorylation, a residue known to regulate gap junction function. Hearts from animals harboring a phospho-null mutation at Cx43Ser368 are protected against mouse adenovirus type-3-induced conduction velocity slowing. Additional to gap junction alterations, patch clamping of mouse adenovirus type-3-infected adult mouse ventricular cardiomyocytes reveals prolonged action potential duration as a result of decreased IK1 and IKs current density. Turning to human systems, we find human adenovirus type-5 increases phosphorylation of Cx43Ser368 and disrupts synchrony in human induced pluripotent stem cell-derived cardiomyocytes, indicating common mechanisms with our mouse whole heart and adult cardiomyocyte data.

Conclusions: Together, these findings demonstrate that adenoviral infection creates an arrhythmogenic substrate through direct targeting of gap junction and ion channel function in the heart. Such alterations are known to precipitate arrhythmias and likely contribute to sudden cardiac death in acutely infected patients.

Keywords: adenoviridae; arrhythmias, cardiac; death, sudden, cardiac; gap junctions; immunity; ion channels.


Conflict of interest statement

Disclosures None.

Figures

Figure 1.
Figure 1.. Mouse adenovirus type-3 is cardiotropic and does not invoke an appreciable infiltrative cardiac immune response during acute infection.
Mice were infected retro-orbitally with 5×10⁵ i.u. MAdV-3 or saline (mock) and tissues were harvested 7 d.p.i. A) Using quantitative PCR, MAdV-3 viral genomes were measured across major organs and compared to organ lung tissue as a reference. (heart n=10, lung n=8, brain n=10, kidney n=10, intestine n=10, pancreas n=4, skeletal muscle n=8, liver n=12, spleen n=10). B) In heart tissue alone, MAdV-3 viral genomes were quantified by qPCR over a 7 day time course. C) RNA-Seq from ventricular tissue from control and infected animals (n=3). Left: heat map of the log2-transformed gene counts for all significant differentially expressed genes (DEGs) in infected animals compared to control (adjusted p-value < 0.05, absolute log2 fold change > 1.0). Right: gene ontology (GO) plot demonstrating the top 10 significant GO terms for biological processes identified through over-representation analysis using significant DEGs. D) Confocal immunofluorescence microscopy of ventricular cryosections labeled for infiltrating macrophages (F4/80, green; scale bar: 25 μm). E) Quantification of numbers of F4/80+, CD3+, and CD45R+ cells per field of view from confocal immunofluorescence microscopy. (n=5; 10 fields of view per heart). (A), One-way ANOVA with Dunnett’s multiple comparisons test ****p = 3.76 × 10⁻¹⁰, *p = 0.0143. (B), Kruskal-Wallis with Dunnett’s multiple comparisons test day 3 **p= 9.32 × 10⁻³, day 7 **p = 4.45 × 10⁻³. (E), Mann Whitney test F4/80+ *p = 0.0317. Data are represented as mean ± SEM.
Figure 2.
Figure 2.. Acute cardiac adenoviral infection slows heart rate but does not alter ECG morphology or induce gross cardiomyopathy.
In vivo echocardiography and electrocardiography were performed 7 d.p.i. in mock- or MAdV-3-infected mice. A) Cardiac function was measured by echocardiography on lightly anesthetized mock- and MAdV-3-infected mice (n=6). B) Representative in vivo electrocardiography measurements from lightly anesthetized mock- and MAdV-3-infected mice using paw pad electrodes. C-F) Quantification of PR, QRS, QT, and RR intervals from B. **p = 6.2 × 10⁻³, student’s t-test (n=6).
Figure 3.
Figure 3.. Acute cardiac adenoviral infection results in reduced ventricular conduction velocity.
Ex vivo optical mapping was performed on Langendorff-perfused hearts 7 d.p.i. from mock- or MAdV-3-infected mice. A) Example isochrone maps paced at a cycle length of 150 ms with 1 ms pulse duration. B, C) Conduction velocity in longitudinal (CVL)and transverse (CVT) directions was quantified (n=8,9). * p = 0.0298, student’s t-test. Data are represented as mean ± SEM.
Figure 4.
Figure 4.. Acute adenovirus infection elicits increased connexin43 Ser368 phosphorylation in hearts and primary cardiomyocytes.
Mice were infected retro-orbitally with 5×10⁵ i.u. MAdV-3 or saline (mock) and cardiac tissue was harvested 7 d.p.i. for analyses. A) SORA confocal microscopy of Cx43 (green) and N-cadherin (magenta) with quantification of colocalization by Mander’s coefficient (scale bar 10 μm; n=6), not significant Mann-Whitney test. B) Western blotting of cardiac ventricle tissue probed for phospho-Cx43 Ser368, Cx43, with GAPDH as loading control to normalize total Cx43 quantitation on left and phospho-Cx43 Ser368 normalized to total on right (n=6). student’s t-test. *p = 0.0496. C) Confocal immunofluorescence microscopy of primary mouse neonatal ventricular cardiomyocytes 24 h.p.i. with MAdV-3 labeled for total Cx43 (magenta) and phospho-Cx43 Ser368 (green) (scale bar: 25 μm; n=15 fields of view from 3 replicates; ****p = 1.08 × 10⁻⁶ B,C) Data are represented as mean ± SEM.
Figure 5.
Figure 5.. Acute mouse adenovirus infection alters ion channel gene expression in vivo and prolongs ventricular cardiomyocyte action potential duration in vitro.
Isolated ACMs were either infected with MAdV-3 at an MOI 10 or not and harvested 24 h.p.i. in vitro. A) Representative image of ACMs used for patch clamp experiments with representative action potential traces recorded from uninfected (black) and MAdV-3-infected (red) cells. B) Action potential duration at 90% repolarization was recorded in uninfected and MAdV-3-infected ACMs (n=18). Mann-Whitney U test **p = 1.60 × 10⁻³ C) Decay time was recorded in uninfected and MAdV-3-infected ACMs (n=18). ***p = 4.00 × 10⁻⁴ D) Max decay slope and afterpolarization amplitude was recorded in uninfected and MAdV-3-infected ACMs (n=18). Max decay slope *p = 0.0235, AHP amplitude *p = 0.0299 student’s t-test. Data are represented as mean ± SEM.
Figure 6.
Figure 6.. Acute mouse adenovirus infection decreases IK1 and IKS current density in isolated adult mouse cardiomyocytes.
Isolated ACMs were infected with MAdV-3 at an MOI 10 and analyzed 24 h.p.i. A) Current density measured isolated ACMs at 24 h.p.i. for INa, n=6,8. B) Current density measured isolated ACMs at 24 h.p.i. for ICa, n=8,9 C) Current density measured isolated ACMs at 24 h.p.i. for IKs,n=10, 9, Two-way ANOVA with Šidák’s multiple comparisons test adjusted *p value = 0.0282, 0.0148, 0.045, D) Current density measured isolated ACMs at 24 h.p.i. for IKr, n=10,9. E) Current density measured isolated ACMs at 24 h.p.i. for IK1, n=9,8. Two-way ANOVA with Šidák’s multiple comparisons test adjusted *p value = 1.01 × 10⁻³, 4.60 × 10⁻³, 4.32 × 10⁻³, 0.0169 Peak current IK1 student’s t-test *p = 0.04. Data are represented as mean ±SEM.
Figure 7.
Figure 7.. Human Adenovirus Type-5 infection increases Cx43-Ser368 phosphorylation through PKC activation and uncouples HiPSC-derived cardiomyocytes.
HiPSC-CMs were infected with HAdV-LacZ or HAdV-5 at an MOI 10 and studies performed 24 h.p.i. A) PKC inhibitors bisindolylmaleimide VIII “B” or sotrastaurin “S” were added 1 h post infection. Western blotting of cells probed for phospho-Cx43 Ser368 with quantification normalized to total Cx43 on right (n=3), Kruskal-Wallis with Dunnett’s multiple comparisons test. B) Confocal immunofluorescence microscopy from fixed HiPSC-CMs to detect nuclei (blue) and Human Adenoviral protein E1A (red) (scale bar: 25 μm). C) Live-cell confocal microscopy 24 h.p.i. using Fluo-4 AM to measure Ca2+ transients and quantification of fluorescence signaling over time in one field of view. Black arrowheads indicate peak fluorescence timepoints where representative images are taken from (scale bar: 80 μm). D) Average peak-to-peak fluorescence intensity variance measured per cell over time (n=8,9). Mann Whitney test ***p = 3.11 × 10⁻⁴ (D). Data are represented as mean ± SEM.
Figure 8.
Figure 8.. Ablation of Cx43 Ser368 phosphorylation protects against cardiac conduction slowing during acute MAdV-3 infection.
Western blotting and ex vivo optical mapping was performed on hearts 7 d.p.i. from mock- or MAdV-3-infected wild-type mice and mice harboring a Cx43-Ser368-Ala mutation. A) Western blotting of cardiac ventricle tissue probed for phospho-Cx43 Ser368, total Cx43, and GAPDH as loading control with quantification of phospho-Cx43 Ser368 normalized to total Cx43 on right (n=5), student’s t-test of wild-type (several Cx43-S368A samples below detectable limits) *p = 0.033. B) Example isochrone maps paced at a cycle length of 150 ms with 1 ms pulse duration. C, D) Conduction velocity in longitudinal (CVL) and transverse (CVT) directions was quantified (n=9,9), student’s t-test, not significant. Data are represented as mean ± SEM.

Similar articles

Cited by

References

    1. Babu-Narayan SV, McCarthy KP, Ho SY, Magee AG, Kilner PJ, Sheppard MN. Images in cardiovascular medicine. Myocarditis and sudden cardiac death in the young: extensive fibrosis suggested by cardiovascular magnetic resonance in vivo and confirmed post mortem. Circulation. 2007;116:e122–125. doi: 10.1161/CIRCULATIONAHA.107.693085 - DOI - PubMed
    1. Dennert R, Crijns HJ, Heymans S. Acute viral myocarditis. Eur Heart J. 2008;29:2073–2082. doi: 10.1093/eurheartj/ehn296 - DOI - PMC - PubMed
    1. Baksi AJ, Kanaganayagam GS, Prasad SK. Arrhythmias in viral myocarditis and pericarditis. Card Electrophysiol Clin. 2015;7:269–281. doi: 10.1016/j.ccep.2015.03.009 - DOI - PubMed
    1. Woodruff JF. Viral myocarditis. A review. The American journal of pathology. 1980;101:425–484. - PMC - PubMed
    1. Blauwet LA, Cooper LT. Myocarditis. Prog Cardiovasc Dis. 2010;52:274–288. doi: 10.1016/j.pcad.2009.11.006 - DOI - PMC - PubMed