. 2024 Feb;12(2):e1160.
doi: 10.1002/iid3.1160.

Sirtuin2 suppresses the polarization of regulatory T cells toward T helper 17 cells through repressing the expression of signal transducer and activator of transcription 3 in a mouse colitis model

Affiliations

Sirtuin2 suppresses the polarization of regulatory T cells toward T helper 17 cells through repressing the expression of signal transducer and activator of transcription 3 in a mouse colitis model

Liuqing Ge et al. Immun Inflamm Dis. 2024 Feb.

Abstract

Introduction: Regulatory T cells (Tregs) play an important role in inflammatory bowel diseases (IBDs) through modulating intestinal inflammation. However, the factors affecting Treg function and plasticity during IBD progression are not thoroughly disclosed. The current study aims to reveal new molecular mechanisms affecting Treg plasticity.

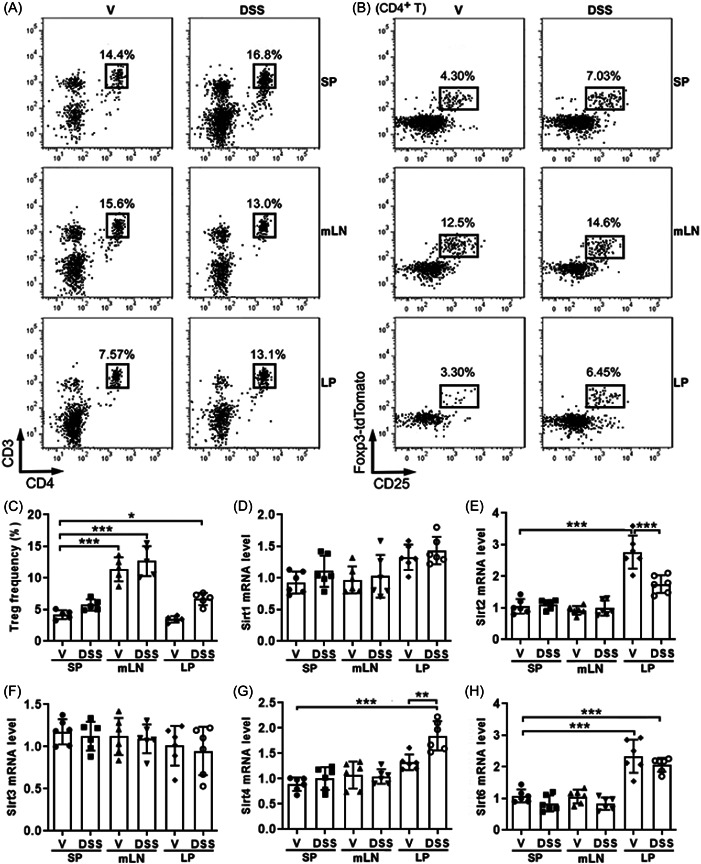
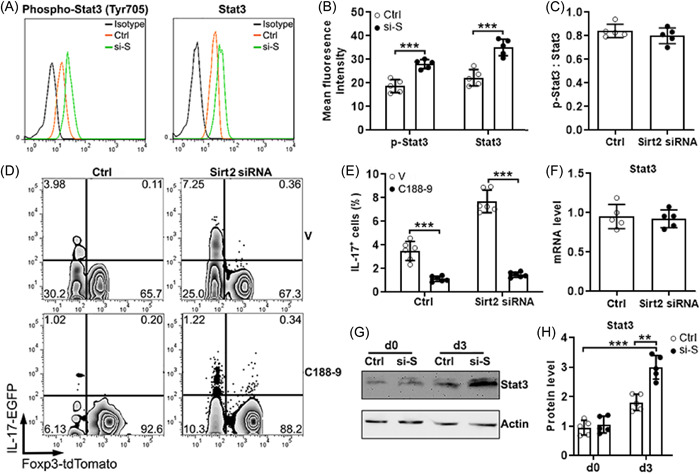
Methods: A mouse strain, in which tdTomato and enhanced green fluorescent protein were under the control of the Foxp3 promoter and Il17a promoter, was established and subjected to colitis induction with dextran sulfate sodium. The existence of Tregs and IL-17-expressing Tregs (i.e., Treg/T helper 17 [Th17] cells) were observed and sorted from the spleen, mesenteric lymph nodes, and lamina propria by flow cytometry, followed by measuring Sirtuin2 (Sirt2) expression using quantitative reverse transcription polymerase chain reaction and Immunoblotting. Lentivirus-induced Sirt2 silencing was applied to determine the impact of Sirt2 on Treg polarization to Treg/Th17 cells and even Th17 cells. The effect of Sirt2 on Stat3 was analyzed by flow cytometry and immunoblotting.

Results: Sirt2 was highly expressed in lamina propria Tregs and it moderately suppressed Foxp3 expression as well as the immunosuppressive function of Tregs. Surprisingly, lentivirus-mediated Sirt2 silencing promoted the generation of Treg/Th17 cells out of Tregs. Sirt2 silencing also enhanced the generation of Th17 cells out of Tregs under the Th17 induction condition. Furthermore, Sirt2 inhibited Th17 induction by suppressing the protein level of the signal transducer and activator of transcription 3.

Conclusion: Sirt2 suppresses Treg function but also inhibits Treg polarization toward Treg/Th17 cells and Th17 cells. The ultimate effect of Sirt2 on colitis might depend on the balance among Tregs, Treg/Th17 cells, and Th17 cells.

Keywords: Sirtuin2; T helper 17 cells; inflammatory bowel disease; regulatory T cells; signal transducer and activator of transcription 3.


Conflict of interest statement

The authors declare no conflict of interest.

Figures

Figure 1
Figure 1
The expression of Foxp3‐tdTomato and interleukin (IL)‐17‐EGFP in regulatory T cells (Tregs) and T helper 17 (Th17) cells of the Foxp3‐tdTomato‐IL17a‐EGFP mouse strain. (A) Identification of 7‐AAD live cells (left panel) and CD4+ T cells (right panel) in splenocytes by flow cytometry. (B) Identification of CD25+Foxp3‐tdTomato+ Tregs (left panel) and IL‐17‐EGFP+ Th17 cells (right panel) in splenic CD4+ T cells. (C) Identification of Foxp3‐tdTomato+ Tregs (left panel) and IL‐17‐EGFP+ Th17 cells (right panel) in sorted splenic CD4+ T cells after 3‐day Treg induction using agonistic antibodies and transforming growth factor (TGF)‐β1 (left panel) or 4‐day Th17 induction using agonistic antibodies plus IL‐6, TGF‐β1, IL‐23, neutralizing anti‐IL‐4 antibody, and neutralizing anti‐interferon‐γ antibody (right panel). (D) Co‐expression of Foxp3‐tdTomato and IL‐17‐EGFP in CD4+ T cells after Treg induction (left panel) or Th17 induction (right panel). The data represent two independent experiments.
Figure 2
Figure 2
The expression of Sirtuins in regulatory T cells (Tregs). (A) Identification of CD4+ T cells in the spleens (SP), mesenteric lymph nodes (mLN), and lamina propria (LP). (B) Identification of Foxp3‐tdTomato+ Tregs in CD4+ T cells in the SP, mLN, and LP. (C) Frequencies of Foxp3‐tdTomato+ Tregs in CD4+ T cells in indicated tissues. (D–H) messenger RNA levels of indicated Sirtuins in sorted CD4+ tdTomato+ Tregs. N = 6 per group. *p < .05. **p < .01. ***p < .001. One‐way analysis of variance. DSS, dextran sulfate sodium‐treated colitic mice; V, vehicle‐treated mice.
Figure 3
Figure 3
Sirt2 expression in regulatory T cells (Tregs) and Treg/T helper 17 (Th17) cells. (A) Representative flow cytometry zebra plots showing Foxp3‐tdTomato+interleukin (IL)‐17‐EGFP Tregs and Foxp3‐tdTomato+IL‐17‐EGFP+ Treg/Th17 in the spleens (SP), mesenteric lymph nodes (mLN), and lamina propria (LP). (B) The frequencies of IL‐17‐EGFP+ Treg/Th17 cells in indicated tissues. (C) Sirt2 messenger RNA levels in IL‐17‐EGFP Tregs and IL‐17−EGFP+ Treg/Th17 cells that were sorted from colitic mice. (D) Sirt2 protein levels in IL‐17‐EGFP Tregs and IL‐17‐EGFP+ Treg/Th17 cells that were sorted from colitic mice. N = five to six per group. **p < .01; ***p < .001. Student's t test. DSS, dextran sulfate sodium‐treated colitic mice; IL‐17, IL‐17‐EGFP Tregs; IL‐17+, IL‐17‐EGFP+ Treg/Th17 cells; V, vehicle‐treated mice.
Figure 4
Figure 4
The effect of Sirt2 silencing on regulatory T cell (Treg)/T helper 17 (Th17) generation without stimulation. (A) Representative flow cytometry zebra plots showing the expression of interleukin (IL)‐17‐EGFP and Foxp3‐tdTomato in sorted lamina propria CD4+ tdTomato+EGFP Tregs after lentiviral transduction. 24 h, 24 h after transduction; 48 h, 48 h after transduction; Ctrl, control lentivirus encoding a scrambled siRNA; Fresh, freshly sorted Tregs; Sirt2 siRNA, Sirt2 siRNA‐encoding lentivirus. (B and C) The frequencies of Foxp3‐tdTomato+, Foxp3‐tdTomato, and IL‐17‐EGFP+ cells in Tregs 24 h (B) or 48 h (C) after lentiviral transduction. Ctrl, cells transfected with control lentivirus; Si‐S, cells transfected with Sirt2 siRNA‐encoding lentivirus. (D) Messenger RNA (mRNA) levels of indicated cytokines 48 h after lentiviral transduction. Fresh: freshly sorted Tregs. (E) Sirt2 mRNA levels after transduction. (F) Representative histograms showing the dilution of CellTrace Violet in activated conventional CD4+ T cells after 5‐day coculture with Tregs. Alone: conventional CD4+ T cells alone. Ctrl Tregs: conventional CD4+ T cells co‐cultured with control Tregs. Sirt2‐silenced Tregs: conventional CD4+ T cells co‐cultured with Sirt2‐silenced Tregs. (G) Statistics of CellTrace Violet intensities. N = three to six per group. *p < .05; **p < .01; ***p < .001. Student's t test for (B), (C), and (E). One‐way analysis of variance for (D) and (G).
Figure 5
Figure 5
The effect of Sirtuin2 (Sirt2) silencing on regulatory T cells (Tregs) after T helper 17 (Th17) induction. (A) Representative flow cytometry zebra plots showing the expression of interleukin (IL)‐17‐enhanced green fluorescent protein (EGFP) and and Forkhead box P‐3 (Foxp3)‐tdTomato in sorted lamina propria CD4+ tdTomato+EGFP Tregs after lentiviral transduction and Th17 induction. Ctrl, cells transduced with control lentivirus; Si‐S, cells transduced with Sirt2 siRNA‐encoding lentivirus. (B) The frequencies of IL‐17‐EGFP+ cells and Foxp3‐tdTomato+ cells in Tregs after lentiviral transduction and Th17 induction. (C, D) Messenger RNA levels of IL‐22 (C) and retinoic‐acid‐receptor‐related orphan nuclear receptor gamma (D) in Tregs after lentiviral transduction and Th17 induction. Fresh: freshly sorted Tregs as the negative control. (E) Representative flow cytometry histograms showing Ki67 stain in Tregs after lentiviral transduction and Th17 induction. The data represent two independent experiments. N = 6 per group. **p < .01; ***p < .001. Student's t test.
Figure 6
Figure 6
Involvement of the Sirtuin3 (Sirt3) signaling in Sirtuin2 (Sirt2)‐mediated effect. (A) Representative flow cytometry histograms showing the expression of phosphorylated Stat3 (left panel) and total Sta3 (right panel) in regulatory T cells (Tregs) after lentiviral transduction and T helper 17 (Th17) induction. Ctrl, cells transduced with control lentivirus; Isotype, isotype antibody control; Si‐S, cells transduced with Sirt2 siRNA‐encoding lentivirus. (B) Statistics of the mean fluorescent intensities of phosphorylated Stat3 (p‐Stat3) and total Stat3 in Tregs in (A). (C) The ratios of phosphorylated Stat3 (p‐Stat3) to total Stat3 in Tregs in (A). (D) Representative flow cytometry zebra plots showing the expression of interleukin (IL)‐17‐EGFP and Foxp3‐tdTomato in Tregs after lentiviral transduction and Th17 induction in the presence or absence of C188‐9. V: DMSO. (E) Statistics of the frequencies of IL‐17‐EGFP+ cells in (D). (F) Sirt2 messenger RNA levels in Tregs after lentiviral transduction and Th17 induction. (G) Immunoblotting images showing Stat3 proteins in Tregs on Day 0 (d0) and Day 3 (d3) after Th17 induction. (H) Statistics of normalized Stat3 protein levels in (G). N = five to six per group. ***: p < .001. Student's t test. DMSO, dimethyl sulfoxide.
Figure 7
Figure 7
Overview of the findings. Foxp3, Forkhead box P‐3; Sirt2, Sirtuin2; Sirt3, Sirtuin3; RORγt, retinoic‐acid‐receptor‐related orphan nuclear receptor gamma T; Th17, T helper 17; Treg, regulatory T cell.

Similar articles

Cited by

  • Challenges in the preclinical design and assessment of CAR-T cells.
    Tomai R, De Las Rivas J, Fetica B, Bergantim R, Filipic B, Gagic Z, Nikolic K, Gulei D, Kegyes D, Nistor M, Muresan XM, Cenariu D, Feder R, Pavel-Tanasa M, Cianga A, Tigu AB, Munteanu R, Tanase A, Einsele H, Tomuleasa C. Tomai R, et al. Front Immunol. 2025 Aug 8;16:1564998. doi: 10.3389/fimmu.2025.1564998. eCollection 2025. Front Immunol. 2025. PMID: 40861448 Free PMC article. Review.

References

    1. Silva FAR, Rodrigues BL, Ayrizono MLS, Leal RF. The immunological basis of inflammatory bowel disease. Gastroenterol Res Pract. 2016;2016:1‐11. - PMC - PubMed
    1. Bouma G, Strober W. The immunological and genetic basis of inflammatory bowel disease. Nat Rev Immunol. 2003;3:521‐533. - PubMed
    1. Steinbach EC, Plevy SE. The role of macrophages and dendritic cells in the initiation of inflammation in IBD. Inflamm Bowel Dis. 2014;20:166‐175. - PMC - PubMed
    1. Stagg AJ. Intestinal dendritic cells in health and gut inflammation. Front Immunol. 2018;9:2883. - PMC - PubMed
    1. Imam T, Park S, Kaplan MH, Olson MR. Effector T helper cell subsets in inflammatory bowel diseases. Front Immunol. 2018;9:1212. - PMC - PubMed

Publication types

LinkOut - more resources