

Features of the Physical and Social Neighborhood Environment and Neighborhood-Level Alzheimer's Disease and Related Dementia in South Carolina
- PMID: 38416540
- PMCID: PMC10901285
- DOI: 10.1289/EHP13183
Features of the Physical and Social Neighborhood Environment and Neighborhood-Level Alzheimer's Disease and Related Dementia in South Carolina
Abstract
Background: Studies are increasingly examining the relationship between the neighborhood environment and cognitive decline; yet, few have investigated associations between multiple neighborhood features and Alzheimer's disease and related dementias (ADRD).
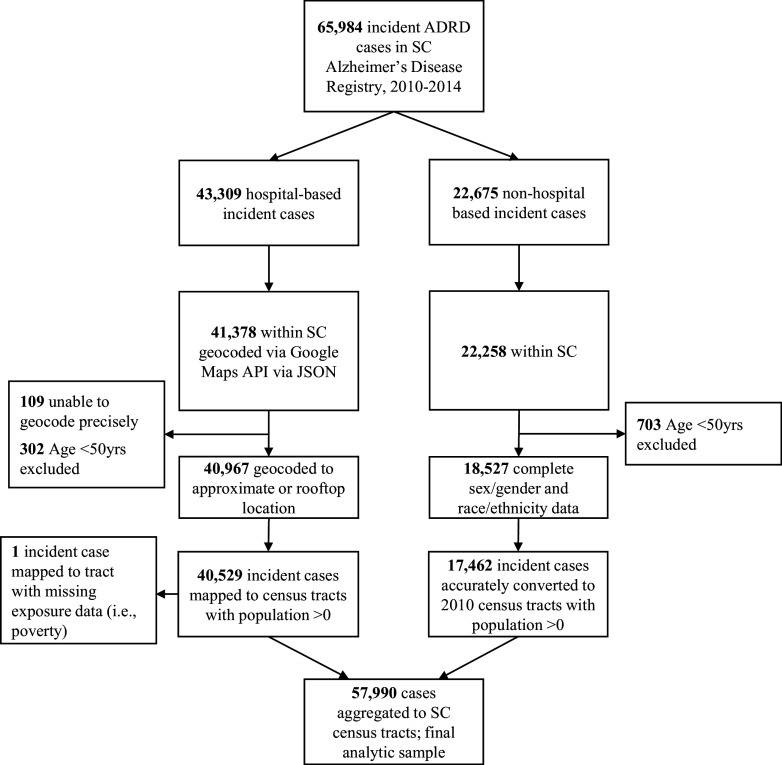
Objective: We investigated the relationship between neighborhood features and ADRD cumulative incidence from 2010 to 2014 in the South Carolina Alzheimer's Disease Registry (SCADR).
Methods: Diagnosed ADRD cases of age were ascertained from the SCADR by ZIP code and census tract. Neighborhood features from multiple secondary sources included poverty, air pollution [particulate matter with a diameter of 2.5 micrometers or less ()], and rurality at the census-tract level and access to healthy food, recreation facilities, and diabetes screening at the county level. In addition to using Poisson generalized linear regression to estimate ADRD incident rate ratios (IRR) with 95% confidence intervals (CIs), we applied integrated nested Laplace approximations and stochastic partial differential equations (INLA-SPDE) to address disparate spatial scales. We estimated associations between neighborhood features and ADRD cumulative incidence.
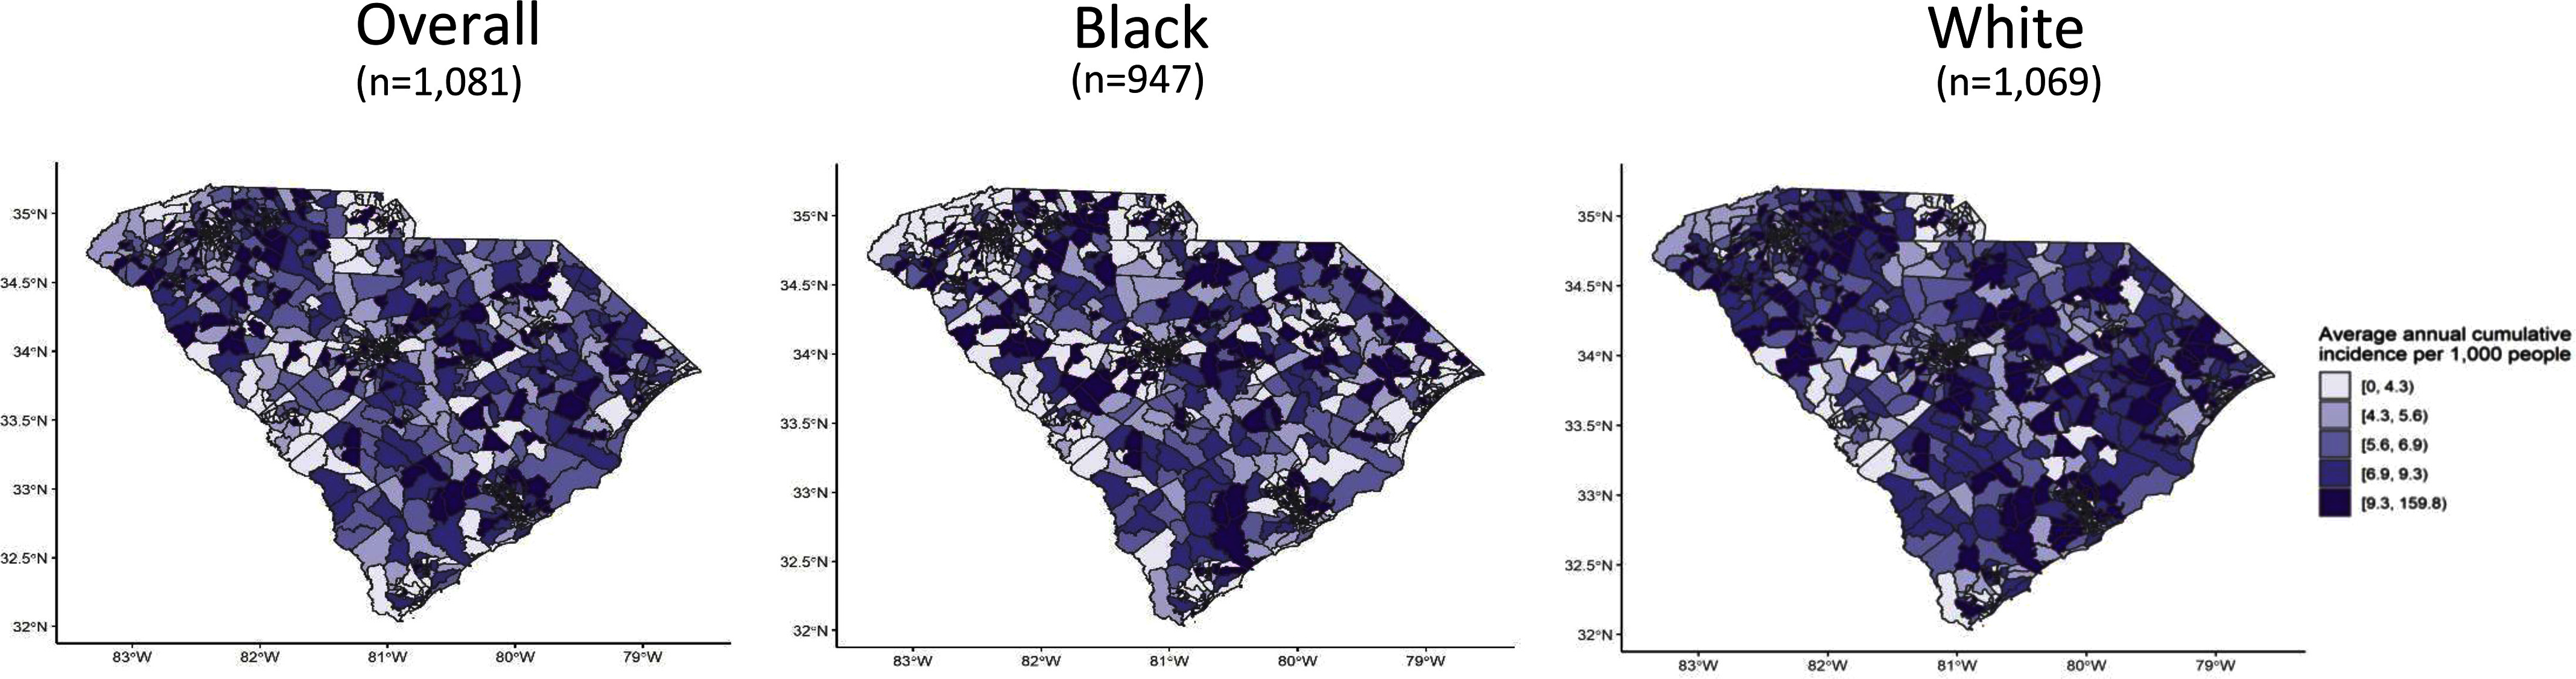
Results: The average annual ADRD cumulative incidence was 690 per 100,000 people per census tract (95% CI: 660, 710). The analysis was limited to 98% of census tracts with a population old (i.e., 1,081 of 1,103). The average percent of families living below the federal poverty line per census tract was 18.8%, and of census tracts were considered rural. The average percent of households with limited access to healthy food was 6.4%. In adjusted models, every ) increase of was associated with 65% higher ADRD cumulative incidence (; 95% CI: 1.30, 2.09), where at or below is considered healthy. Compared to large urban census tracts, rural and small urban tracts had 10% (; 95% CI: 1.00, 1.23) and 5% (; 95% CI: 0.96, 1.16) higher ADRD, respectively. For every percent increase of the county population with limited access to healthy food, ADRD was 2% higher (; 95% CI: 1.01, 1.04).
Conclusions: Neighborhood environment features, such as higher air pollution levels, were associated with higher neighborhood ADRD incidence. The INLA-SPDE method could have broad applicability to data collected across disparate spatial scales. https://doi.org/10.1289/EHP13183.
Figures
Similar articles
-
Rural-urban disparities of Alzheimer's disease and related dementias: A scoping review.Alzheimers Dement (N Y). 2025 Feb 11;11(1):e70047. doi: 10.1002/trc2.70047. eCollection 2025 Jan-Mar. Alzheimers Dement (N Y). 2025. PMID: 39935615 Free PMC article. Review.
-
Dementia in the incarcerated population: a retrospective study using the South Carolina Alzheimer's disease registry, USA.Int J Prison Health. 2023 Mar 16;19(1):109-124. doi: 10.1108/IJPH-08-2021-0071. Epub 2023 Feb 27. Int J Prison Health. 2023. PMID: 36821370 Free PMC article.
-
Mortality-Air Pollution Associations in Low Exposure Environments (MAPLE): Phase 2.Res Rep Health Eff Inst. 2022 Jul;2022(212):1-91. Res Rep Health Eff Inst. 2022. PMID: 36224709 Free PMC article.
-
Non-traditional socio-environmental and geospatial determinants of Alzheimer's disease-related dementia mortality.Sci Total Environ. 2025 Jul 1;984:179745. doi: 10.1016/j.scitotenv.2025.179745. Epub 2025 May 26. Sci Total Environ. 2025. PMID: 40424712
-
The Potential Contribution of Chronic Pain and Common Chronic Pain Conditions to Subsequent Cognitive Decline, New Onset Cognitive Impairment, and Incident Dementia: A Systematic Review and Conceptual Model for Future Research.J Alzheimers Dis. 2020;78(3):1177-1195. doi: 10.3233/JAD-200960. J Alzheimers Dis. 2020. PMID: 33252087 Free PMC article.
Cited by
-
Alzheimer's Disease Dementia Prevalence in the United States: A County-Level Spatial Machine Learning Analysis.Am J Alzheimers Dis Other Demen. 2025 Jan-Dec;40:15333175251335570. doi: 10.1177/15333175251335570. Epub 2025 Apr 21. Am J Alzheimers Dis Other Demen. 2025. PMID: 40257111 Free PMC article.
-
Rural-urban disparities of Alzheimer's disease and related dementias: A scoping review.Alzheimers Dement (N Y). 2025 Feb 11;11(1):e70047. doi: 10.1002/trc2.70047. eCollection 2025 Jan-Mar. Alzheimers Dement (N Y). 2025. PMID: 39935615 Free PMC article. Review.
-
Pathways to the Brain: Impact of Fine Particulate Matter Components on the Central Nervous System.Antioxidants (Basel). 2025 Jun 14;14(6):730. doi: 10.3390/antiox14060730. Antioxidants (Basel). 2025. PMID: 40563362 Free PMC article. Review.
References
-
- Alzheimer’s Association. 2018. 2018 Alzheimer’s disease facts and figures. Alzheimers Dement 14(3):367–429, 10.1016/j.jalz.2018.02.001. - DOI
-
- Kochanek KD, Murphy SL, Xu J, Tejada-Vera B. 2016. Deaths: final data for 2014. Atlanta, GA: Centers for Disease Control and Prevention. http://www.cdc.gov/nchs/products/nvsr.htm [accessed 8 March 2023]. - PubMed
-
- Office for the Study of Aging. 2019. 2019 Annual Report South Carolina Alzheimer’s Disease Registry. Columbia, SC: Office for the Study of Aging. https://sc.edu/study/colleges_schools/public_health/documents/alzheimers... [accessed 15 January 2020].
MeSH terms
Grants and funding
LinkOut - more resources
Full Text Sources
Medical
