. 2024 May 22;52(9):5067-5087.
doi: 10.1093/nar/gkae154.

CSB and SMARCAL1 compete for RPA32 at stalled forks and differentially control the fate of stalled forks in BRCA2-deficient cells

Affiliations

CSB and SMARCAL1 compete for RPA32 at stalled forks and differentially control the fate of stalled forks in BRCA2-deficient cells

Nicole L Batenburg et al. Nucleic Acids Res. .

Abstract

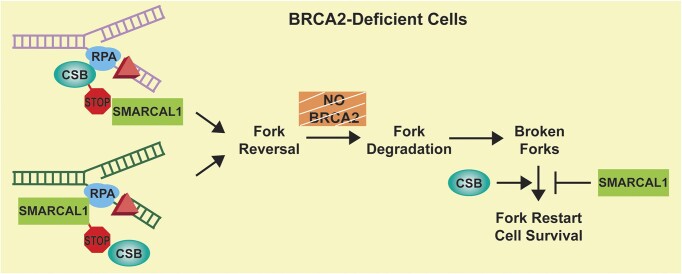
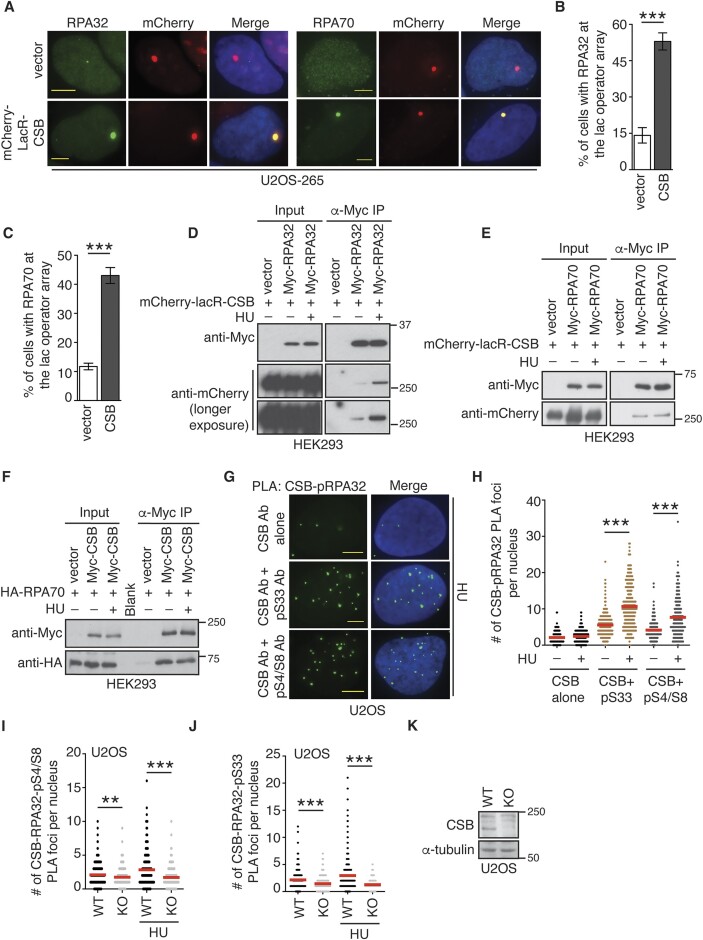
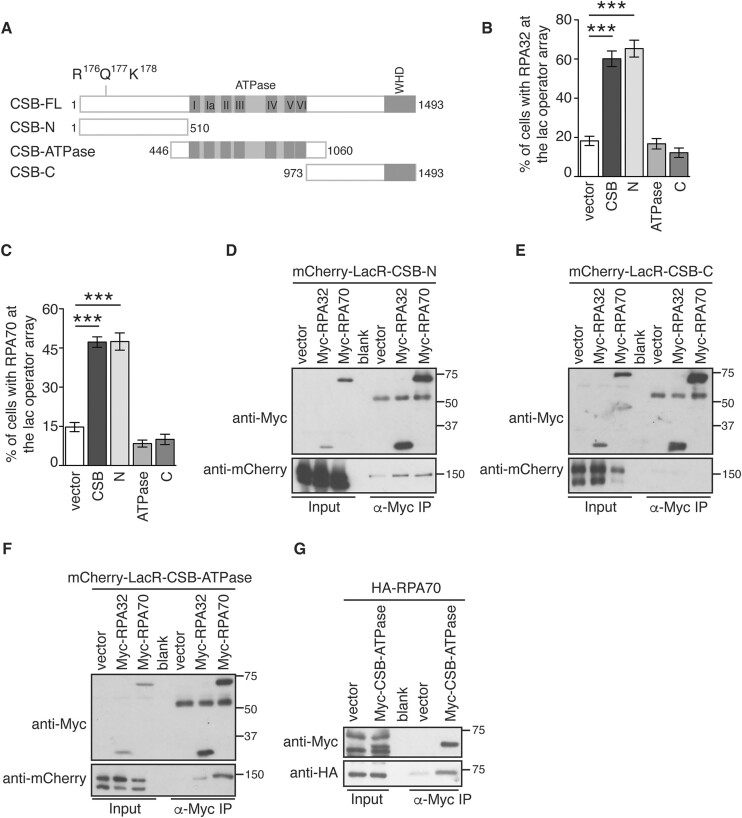
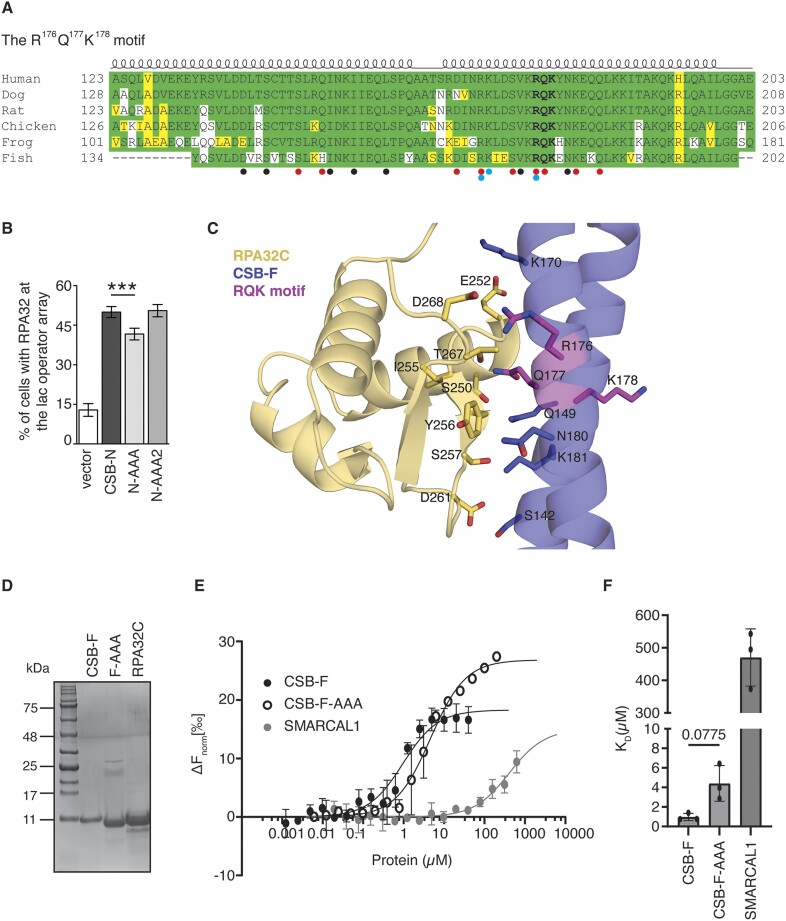
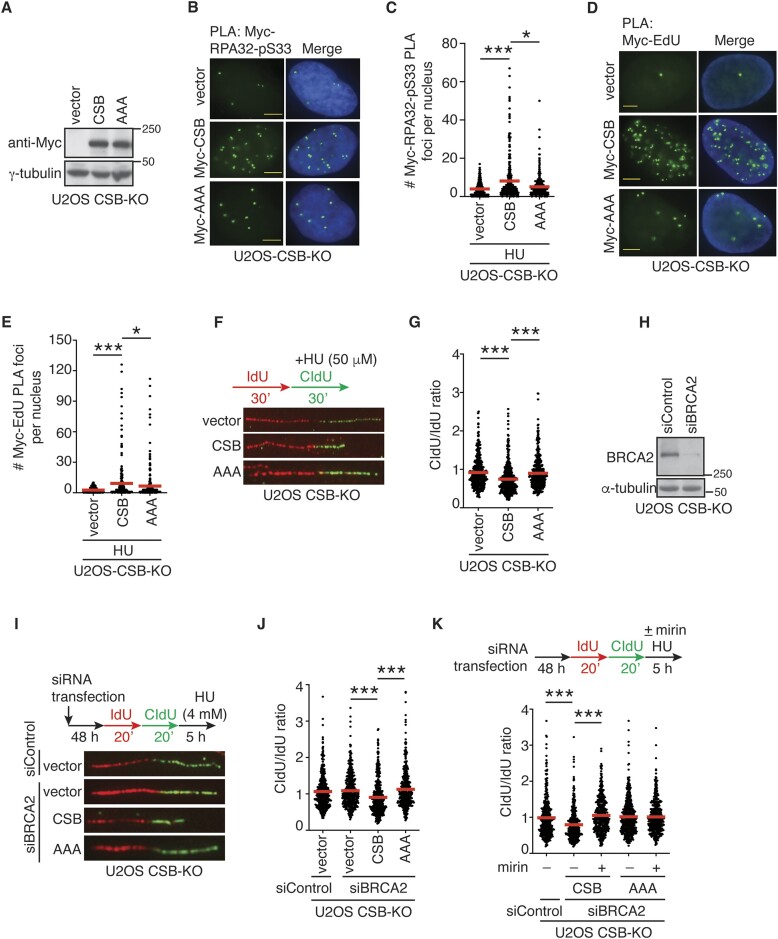
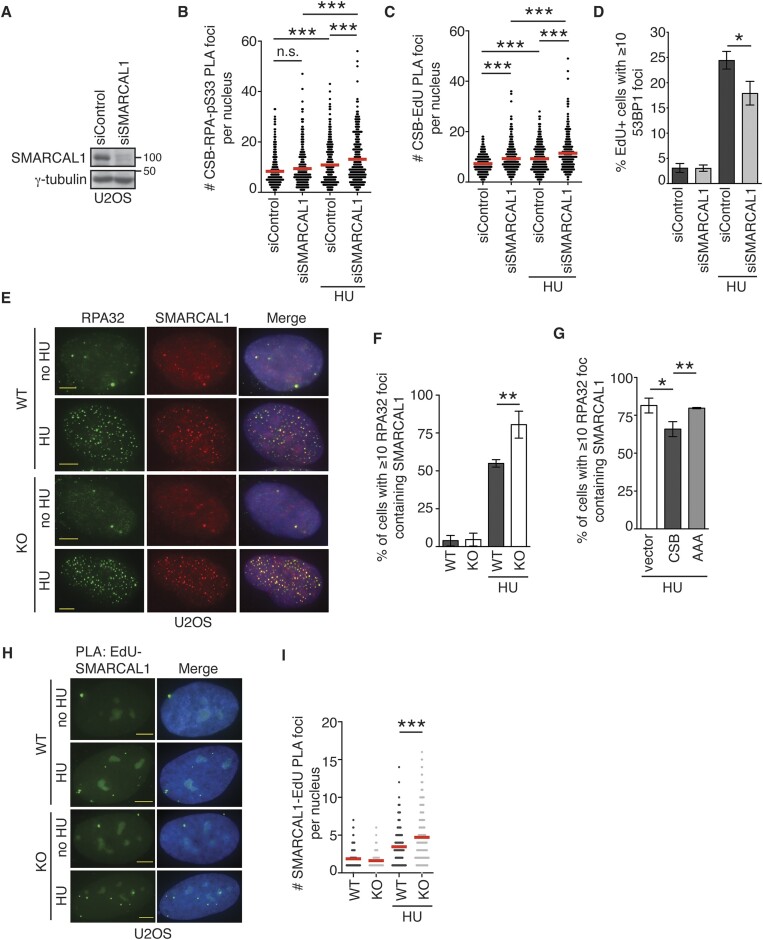
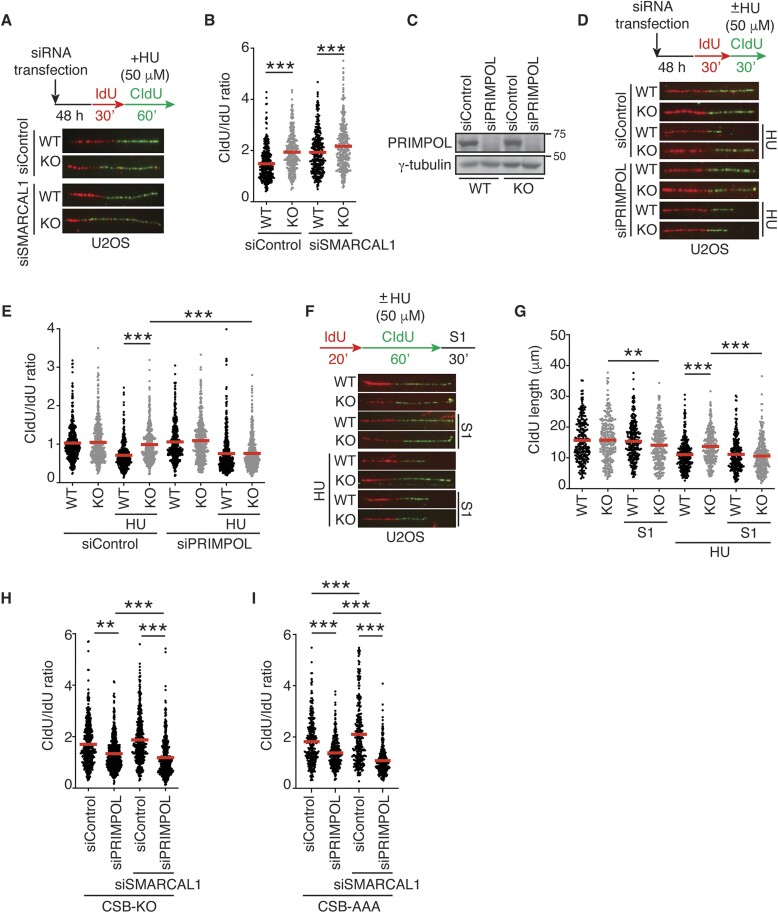
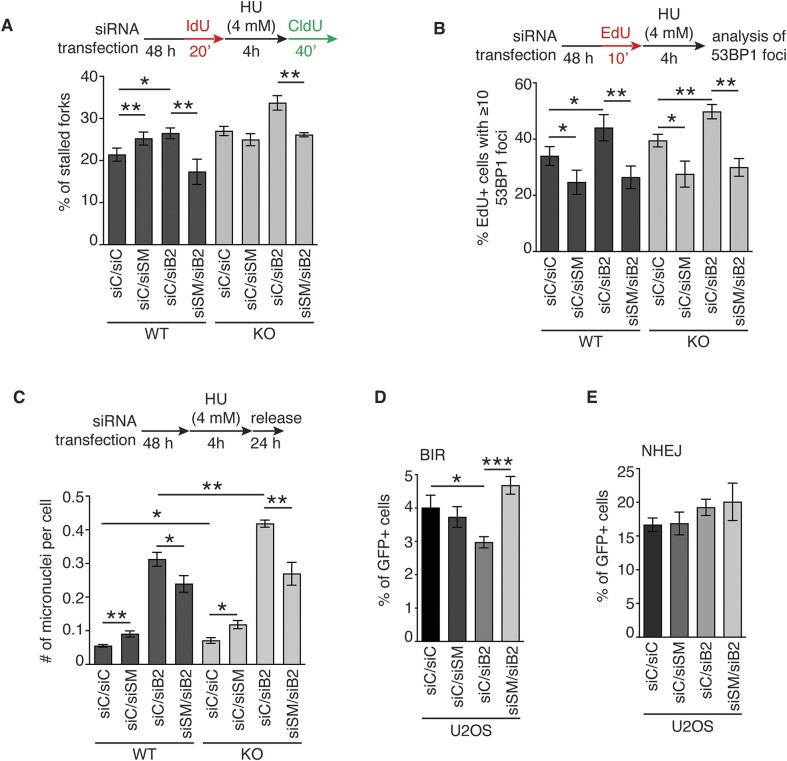
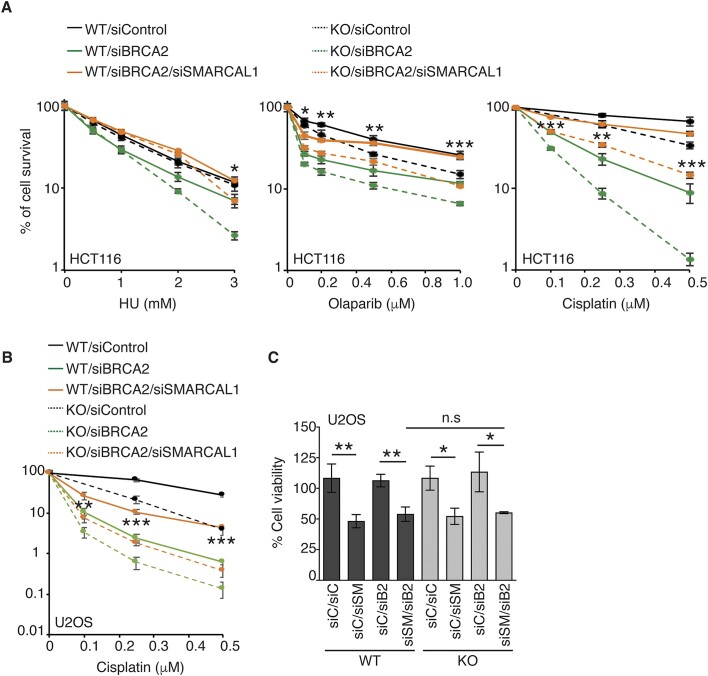
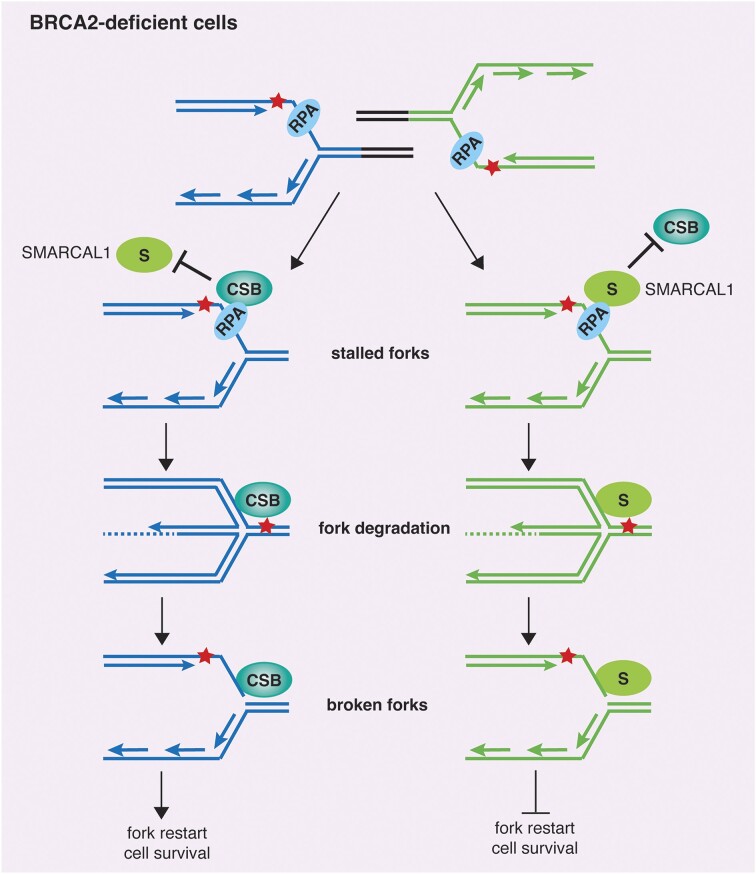
CSB (Cockayne syndrome group B) and SMARCAL1 (SWI/SNF-related, matrix-associated, actin-dependent, regulator of chromatin, subfamily A-like 1) are DNA translocases that belong to the SNF2 helicase family. They both are enriched at stalled replication forks. While SMARCAL1 is recruited by RPA32 to stalled forks, little is known about whether RPA32 also regulates CSB's association with stalled forks. Here, we report that CSB directly interacts with RPA, at least in part via a RPA32C-interacting motif within the N-terminal region of CSB. Modeling of the CSB-RPA32C interaction suggests that CSB binds the RPA32C surface previously shown to be important for binding of UNG2 and SMARCAL1. We show that this interaction is necessary for promoting fork slowing and fork degradation in BRCA2-deficient cells but dispensable for mediating restart of stalled forks. CSB competes with SMARCAL1 for RPA32 at stalled forks and acts non-redundantly with SMARCAL1 to restrain fork progression in response to mild replication stress. In contrast to CSB stimulated restart of stalled forks, SMARCAL1 inhibits restart of stalled forks in BRCA2-deficient cells, likely by suppressing BIR-mediated repair of collapsed forks. Loss of CSB leads to re-sensitization of SMARCAL1-depleted BRCA2-deficient cells to chemodrugs, underscoring a role of CSB in targeted cancer therapy.


Figures

Graphical Abstract
Graphical Abstract
Figure 1.
Figure 1.
CSB interacts with RPA at stalled replication forks. (A) Representative images of U2OS-265 CSB-KO cells expressing the vector alone or mCherry-LacR-CSB. Immunostaining was done with an either anti-RPA32 or anti-RPA70 antibody (green). Cell nuclei were stained with DAPI in blue in this and subsequent figures. Scale bars in this and subsequent panels: 5 μm. (B) Quantification of the percentage of cells exhibiting RPA32 accumulated at the lac operator array from (A). At least 100 cells expressing mCherry-LacR-CSB were scored per condition in a blind manner. Standard deviations (SDs) from three independent experiments are indicated in this and 1C. ***P< 0.001. (C) Quantification of the percentage of cells exhibiting RPA70 accumulated at the lac operator array from (A). Scoring was done as described in (B). ***P< 0.001. (D) Coimmunoprecipitation with anti-Myc antibody in HEK293 cells transfected with mCherry-LacR-CSB in conjunction with the vector alone or Myc-RPA32 in the presence or absence of HU. For HU treatment, cells were collected 4 h post treatment with 4 mM HU. Immunoblotting was performed with anti-Myc and anti-mCherry antibodies. (E) Coimmunoprecipitation with anti-Myc antibody in HEK293 cells transfected with mCherry-LacR-CSB in conjunction with the vector alone or Myc-RPA70 in the presence or the absence of HU. Immunoblotting was performed with anti-Myc and anti-mCherry antibodies. (F) Coimmunoprecipitation with anti-Myc antibody in HEK293 cells transfected with HA-RPA70 in conjunction with the vector alone or Myc-CSB in the presence or absence of HU. Immunoblotting was performed with anti-Myc and anti-HA antibodies. (G) Representative images of PLA between CSB and either RPA32-pS33 or RPA32-pS4/S8 in U2OS cells treated with or without HU. For HU treatment, cells were fixed 4 h post treatment with 4 mM HU. (H) Quantification of PLA between CSB and either RPA32-pS33 or RPA32-pS4/S8 from (G). The respective number of cells analyzed for CSB alone (–HU), CSB alone (+HU), CSB + RPA32-pS33 (–HU), CSB + RPA32-pS33 (+HU), CSB + RPA-pS4/S8 (–HU) and CSB + RPA-pS4/S8 (+HU) were 160, 269, 291, 269, 169 and 169. Data from single experiments are represented as scatter plot graphs with the mean indicated in this, (I) and (J) panels. The P-value was determined using a non-parametric Mann-Whitney rank-sum t-test in this, (I) and (J) panels. ***P< 0.001. (I) Quantification of PLA between CSB and RPA32-pS4/S8 in both U2OS WT and CSB-knockout (KO) cells treated with or without HU. The respective number of cells analyzed for U2OS WT (–HU), U2OS WT (+HU), U2OS CSB-KO (–HU), and U2OS CSB-KO (+HU) were 297, 300, 245, 277. (J) Quantification of PLA between CSB and RPA32-pS33 in both U2OS WT and CSB-KO cells treated with or without HU. The respective number of cells analyzed for U2OS WT (–HU), U2OS WT (+HU), U2OS CSB-KO (–HU) and U2OS CSB-KO (+HU) were 263, 281, 272, 271. (K) Western analysis of U2OS WT and CSB-KO cells. Immunoblotting was performed with anti-CSB and anti-α-tubulin antibodies. The α-tubulin blot was used as a loading control.
Figure 2.
Figure 2.
The N-terminal region of CSB interacts with RPA. (A) Schematic diagram of CSB. (B) Quantification of the percentage of cells exhibiting RPA32 accumulated at the lac operator array. U2OS-265 CSB-KO cells were transfected with various CSB alleles as indicated. At least 100 cells expressing various mCherry-LacR-CSB alleles were scored per condition in a blind manner. Standard deviations (SDs) from three independent experiments are indicated in this and (C). ***P< 0.001. (C) Quantification of the percentage of cells exhibiting RPA70 accumulated at the lac operator array. U2OS-265 CSB-KO cells were transfected with various CSB alleles as indicated. Scoring was done as described in (B). ***P< 0.001. (D) Coimmunoprecipitation with anti-Myc antibody in HEK293 cells transfected with mCherry-LacR-CSB-N in conjunction with the vector alone, Myc-RPA32, or Myc-RPA70. Immunoblotting was performed with anti-Myc and anti-mCherry antibodies. (E) Coimmunoprecipitation with anti-Myc antibody in HEK293 cells transfected with mCherry-LacR-CSB-C in conjunction with the vector alone, Myc-RPA32, or Myc-RPA70. Immunoblotting was performed with anti-Myc and anti-mCherry antibodies. (F) Coimmunoprecipitation with anti-Myc antibody in HEK293 cells transfected with mCherry-LacR-CSB-ATPase in conjunction with the vector alone, Myc-RPA32 or Myc-RPA70. Immunoblotting was performed with anti-Myc and anti-mCherry antibodies. (G) Coimmunoprecipitation with anti-Myc antibody in HEK293 cells transfected with HA-RPA70 in conjunction with the vector alone or Myc-CSB carrying the ATPase domain alone (Myc-CSB-ATPase). Immunoblotting was performed with anti-Myc and anti-HA antibodies.
Figure 3.
Figure 3.
CSB contains a highly conserved N-terminal RPA32-interacting motif. (A) Sequence alignment of the RPA32C-binding region of CSB with selective vertebrate orthologs. The R176Q177K178 motif is indicated in bold. Compared to human CSB, identical amino acids, similar amino acids (charged RHKDE, polar uncharged STNQY, hydrophobic AVILMFWCPG), and non-similar amino acids are highlighted in green, yellow, and white, respectively. Cartoon of the secondary structure is depicted above the sequences. Residues shown to interact between RPA32 and CSB in the optimized AlphaFold2 model are depicted with black circles, with red and blue circles additionally denoting hydrogen bonds and salt bridges, respectively. Accession numbers are: human ERCC-6, NP_001333369; dog ERCC-6 XP_534944.2; rat ERCC-6 NP_001100766.1; chicken ERCC-6, XP_421656.3; frog ERCC-6 NP_001361595.1; fish ERCC-6, XP_005815483.2. (B) Quantification of the percentage of cells exhibiting RPA32 accumulated at the lac operator array. At least 100 cells expressing various mCherry-LacR-CSB-N alleles as indicated were scored per condition in a blind manner. SDs from three independent experiments are indicated. ***P< 0.001. (C) Optimized AlphaFold model of RPA32C (yellow) in complex with CSB-F (blue). The R176Q177K178 motif is highlighted in magenta, with some interacting residues shown as sticks, where red represents oxygen and blue nitrogen. (D) Coomassie staining of purified recombinant CSB containing amino acids from 123 to 203 (CSB-F), CSB-F carrying R176Q177K178-AAA mutations, and RPA32C from bacterial cells. (E) MST binding curves of CSB-F, CSB-F-AAA, and SMARCAL1 binding to RPA32C. Data are plotted as the change in normalized fluorescence (ΔFnorm) of RPA32C against concentration of the ligands, CSB-F, CSB-F-AAA and SMARCAL1, required for calculating the dissociation constant, KD. Three independent measurements were completed for each experiment, with data plotted as the mean ± standard deviation. (F) KD values for CSB-F, CSB-F-AAA and SMARCAL1 bound to RPA32C. Data are plotted as the mean ± standard deviation with three independent measurements. P-value was calculated using a two-tailed Welch's t-test using Prism V 9.5.1 (GraphPad).
Figure 4.
Figure 4.
CSB relies on the R176Q177K178 motif to promote fork slowing and fork degradation in BRCA2-deficient cells. (A) Western analysis of U2OS CSB-KO cells expressing the vector alone, Myc-CSB, or Myc-CSB carrying R176Q177K178-AAA mutations (AAA). Immunoblotting was done with anti-Myc and anti-γ-tubulin antibodies. The γ-tubulin blot was used as a loading control in this and subsequent figures. (B) Representative images of PLA foci formation between Myc staining and RPA32-pS33 in U2OS CSB-KO expressing the vector alone, Myc-CSB or Myc-CSB carrying R176Q177K178-AAA mutations (AAA). (C) Quantification of PLA between anti-Myc and RPA-pS33 in HU-treated U2OS CSB-KO cells expressing the vector alone, Myc-CSB, or Myc-CSB carrying R176Q177K178-AAA mutations (AAA). A total of 321–329 cells were scored per condition in a blind manner. Data from single experiments are represented as scatter plot graphs with the mean indicated in this, (E), (G), (J) and (K) panels. The P-value was determined using a non-parametric Mann–Whitney rank-sum t-test in this, (E), (G), (J) and (K) panels. *P< 0.05; ***P< 0.001. (D) Representative images of PLA foci formation between Myc staining and EdU in U2OS CSB-KO expressing the vector alone, Myc-CSB or Myc-CSB carrying R176Q177K178-AAA mutations (AAA). (E) Quantification of PLA between anti-Myc and EdU in HU-treated U2OS CSB-KO cells expressing the vector alone, Myc-CSB, or Myc-CSB carrying R176Q177K178-AAA mutations (AAA). A total of 252–276 cells were scored per condition in a blind manner. *P< 0.05; ***P< 0.001. (F) Representative images of DNA fibers from U2OS CSB-KO expressing the vector alone, Myc-CSB or Myc-CSB carrying R176Q177K178-AAA mutations (AAA) that were first labeled with IdU (red) and then labeled with CldU (green) in the presence of 50 μM HU. (G) Quantification of the CldU/IdU ratio from U2OS CSB-KO cells expressing the vector alone, Myc-CSB, or Myc-CSB carrying R176Q177K178-AAA mutations (AAA). A total of 417–447 fibers per condition were analyzed. ***P< 0.001. (E) Quantification of the percentage of stalled forks from U2OS CSB-KO cells expressing the vector alone, Myc-CSB or Myc-CSB carrying R176Q177K178-AAA mutations (AAA). A total of 315–363 fibres per condition were scored in a blind manner. SDs from three independent experiments are shown. ***P< 0.001. (H) Western analysis of U2OS CSB-KO cells transfected with siControl or siBRCA2. Immunoblotting was performed with anti-BRCA2 and γ-tubulin antibodies. (I) Representative images of DNA fibers from U2OS CSB-KO expressing the vector alone, Myc-CSB or Myc-CSB-AAA. Following transfection with indicated siRNA, cells were incubated first with IdU (red) and then with CldU (green), followed by treatment with 4 mM HU for 5 h. (J) Quantification of the CldU/IdU ratio from siBRCA2-transfected U2OS CSB-KO cells expressing the vector alone, Myc-CSB or Myc-CSB carrying R176Q177K178-AAA mutations (AAA). A total of 426–461 fibers per condition were analyzed. ***P< 0.001. (K) Quantification of the CldU/IdU ratio from siBRCA2-transfected U2OS CSB-KO cells expressing Myc-CSB or Myc-CSB carrying R176Q177K178-AAA mutations (AAA). Following the CldU labeling, cells were treated with HU in the presence or absence of 50 μM mirin for 5 h. A total of 424–461 fibers per condition were analyzed. ***P< 0.001.
Figure 5.
Figure 5.
CSB competes with SMARCAL1 for RPA at stalled forks. (A) Western analysis of U2OS cells transfected with siControl or siSMARCAL1. Immunoblotting was done with anti-SMARCAL1 and anti-γ-tubulin antibodies. (B) Quantification of PLA between CSB and RPA-pS33 in siControl- or siSMARCAL1-transfected U2OS cells in the presence or the absence of HU. The respective number of cells analyzed for siControl (–HU), siSMARCAL1 (–HU), siControl (+HU), and siSMARCAL1 (+HU) were 313, 318, 355 and 308. Data from single experiments are represented as scatter plot graphs with the mean indicated in this and 5C panels. The P-value was determined using a non-parametric Mann–Whitney rank-sum t-test in this and 5C panels. ***P< 0.001. (C) Quantification of PLA between CSB and EdU in siControl- or siSMARCAL1-transfected U2OS cells in the presence or the absence of HU. For HU treatment, cells were fixed 4 h post treatment with 4 mM HU. The respective number of cells analyzed for siControl (–HU), siSMARCAL1 (–HU), siControl (+HU), and siSMARCAL1 (+HU) were 299, 336, 350 and 303. ***P< 0.001. (D) Quantification of the percentage of EdU+ cells exhibiting ≥ 10 53BP1 foci. U2OS cells transfected with indicated siRNAs were pulse-labeled with EdU for 10 min and then treated with or without 4 mM HU for 4 h. A total of 503–539 cells per condition were scored in a blind manner. Standard deviations from three independent experiments were shown. *P< 0.05. (E) Representative images of U2OS CSB-WT and CSB-KO cells that were treated with or without HU. Immunostaining was done with an anti-RPA32 antibody (green) in conjunction with an anti-SMARCAL1 (red) antibody. (F) Quantification of the percentage of U2OS CSB-WT and CSB-KO cells exhibiting ≥ 10 colocalization foci of RPA32 and SMARCAL1 from (E). A total of 500–558 cells were scored per condition in a blind manner. SDs from three independent experiments are indicated in this and (G) panels. **P< 0.01. (G) Quantification of the percentage of vector-, Myc-CSB-, or Myc-CSB-R176Q177K178-AAA (AAA)-expressing U2OS CSB-KO cells exhibiting ≥10 colocalization foci of RPA32 and SMARCAL1. A total of 501–528 cells were scored per condition in a blind manner. *P< 0.05; **P< 0.01. (H) Representative images of PLA foci formation between SMARCAL1 and EdU in U2OS CSB-WT and CSB-KO cells that were treated with or without HU. (I) Quantification of PLA between SMARCAL1 and EdU in U2OS WT and CSB-KO cells treated with or without HU. The respective number of cells analyzed for WT (–HU), KO (–HU), WT (+HU), and KO (+HU) were 297, 287, 296 and 308. Data from single experiments are represented as scatter plot graphs with the mean indicated. The P-value was determined using a non-parametric Mann–Whitney rank-sum t-test. ***P< 0.001.
Figure 6.
Figure 6.
CSB and SMARCAL1 function non-redundantly at stalled forks to restrain fork progression. (A) Representative images of DNA fibers from U2OS WT and CSB knockout (KO) cells transfected with indicated siRNAs. Cells were first labeled with IdU (red) and then labeled with CldU (green) in the presence of 50 μM HU. (B) Quantification of the CldU/IdU ratio from U2OS CSB-WT and CSB-KO cells transfected with siControl or siSMARCAL1. A total of 306–313 fibers per condition were analyzed. Data from single experiments are represented as scatter plot graphs with the mean indicated in this and subsequent panels. The P-value was determined using a non-parametric Mann–Whitney rank-sum t-test in this, (E), (G–I) panels. ***P< 0.001. (C) Western analysis of U2OS CSB-WT and CSB-KO cells transfected with siControl or siPRIMPOL. Immunoblotting was performed with anti-PRIMPOL and anti-γ-tubulin antibodies. ***P< 0.001. (D) Representative images of DNA fibers from U2OS WT and CSB knockout (KO) cells transfected with indicated siRNAs. Cells were first labeled with IdU (red) and then labeled with CldU (green) in the presence of 50 μM HU. (E) Quantification of the CldU/IdU ratio from U2OS CSB-WT and CSB-KO cells transfected with siControl or siPRIMPOL. A total of 403–478 fibers per condition were analyzed. ***P< 0.001. (F) Representative images of DNA fibers from U2OS WT and CSB knockout (KO) cells. Following the second labeling with CldU (green) in the presence or absence of 50 μM HU, cells were treated with S1 nuclease for 30 min. (G) Quantification of the CldU fiber length from U2OS CSB-WT and CSB-KO cells following treatment with S1 nuclease. A total of 255–345 fibers per condition were analyzed. **P< 0.01; ***P< 0.001. (H) Quantification of the CldU/IdU ratio from U2OS CSB-KO cells transfected with siControl, siPRIMPOL, siSMARCAL1, or a combination of siPRIMPOL and siSMARCAL1. A total of 455–494 fibers per condition were analyzed. **P< 0.01; ***P< 0.001. (I) Quantification of the CldU/IdU ratio. U2OS CSB-KO cells expressing Myc-CSB-R176Q177K178-AAA (AAA) were transfected with siControl, siPRIMPOL, siSMARCAL1, or a combination of siPRIMPOL and siSMARCAL1. A total of 300–303 fibers per condition were analyzed. ***P< 0.001.
Figure 7.
Figure 7.
CSB and SMARCAL1 differentially regulate the restart of stalled forks in BRCA2-deficient cells. (A) Quantification of the percentage of stalled forks from U2OS CSB-WT and CSB-KO cells transfected with indicated siRNAs. A total of 340–471 fibres per condition were scored in a blind manner. SDs from three independent experiments are shown. *P< 0.05; **P< 0.01. (B) Quantification of the percentage of cells exhibiting ≥10 53BP1 foci. U2OS WT and CSB-KO cells transfected with indicated siRNAs were pulse-labeled with EdU for 10 min prior to treatment with 4 mM HU for 4 h. A total of 504–531 cells per condition were scored in a blind manner. SDs from three independent experiments were shown. *P< 0.05; **P< 0.01. (C) Quantification of the average number of micronuclei per cell. U2OS WT and CSB-KO cells transfected with indicated siRNAs were treated with 4 mM HU and then released for 24 h. A total of 1005–1043 cells per condition were scored in a blind manner. SDs from three independent experiments were shown. *P< 0.05; **P< 0.01. (D) Quantification of the percentage of cells with the restoration of GFP expression following BIR-mediated repair of I-SceI-induced DSBs. SDs from three independent experiments are shown. *P< 0.05; ***P< 0.001. (E) Quantification of the percentage of cells with the restoration of GFP expression following NHEJ-mediated repair of I-SceI-induced DSBs. SDs from three independent experiments are shown.
Figure 8.
Figure 8.
CSB and SMARCAL1 differentially regulate the chemoresponse in BRCA2-deficient cells. (A) Clonogenic survival assays of HCT116 cells as indicated to HU, olaparib, and cisplatin as indicated. SDs from three independent experiments are indicated. P values for comparison between CSB-WT/siBRCA2/siSMARCAL1 and CSB-KO/siBRCA2/siSMARCAL1 are indicated. *P< 0.05; **P< 0.01; ***P< 0.001. (B) Cisplatin clonogenic survival assays of U2OS WT and CSB-KO cells transfected with indicated siRNAs. SDs from three independent experiments are indicated. P values for comparsion between CSB-WT/siBRCA2/siSMARCAL1 and CSB-KO/siBRCA2/siSMARCAL1 are indicated. **P< 0.01; ***P< 0.001. (C) Cell viability assays of U2OS WT and CSB-KO cells transfected with indicated siRNAs. SDs from three independent experiments are indicated. *P< 0.05; **P< 0.01; n.s., not significant.
Figure 9.
Figure 9.
Model for differential control of the fate of stalled forks by CSB and SMARCAL1 under the pathological condition lacking BRCA2. CSB and SMARCAL1 compete for RPA, which interacts and directs them to different types of stalled forks as depicted by diagrams of stalled forks in different colors. See the text for additional details.

Similar articles

Cited by

References

    1. Hanahan D., Weinberg R.A. Hallmarks of cancer: the next generation. Cell. 2011; 144:646–674. - PubMed
    1. Halazonetis T.D., Gorgoulis V.G., Bartek J. An oncogene-induced DNA damage model for cancer development. Science. 2008; 319:1352–1355. - PubMed
    1. Macheret M., Halazonetis T. DNA replication stress as a hallmark of cancer. Annu. Rev. Pathol. 2015; 10:425–448. - PubMed
    1. Gaillard H., García-Muse T., Aguilera A. Replication stress and cancer. Nat. Rev. Cancer. 2015; 15:276–289. - PubMed
    1. Saxena S., Zou L. Hallmarks of DNA replication stress. Mol. Cell. 2022; 82:2298–2314. - PMC - PubMed