. 2024 Mar 26;43(3):113867.
doi: 10.1016/j.celrep.2024.113867. Epub 2024 Feb 27.

Loss of GTF2I promotes neuronal apoptosis and synaptic reduction in human cellular models of neurodevelopment

Affiliations

Loss of GTF2I promotes neuronal apoptosis and synaptic reduction in human cellular models of neurodevelopment

Jason W Adams et al. Cell Rep. .

Abstract

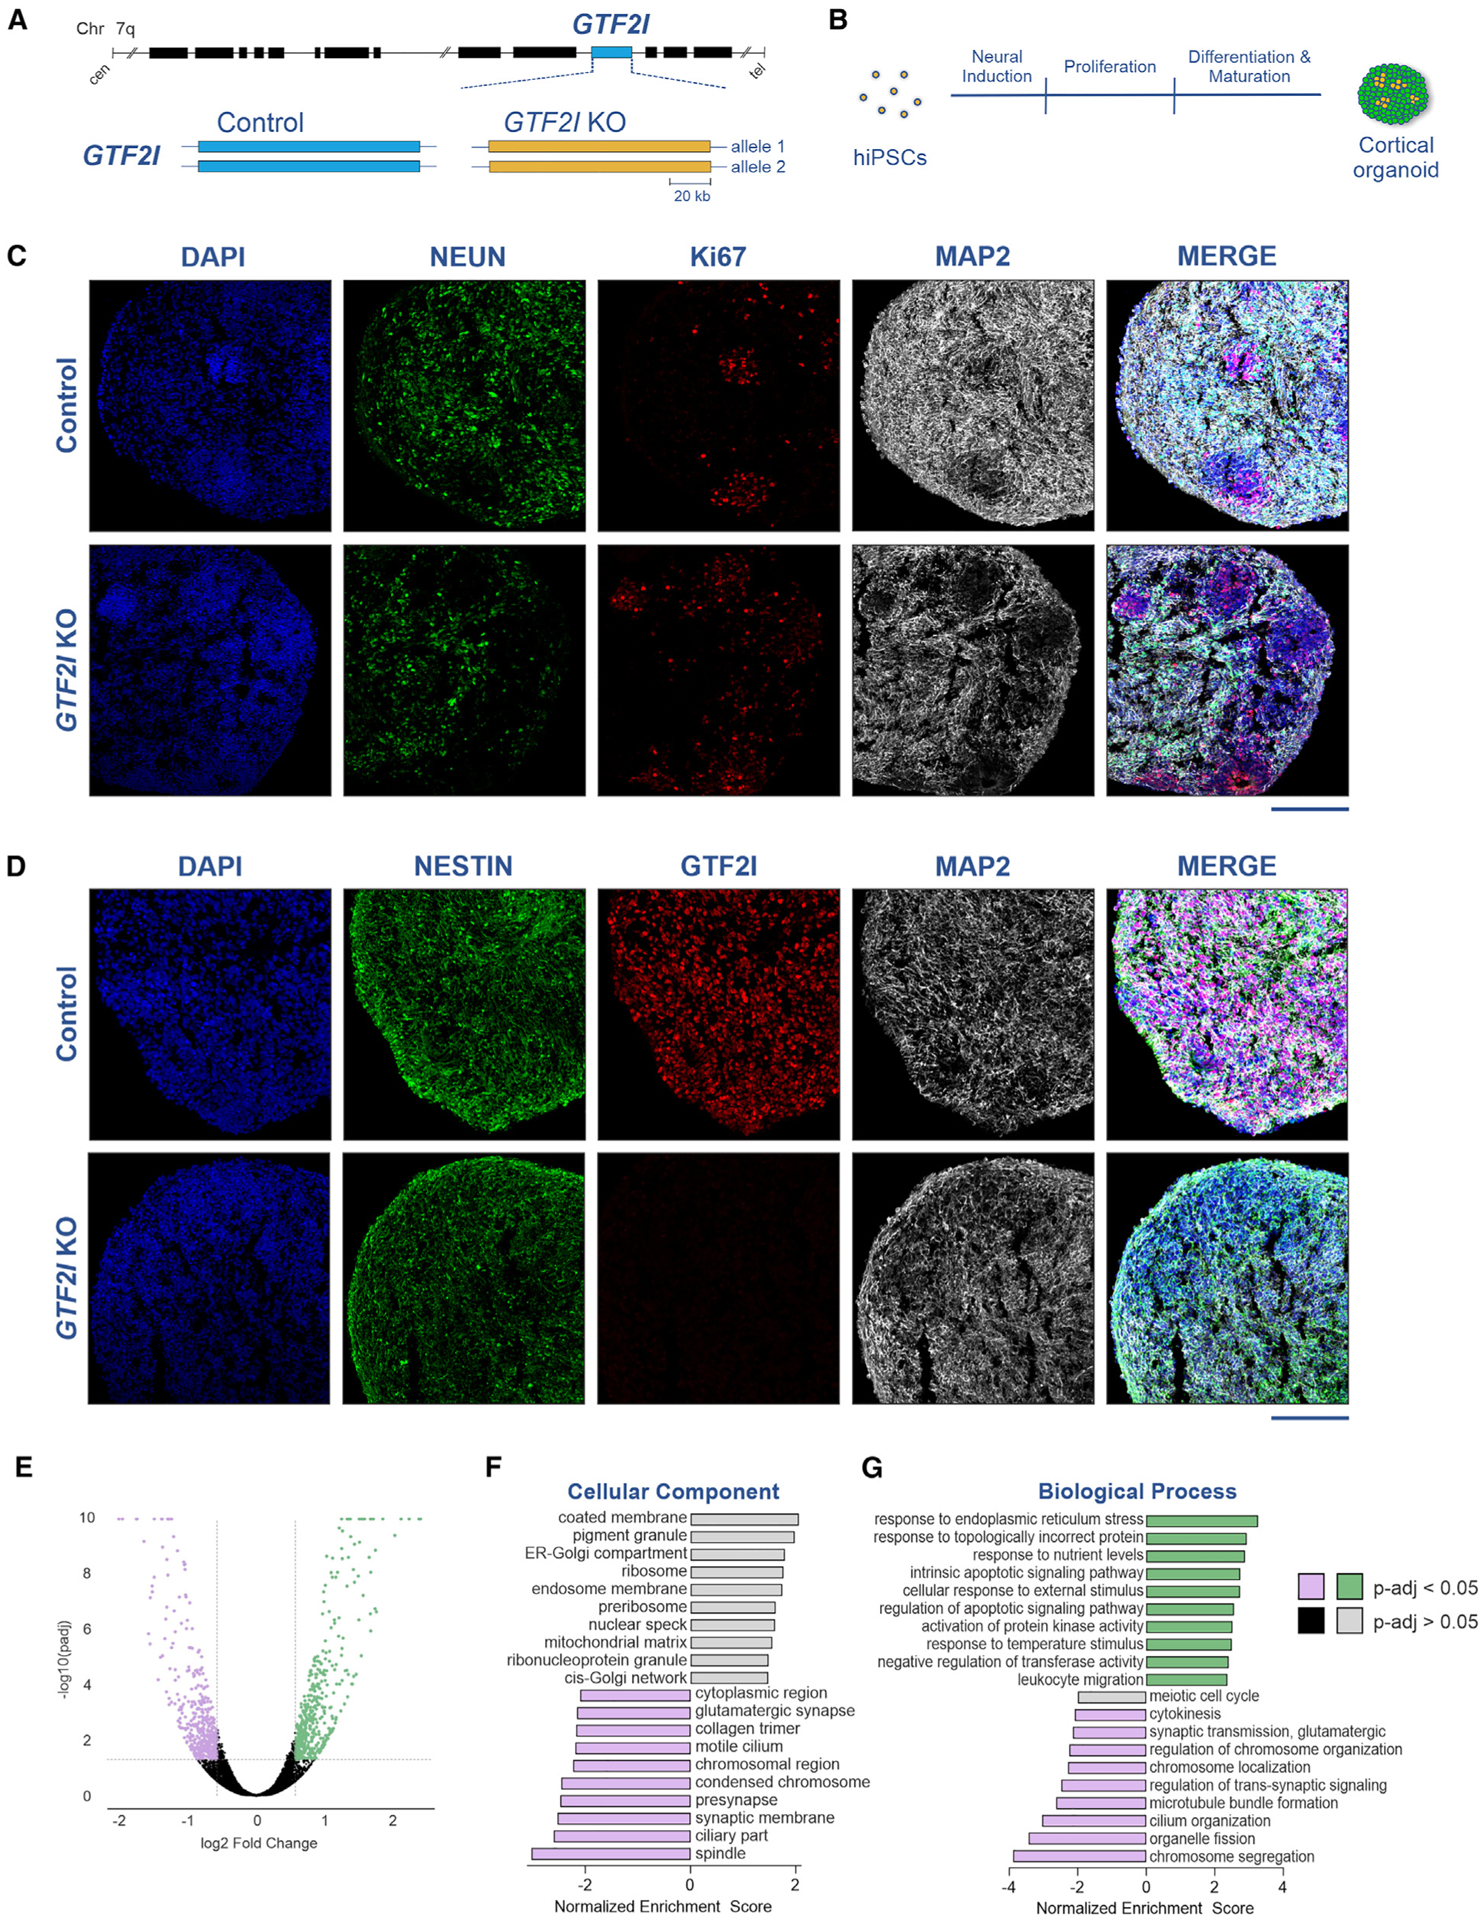
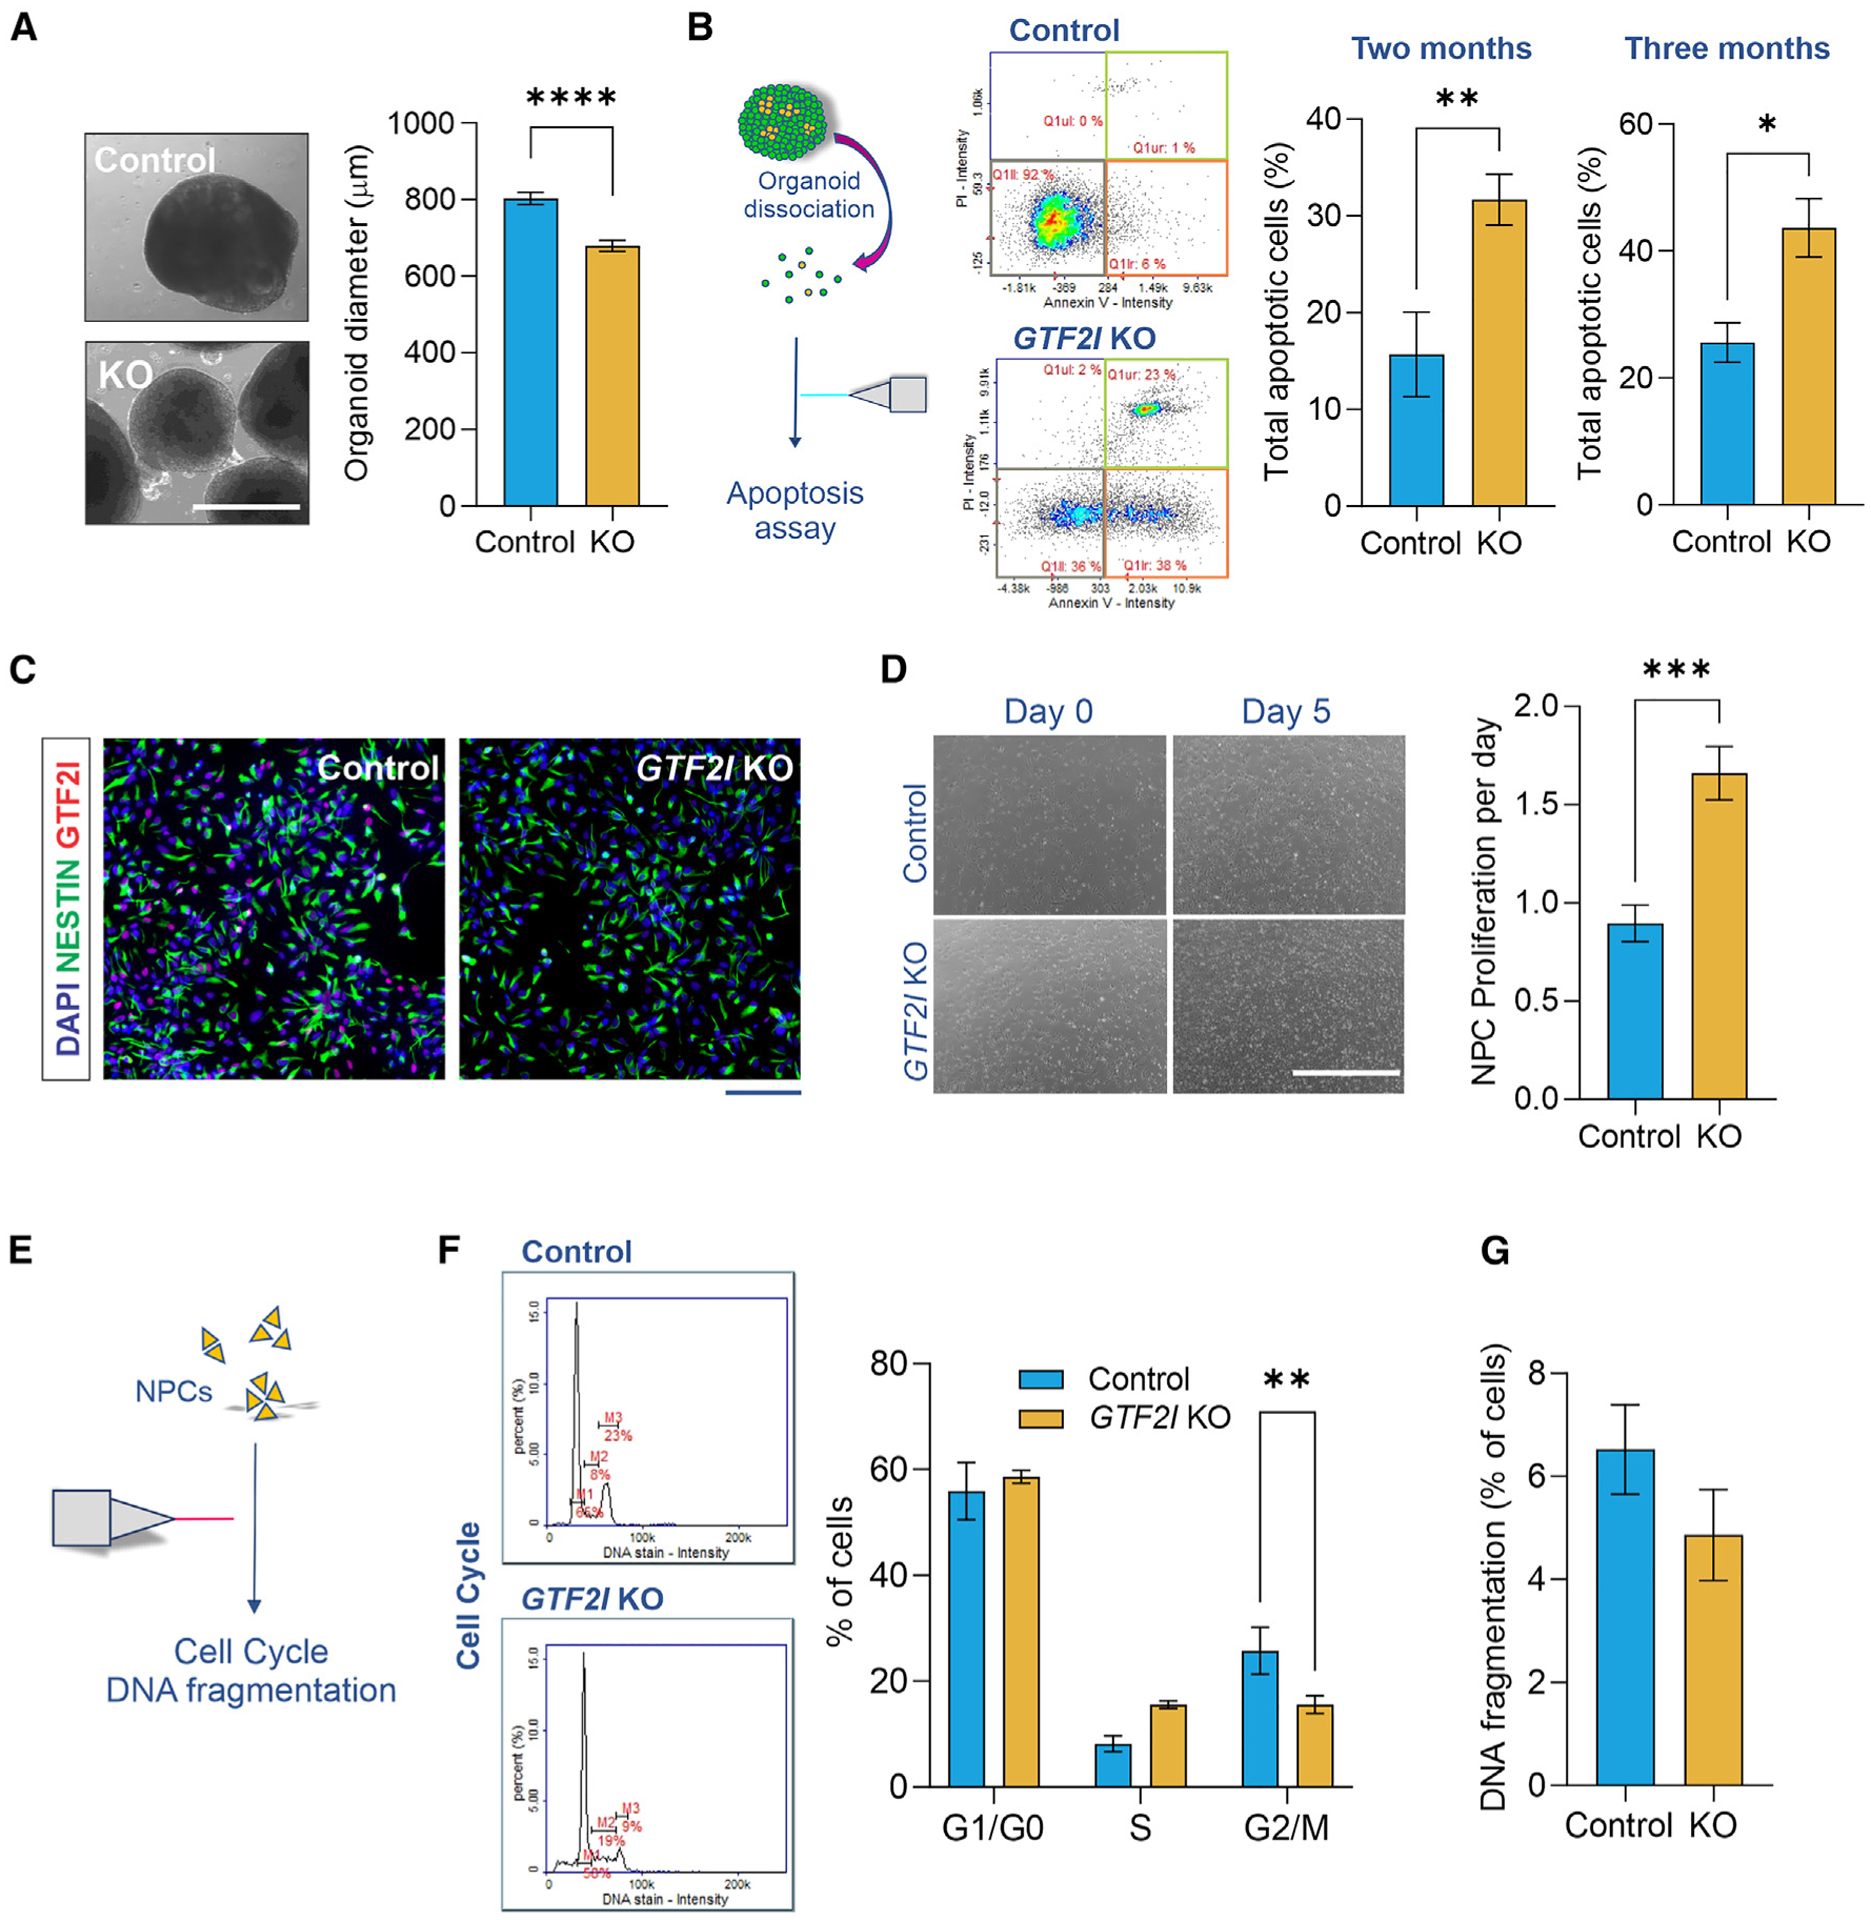
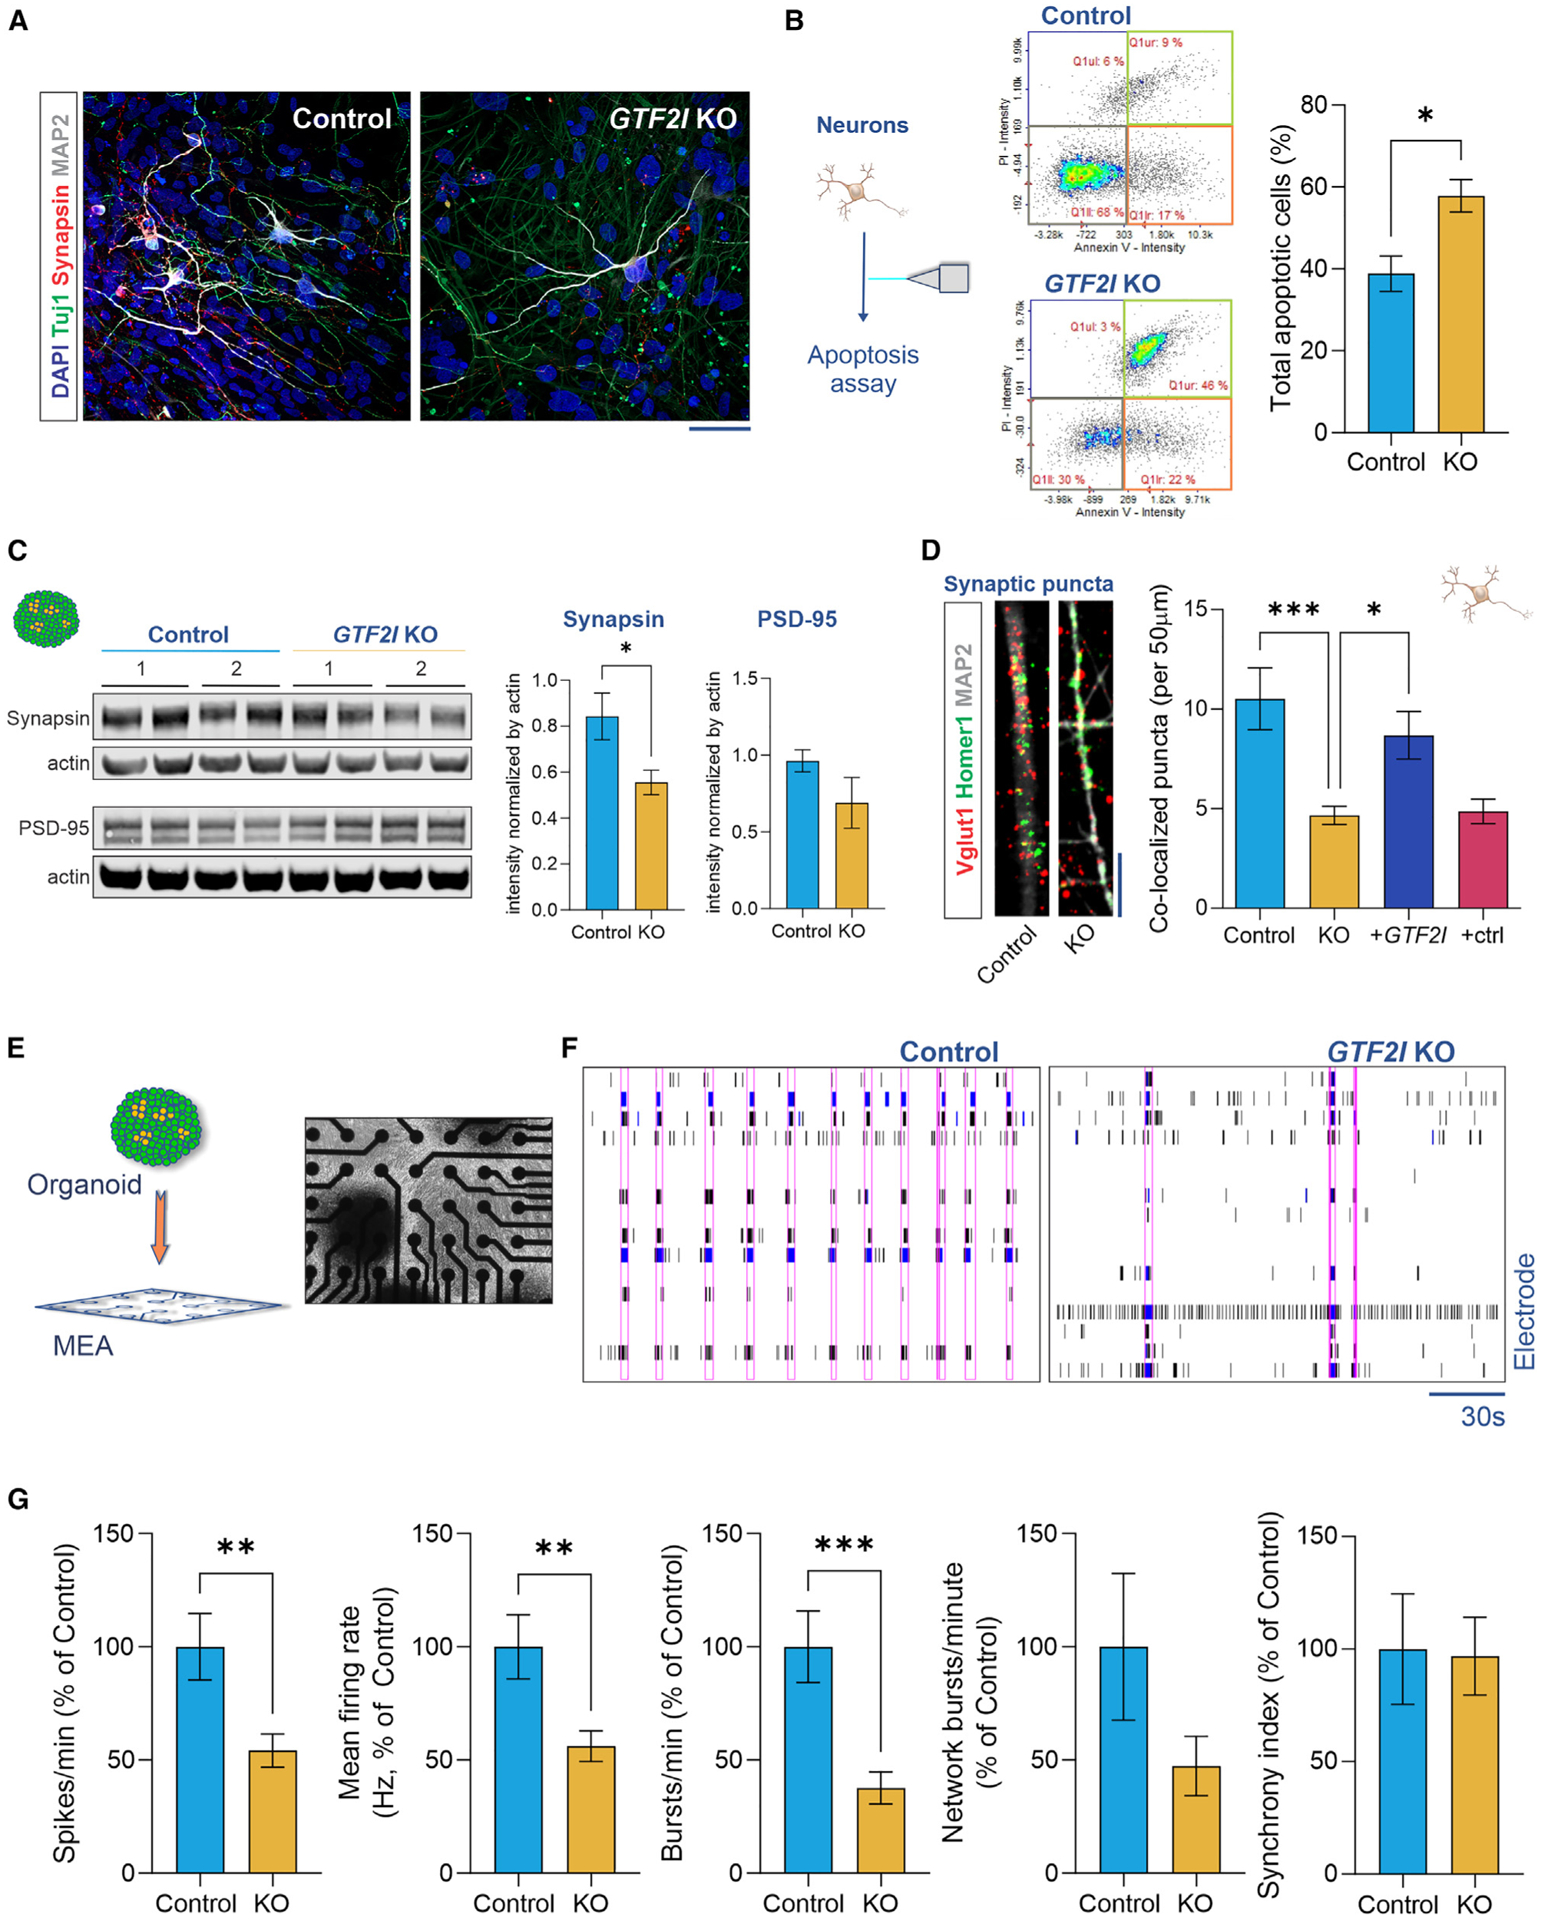
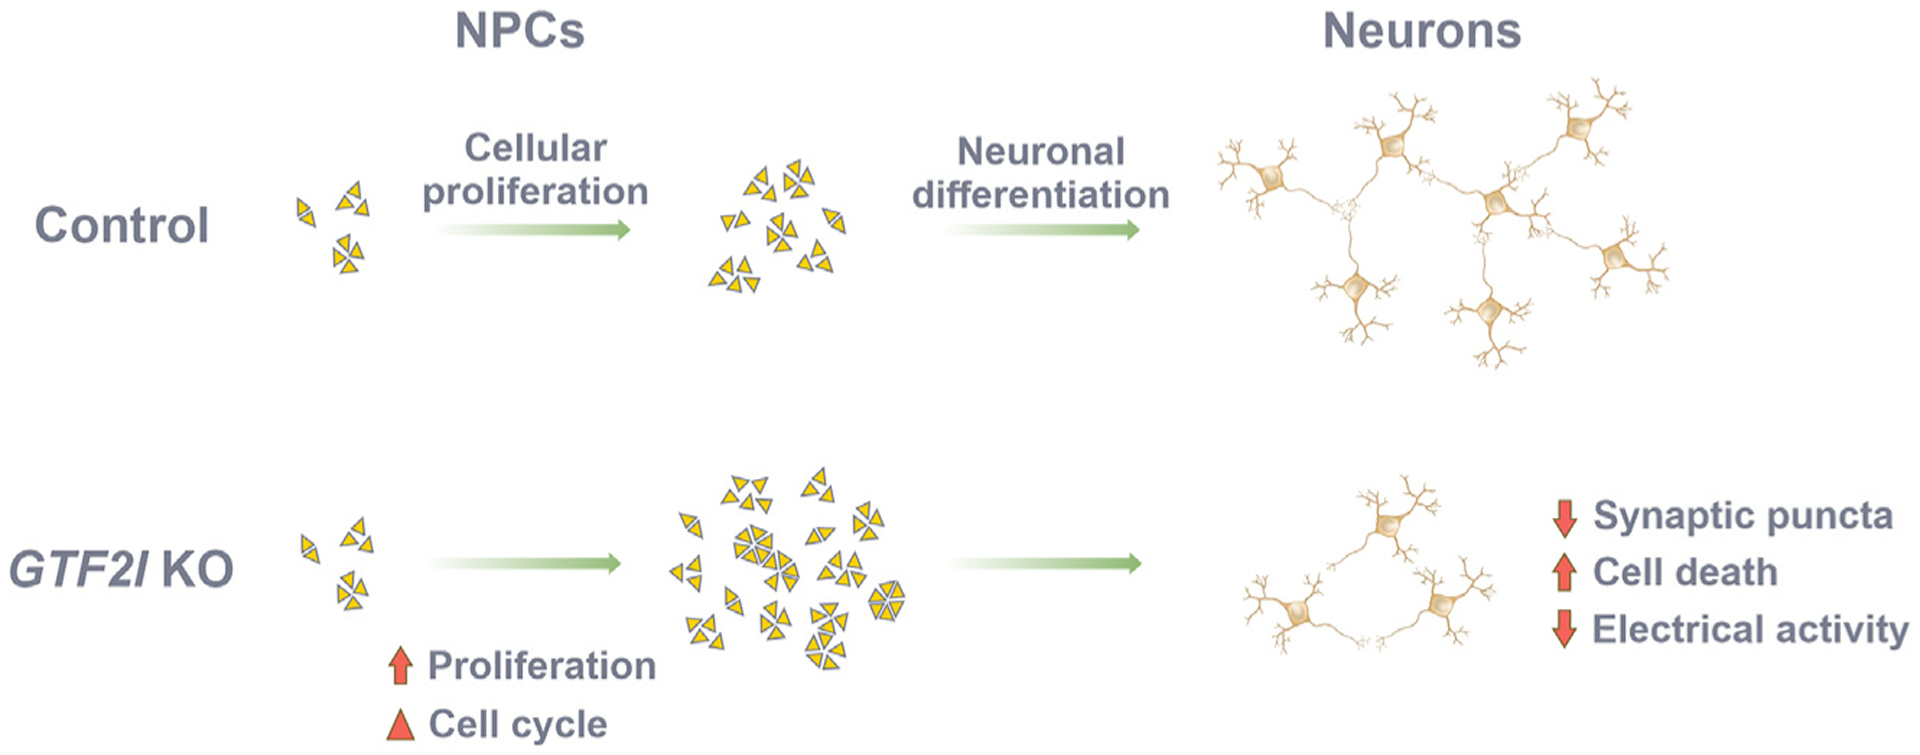
Individuals with Williams syndrome (WS), a neurodevelopmental disorder caused by hemizygous loss of 26-28 genes at 7q11.23, characteristically portray a hypersocial phenotype. Copy-number variations and mutations in one of these genes, GTF2I, are associated with altered sociality and are proposed to underlie hypersociality in WS. However, the contribution of GTF2I to human neurodevelopment remains poorly understood. Here, human cellular models of neurodevelopment, including neural progenitors, neurons, and three-dimensional cortical organoids, are differentiated from CRISPR-Cas9-edited GTF2I-knockout (GTF2I-KO) pluripotent stem cells to investigate the role of GTF2I in human neurodevelopment. GTF2I-KO progenitors exhibit increased proliferation and cell-cycle alterations. Cortical organoids and neurons demonstrate increased cell death and synaptic dysregulation, including synaptic structural dysfunction and decreased electrophysiological activity on a multielectrode array. Our findings suggest that changes in synaptic circuit integrity may be a prominent mediator of the link between alterations in GTF2I and variation in the phenotypic expression of human sociality.

Keywords: CP: Developmental biology; CP: Neuroscience; GTF2I; Williams syndrome; brain organoid; cortical organoid; neurodevelopment; stem cells.


Conflict of interest statement

Declaration of interests A.R.M. is a cofounder and has equity interest in TISMOO, a company dedicated to genetic analysis and brain organoid modeling focusing on therapeutic applications customized for ASD and other neurological disorders with genetic origins. The terms of this arrangement have been reviewed and approved by the University of California, San Diego in accordance with its conflict-of-interest policies.

Figures

Figure 1.
Figure 1.. Transcriptomic alterations in GTF2I-KO cortical organoids
(A) Depiction of the GTF2I locus on chromosome 7 (top) and representation of its alleles in the control and GTF2I-KO conditions (bottom). (B) Schematic showing the differentiation protocol of cortical organoids from hiPSCs. (C) Immunostaining of 2-month-old organoids showed progenitor regions of Ki67 positivity that give rise to mature neurons immunopositive for NeuN and MAP2; scale bar, 200 μm. (D) GTF2I is robustly expressed in 2-month-old control organoids and absent in GTF2I-KO organoids; scale bar, 200 μm. (E) Volcano plot showing differentially expressed genes detected by RNA sequencing of 2-month-old control and GTF2I-KO organoids. (F and G) Gene Ontology analysis of top 10 and bottom 10 altered gene expression pathways within the categories “cellular component” (F) and “ biological process” (G).
Figure 2.
Figure 2.. Loss of GTF2I alters proliferation dynamics and survival in human cell models
(A) Reduced diameter of GTF2I-KO cortical organoids compared to controls (Student’s t test, t96 = 5.73, p < 0.0001; n = 43 control and 55 GTF2I-KO organoids); scale bar, 1,000 μm. (B) Left, organoid dissociation into single-cell suspension to analyze apoptotic cell frequency. Right, compared to controls, GTF2I-KO organoids have a higher frequency of apoptotic cells at 2 months (Student’s t test, t17 = 3.35, p = 0.004; n = 7 replicates of ~5–10 control organoids and 12 replicates of ~5–10 GTF2I-KO organoids) and 3 months (Student’s t test, t12 = 2.71, p = 0.019; n = 5 replicates of ~5–10 control organoids and 9 replicates of ~5–10 GTF2I-KO organoids) of age. See also Figure S4B. (C) Immunostaining portrays Nestin+ NPCs; scale bar, 100 mm. See also Figure S4C. (D) GTF2I-KO NPCs exhibited a higher proliferation rate per day (Student’s t test, t14 = 4.37, p = 0.001; n = 7 wells of control NPCs and 9 wells of GTF2I-KO NPCs); scale bar, 1,000 μm. See also Figure S4D. (E) NPCs evaluated with cell-cycle and DNA fragmentation assays. (F) GTF2I-KO NPCs show an altered cell-cycle profile compared to controls (2-way ANOVA, F2,54 = 7.829, p = 0.001; n = 6 10-cm plates of control NPCs and 14 10-cm plates of GTF2I-KO NPCs). (G) GTF2I-KO and control NPCs showed a similar frequency of cells with fragmented DNA (Student’s t test, t11 = 1.26, p = 0.23; n = 5 10-cm plates of control NPCs and 8 10-cm plates of GTF2I-KO NPCs). Data are presented as mean ± SEM.
Figure 3.
Figure 3.. Loss of GTF2I is associated with synaptic dysfunction and decreased electrical activity in human neurons and cortical organoids
(A) Representative images of neurons differentiated from NPCs immunostained positive for the mature neuronal markers b-tubulin (Tuj1), synapsin, and MAP2; scale bar, 100 μm. See also Figure S4E. (B) Compared to controls, GTF2I-KO neurons exhibited a higher frequency of apoptotic cells (Student’s t test, t7 = 3.16, p = 0.016; n = 5 10-cm plates of CVB control neurons and n = 4 10-cm plates of CVB GTF2I-KO neurons). (C) Representative western blots (left) and quantification (right) of the presynaptic protein synapsin (Mann-Whitney U test, p = 0.026; n = 6 control samples and n = 6 GTF2I-KO samples from CVB and WT83 hiPSC lines) and the postsynaptic protein PSD-95 (Mann-Whitney U test, p = 0.69; n = 4 control samples and n = 4 GTF2I-KO samples from CVB and WT83 hiPSC lines); samples are independent protein extractions of ~10 organoids, with intensity normalized by actin and averaged from duplicate lanes. (D) Co-localized synaptic puncta density was reduced in GTF2I-KO neurons and reversible by GTF2I re-expression (1-way ANOVA, F3,90 = 7.703, p = 0.0001, with Dunnett’s multiple comparison’s test; control vs. KO: p = 0.0001, KO vs. +GTF2I: p = 0.026, KO vs. +ctrl: p = 0.99; n = 16–33 neurons from CVB and WT83 hiPSC lines); scale bar, 10 μm. See also Figure S4F. (E) Representation and top-down image of organoid plated for MEA electrophysiology. (F) Representative MEA raster plots for control and GTF2I-KO organoids. Pink rectangles generated by Axion NeuralMetric software denote network bursts. (G) Compared to controls, GTF2I-KO organoids show fewer spikes per minute (Student’s t test, Welch corrected, t71.5 = 2.80, p = 0.007; n = 50 control and n = 44 GTF2I-KO MEA-plate wells), a decreased firing rate (Student’s t test, Welch corrected, t56.9 = 2.80, p = 0.007; n = 41 control and n = 37 GTF2I-KO MEA-plate wells), and fewer bursts per minute (Student’s t test, Welch corrected, t49.7 = 3.61, p = 0.001; n = 37 control and n = 33 GTF2I-KO MEA-plate wells), with less difference in the network burst rate (Student’s t test, Welch corrected, t15.3 = 1.51, p = 0.15; n = 13 control and n = 6 GTF2I-KO MEA-plate wells) or the synchrony index (Student’s t test, t63 = 0.11, p = 0.92; n = 31 control and n = 34 GTF2I-KO MEA-plate wells); samples include organoids from CVB and WT83 hiPSC lines, pooled from multiple experiments. Data are presented as mean ± SEM.
Figure 4.
Figure 4.. Summary of human cellular neurodevelopmental changes resulting from the loss of GTF2I
Loss of GTF2I results in cell-cycle alterations and increased proliferation of NPCs compared to controls. GTF2I-KO NPCs differentiate into neural networks that have less synaptic structural integrity, decreased electrical activity, and increased cell death.

Similar articles

Cited by

References

    1. Somerville MJ, Mervis CB, Young EJ, Seo E-J, del Campo M, Bamforth S, Peregrine E, Loo W, Lilley M, Pérez-Jurado LA, et al. (2005). Severe Expressive-Language Delay Related to Duplication of the Williams–Beuren Locus. N. Engl. J. Med 353, 1694–1701. 10.1056/nejmoa051962. - DOI - PMC - PubMed
    1. Pober BR (2010). Williams–Beuren Syndrome. N. Engl. J. Med 362, 239–252. 10.1056/NEJMra0903074. - DOI - PubMed
    1. Preus M (1984). The Williams syndrome: objective definition and diagnosis. Clin. Genet 25, 422–428. 10.1111/j.1399-0004.1984.tb02011.x. - DOI - PubMed
    1. Morris CA, Mervis CB, Paciorkowski AP, Abdul-Rahman O, Dugan SL, Rope AF, Bader P, Hendon LG, Velleman SL, Klein-Tasman BP, and Osborne LR (2015). 7q11.23 Duplication syndrome: Physical characteristics and natural history. Am. J. Med. Genet 167A, 2916–2935. 10.1002/ajmg.a.37340. - DOI - PMC - PubMed
    1. Kozel BA, Barak B, Kim CA, Mervis CB, Osborne LR, Porter M, and Pober BR (2021). Williams syndrome. Nat. Rev. Dis. Prim 7, 42. 10.1038/s41572-021-00276-z. - DOI - PMC - PubMed

Publication types

MeSH terms

Substances