

Spatial regression models to assess variations of composite index for anthropometric failure across the administrative zones in Ethiopia
- PMID: 38416735
- PMCID: PMC10901317
- DOI: 10.1371/journal.pone.0282463
Spatial regression models to assess variations of composite index for anthropometric failure across the administrative zones in Ethiopia
Abstract
Background: There are a number of previous studies that investigated undernutrition and its determinants in Ethiopia. However, the national average in the level of undernutrition conceals large variation across administrative zones of Ethiopia. Hence, this study aimed to determine the geographic distribution of composite index for anthropometric failure (CIAF) and identify the influencing factors it' might be more appropriate.
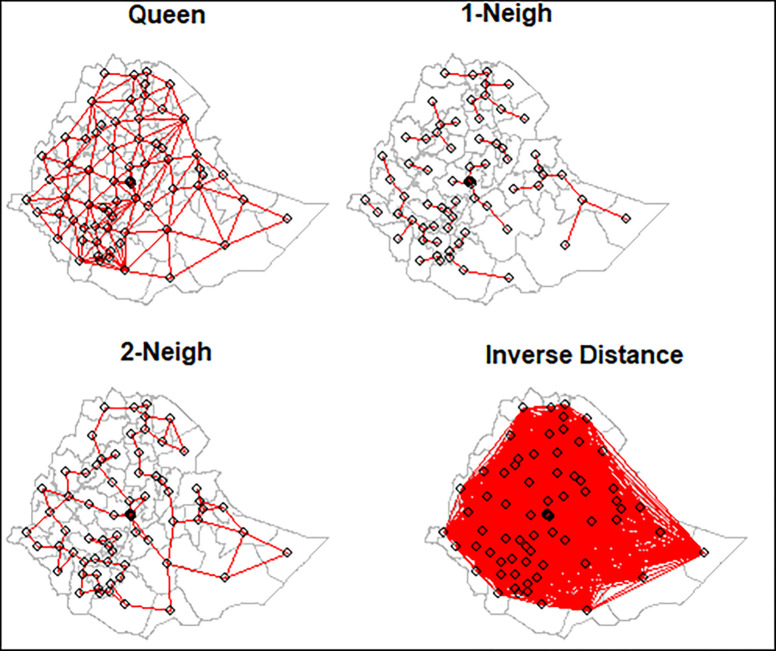
Methods: We used the zonal-level undernutrition data for the under-five children in Ethiopia from the Ethiopian Demographic and Health Survey (EDHS) dataset. Different spatial models were applied to explore the spatial distribution of the CIAF and the covariates.
Results: The Univariate Moran's I statistics for CIAF showed spatial heterogeneity of undernutrition in Ethiopian administrative zones. The spatial autocorrelation model (SAC) was the best fit based on the AIC criteria. Results from the SAC model suggested that the CIAF was positively associated with mothers' illiteracy rate (0.61, pvalue 0.001), lower body mass index (0.92, pvalue = 0.023), and maximum temperature (0.2, pvalue = 0.0231) respectively. However, the CIAF was negatively associated with children without any comorbidity (-0.82, pvalue = 0.023), from families with accessibility of improved drinking water (-0.26, pvalue = 0.012), and minimum temperature (-0.16).
Conclusion: The CIAF across the administrative zones of Ethiopia is spatially clustered. Improving women's education, improving drinking water, and improving child breast feeding can reduce the prevalence of undernutrition (CIAF) across Ethiopian administrative zones. Moreover, targeted intervention in the geographical hotspots of CIAF can reduce the burden of CIAF across the administrative zones.
Copyright: © 2024 Fenta et al. This is an open access article distributed under the terms of the Creative Commons Attribution License, which permits unrestricted use, distribution, and reproduction in any medium, provided the original author and source are credited.
Conflict of interest statement
The authors have declared that no competing interests exist.
Figures


Similar articles
-
Space-time dynamics regression models to assess variations of composite index for anthropometric failure across the administrative zones in Ethiopia.BMC Public Health. 2022 Aug 15;22(1):1550. doi: 10.1186/s12889-022-13939-7. BMC Public Health. 2022. PMID: 35971115 Free PMC article.
-
Disparities in childhood composite index of anthropometric failure prevalence and determinants across Ethiopian administrative zones.PLoS One. 2021 Sep 23;16(9):e0256726. doi: 10.1371/journal.pone.0256726. eCollection 2021. PLoS One. 2021. PMID: 34555038 Free PMC article.
-
Anthropometric failures and its predictors among under five children in Ethiopia: multilevel logistic regression model using 2019 Ethiopian demographic and health survey data.BMC Public Health. 2024 Apr 24;24(1):1149. doi: 10.1186/s12889-024-18625-4. BMC Public Health. 2024. PMID: 38658941 Free PMC article.
-
Bivariate binary analysis on composite index of anthropometric failure of under-five children and household wealth-index.BMC Pediatr. 2021 Jul 31;21(1):332. doi: 10.1186/s12887-021-02770-5. BMC Pediatr. 2021. PMID: 34332585 Free PMC article.
-
Applied nutritional investigation spatial variation and determinants of stunting among children aged less than 5 y in Ethiopia: A spatial and multilevel analysis of Ethiopian Demographic and Health Survey 2019.Nutrition. 2022 Nov-Dec;103-104:111786. doi: 10.1016/j.nut.2022.111786. Epub 2022 Jul 1. Nutrition. 2022. PMID: 35970098 Review.
Cited by
-
Spatial distributions and determinants of intimate partner violence among married women in Ethiopia across administrative zones.PLoS One. 2025 Feb 19;20(2):e0310039. doi: 10.1371/journal.pone.0310039. eCollection 2025. PLoS One. 2025. PMID: 39970148 Free PMC article.
References
-
- Consensus C., Expert panel findings. Copenhagen Consensus, 2012.
-
- Collaborators G.R.F., Global, regional, and national comparative risk assessment of 79 behavioural, environmental and occupational, and metabolic risks or clusters of risks, 1990–2015: a systematic analysis for the Global Burden of Disease Study 2015. Lancet (London, England), 2016. 388(10053): p. 1659. doi: 10.1016/S0140-6736(16)31679-8 - DOI - PMC - PubMed
MeSH terms
Substances
LinkOut - more resources
Full Text Sources
Medical
