

Correlation between pose estimation features regarding movements towards the midline in early infancy
- PMID: 38416738
- PMCID: PMC10901309
- DOI: 10.1371/journal.pone.0299758
Correlation between pose estimation features regarding movements towards the midline in early infancy
Abstract
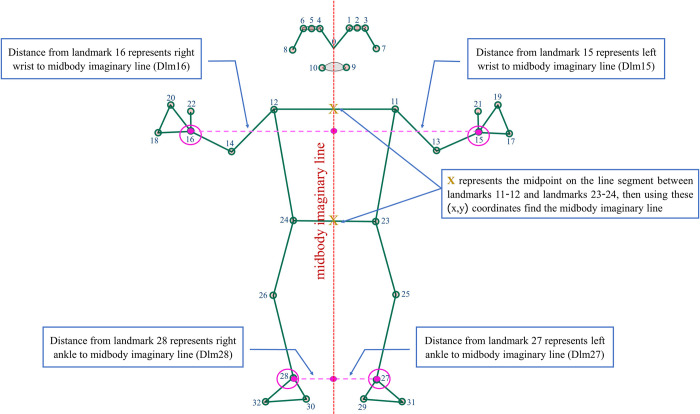
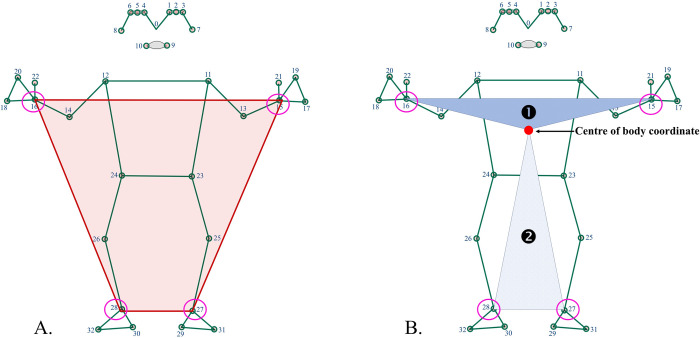
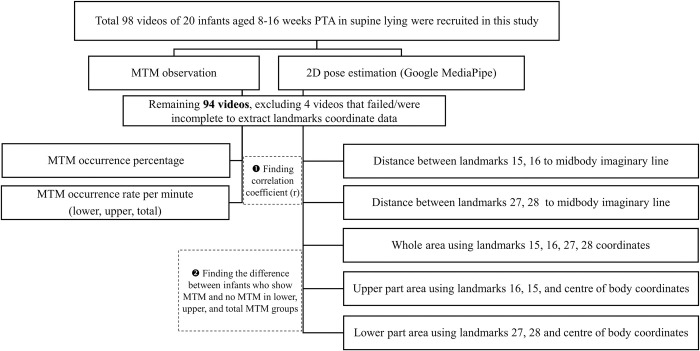
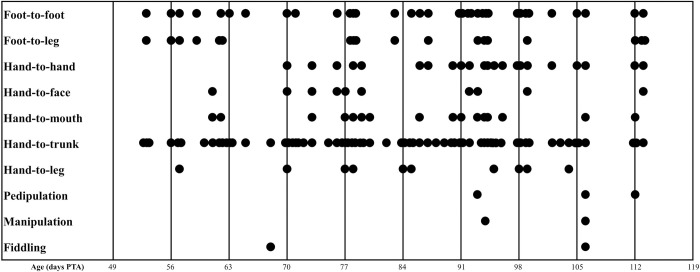
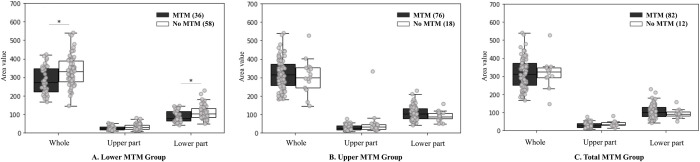
In infants, spontaneous movement towards the midline (MTM) indicates the initiation of anti-gravity ability development. Markerless 2D pose estimation is a cost-effective, time-efficient, and quantifiable alternative to movement assessment. We aimed to establish correlations between pose estimation features and MTM in early-age infants. Ninety-four infant videos were analysed to calculate the percentage and rate of MTM occurrence. 2D Pose estimation processed the videos and determined the distances and areas using wrist and ankle landmark coordinates. We collected data using video recordings from 20 infants aged 8-16 weeks post-term age. Correlations between MTM observations and distance values were evaluated. Differences in areas between groups of videos showing MTM and no MTM in the total, lower-limb, and upper-limb categories were examined. MTM observations revealed common occurrences of hand-to-trunk and foot-to-foot movements. Weak correlations were noted between limb distances to the midbody imaginary line and MTM occurrence values. Lower MTM showed significant differences in the lower part (p = 0.003) and whole area (p = 0.001). Video recording by parents or guardians could extract features using 2D pose estimation, assisting in the early identification of MTM in infants. Further research is required to assess a larger sample size with the diversity of MTM motor behaviour, and later developmental skills, and collect data from at-risk infants.
Copyright: © 2024 Sermpon, Gima. This is an open access article distributed under the terms of the Creative Commons Attribution License, which permits unrestricted use, distribution, and reproduction in any medium, provided the original author and source are credited.
Conflict of interest statement
The authors have declared that no competing interests exist.
Figures
Similar articles
-
Relationship between fidgety movement and frequency of movement toward midline: An observational study.Early Hum Dev. 2023 Mar;177-178:105718. doi: 10.1016/j.earlhumdev.2023.105718. Epub 2023 Feb 1. Early Hum Dev. 2023. PMID: 36801663
-
Towards human-level performance on automatic pose estimation of infant spontaneous movements.Comput Med Imaging Graph. 2022 Jan;95:102012. doi: 10.1016/j.compmedimag.2021.102012. Epub 2021 Nov 26. Comput Med Imaging Graph. 2022. PMID: 34864580
-
Automated pose estimation captures key aspects of General Movements at eight to 17 weeks from conventional videos.Acta Paediatr. 2019 Oct;108(10):1817-1824. doi: 10.1111/apa.14781. Epub 2019 Apr 1. Acta Paediatr. 2019. PMID: 30883894
-
A self-supervised spatio-temporal attention network for video-based 3D infant pose estimation.Med Image Anal. 2024 Aug;96:103208. doi: 10.1016/j.media.2024.103208. Epub 2024 May 18. Med Image Anal. 2024. PMID: 38788327
-
Using senses to encourage head and upper limb voluntary movement in young infants: Implications for early intervention.Dev Neurorehabil. 2016 Oct;19(5):295-314. doi: 10.3109/17518423.2014.1002636. Epub 2015 Mar 31. Dev Neurorehabil. 2016. PMID: 25826653 Review.
Cited by
-
Quantifying Arm and Leg Movements in 3-Month-Old Infants Using Pose Estimation: Proof of Concept.Sensors (Basel). 2024 Nov 27;24(23):7586. doi: 10.3390/s24237586. Sensors (Basel). 2024. PMID: 39686123 Free PMC article.
References
-
- Einspieler C, Prechtl HFR, Bos A, Ferrari F, Cioni G. Prechtl’s method on the qualitative assessment of general movements in preterm, term and young infants. Clin Dev Med. 2004;167: 1–91. - PubMed
MeSH terms
LinkOut - more resources
Full Text Sources
