

Longitudinal analysis of post-acute chikungunya-associated arthralgia in children and adults: A prospective cohort study in Managua, Nicaragua (2014-2018)
- PMID: 38416797
- PMCID: PMC10962812
- DOI: 10.1371/journal.pntd.0011948
Longitudinal analysis of post-acute chikungunya-associated arthralgia in children and adults: A prospective cohort study in Managua, Nicaragua (2014-2018)
Abstract
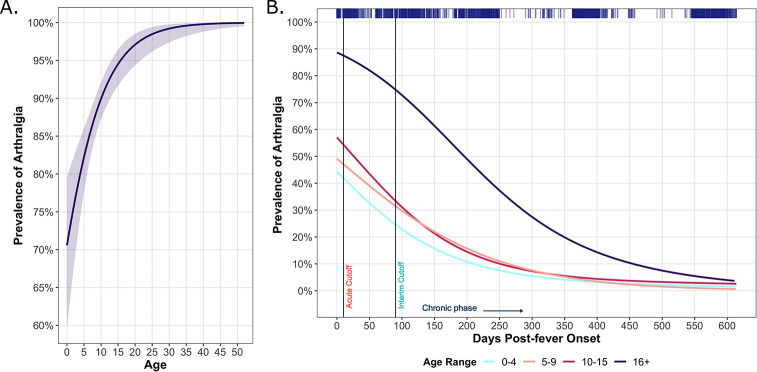
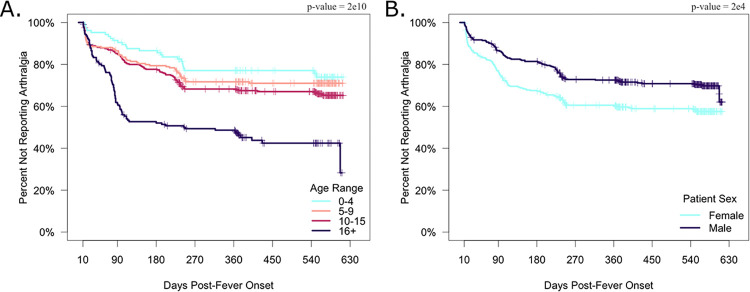
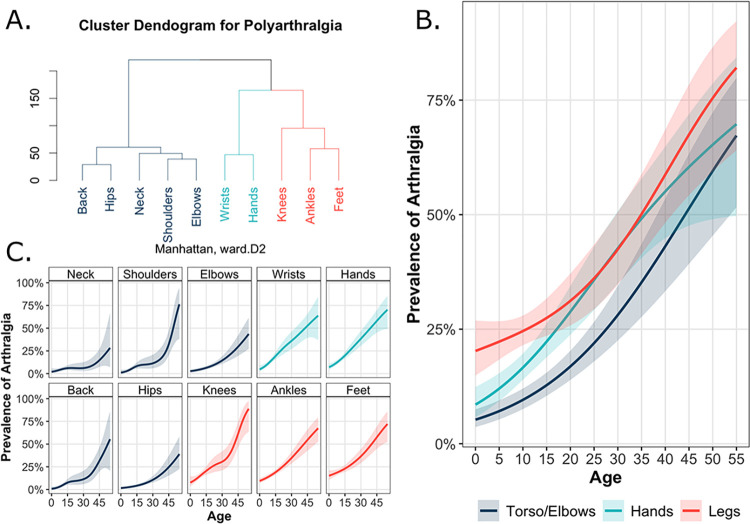
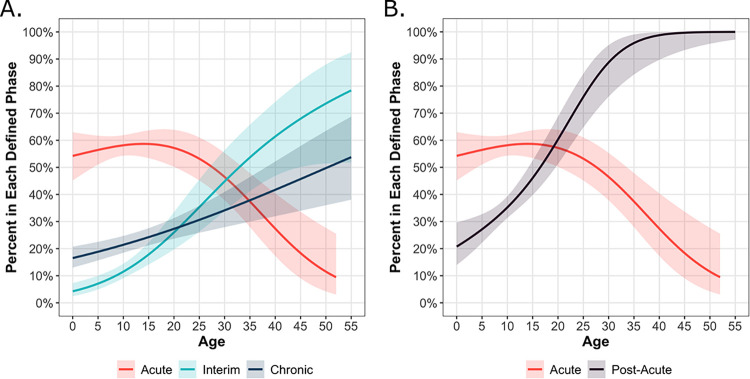
Chikungunya can result in debilitating arthralgia, often presenting as acute, self-limited pain, but occasionally manifesting chronically. Little is known about differences in chikungunya-associated arthralgia comparing children to adults over time. To characterize long-term chikungunya-associated arthralgia, we recruited 770 patients (105 0-4 years old [y/o], 200 5-9 y/o, 307 10-15 y/o, and 158 16+ y/o) with symptomatic chikungunya virus infections in Managua, Nicaragua, during two consecutive chikungunya epidemics (2014-2015). Participants were assessed at ~15 days and 1, 3, 6, 12, and 18 months post-fever onset. Following clinical guidelines, we defined participants by their last reported instance of arthralgia as acute (≤10 days post-fever onset), interim (>10 and <90 days), or chronic (≥90 days) cases. We observed a high prevalence of arthralgia (80-95%) across all ages over the study period. Overall, the odds of acute arthralgia increased in an age-dependent manner, with the lowest odds of arthralgia in the 0-4 y/o group (odds ratio [OR]: 0.27, 95% confidence interval [CI]: 0.14-0.51) and the highest odds of arthralgia in the 16+ y/o participants (OR: 4.91, 95% CI: 1.42-30.95) relative to 10-15 y/o participants. Females had higher odds of acute arthralgia than males (OR: 1.63, 95% CI: 1.01-2.65) across all ages. We found that 23-36% of pediatric and 53% of adult participants reported an instance of post-acute arthralgia. Children exhibited the highest prevalence of post-acute polyarthralgia in their legs, followed by the hands and torso - a pattern not seen among adult participants. Further, we observed pediatric chikungunya presenting in two distinct phases: the acute phase and the subsequent interim/chronic phases. Thus, differences in the presentation of arthralgia were observed across age, sex, and disease phase in this longitudinal chikungunya cohort. Our results elucidate the long-term burden of chikungunya-associated arthralgia among pediatric and adult populations.
Copyright: © 2024 Warnes et al. This is an open access article distributed under the terms of the Creative Commons Attribution License, which permits unrestricted use, distribution, and reproduction in any medium, provided the original author and source are credited.
Conflict of interest statement
The authors have declared that no competing interests exist.
Figures
Update of
-
Longitudinal Analysis of the Burden of Post-Acute Chikungunya-Associated Arthralgia in Children and Adults: A Prospective Cohort Study in Managua, Nicaragua (2014-2019).medRxiv [Preprint]. 2023 May 17:2023.05.09.23289726. doi: 10.1101/2023.05.09.23289726. medRxiv. 2023. Update in: PLoS Negl Trop Dis. 2024 Feb 28;18(2):e0011948. doi: 10.1371/journal.pntd.0011948. PMID: 37214808 Free PMC article. Updated. Preprint.
Similar articles
-
Longitudinal Analysis of the Burden of Post-Acute Chikungunya-Associated Arthralgia in Children and Adults: A Prospective Cohort Study in Managua, Nicaragua (2014-2019).medRxiv [Preprint]. 2023 May 17:2023.05.09.23289726. doi: 10.1101/2023.05.09.23289726. medRxiv. 2023. Update in: PLoS Negl Trop Dis. 2024 Feb 28;18(2):e0011948. doi: 10.1371/journal.pntd.0011948. PMID: 37214808 Free PMC article. Updated. Preprint.
-
Risk of chronic arthralgia and impact of pain on daily activities in a cohort of patients with chikungunya virus infection from Brazil.Int J Infect Dis. 2021 Apr;105:608-616. doi: 10.1016/j.ijid.2021.03.003. Epub 2021 Mar 5. Int J Infect Dis. 2021. PMID: 33684559
-
Chikungunya virus infection in Aruba: Diagnosis, clinical features and predictors of post-chikungunya chronic polyarthralgia.PLoS One. 2018 Apr 30;13(4):e0196630. doi: 10.1371/journal.pone.0196630. eCollection 2018. PLoS One. 2018. PMID: 29709007 Free PMC article.
-
Arthralgia resolution rate following chikungunya virus infection.Int J Infect Dis. 2021 Nov;112:1-7. doi: 10.1016/j.ijid.2021.08.066. Epub 2021 Sep 4. Int J Infect Dis. 2021. PMID: 34492392 Free PMC article. Review.
-
Chikungunya Virus-Associated Disease.Curr Rheumatol Rep. 2017 Oct 5;19(11):69. doi: 10.1007/s11926-017-0694-0. Curr Rheumatol Rep. 2017. PMID: 28983760 Review.
Cited by
-
Lack of pathogenic involvement of CCL4 and its receptor CCR5 in arthritogenic alphavirus disease.bioRxiv [Preprint]. 2024 Aug 3:2024.07.31.606106. doi: 10.1101/2024.07.31.606106. bioRxiv. 2024. Update in: Immunohorizons. 2025 May 30;9(7):vlaf022. doi: 10.1093/immhor/vlaf022. PMID: 39131287 Free PMC article. Updated. Preprint.
-
Comparison of dengue, chikungunya, and Zika among children in Nicaragua across 18 years: a single-centre, prospective cohort study.Lancet Child Adolesc Health. 2025 Sep;9(9):622-633. doi: 10.1016/S2352-4642(25)00168-3. Lancet Child Adolesc Health. 2025. PMID: 40774783
-
Granulocyte colony-stimulating factor protects against arthritogenic alphavirus pathogenesis in a type I IFN-dependent manner.bioRxiv [Preprint]. 2024 Oct 13:2024.10.09.617470. doi: 10.1101/2024.10.09.617470. bioRxiv. 2024. Update in: Front Immunol. 2025 Jul 11;16:1606053. doi: 10.3389/fimmu.2025.1606053. PMID: 39416071 Free PMC article. Updated. Preprint.
-
Global burden of chikungunya virus infections and the potential benefit of vaccination campaigns.Nat Med. 2025 Jul;31(7):2342-2349. doi: 10.1038/s41591-025-03703-w. Epub 2025 Jun 10. Nat Med. 2025. PMID: 40495015 Free PMC article.
-
Granulocyte colony-stimulating factor protects against acute systemic alphavirus disease in a type I IFN-dependent manner.Front Immunol. 2025 Jul 11;16:1606053. doi: 10.3389/fimmu.2025.1606053. eCollection 2025. Front Immunol. 2025. PMID: 40718486 Free PMC article.
References
-
- Lumsden WHR. An epidemic of virus disease in Southern Province, Tanganyika territory, in 1952–1953 II. General description and epidemiology. Trans R Soc Trop Med Hyg. 1955. Jan 1;49(1):33–57. - PubMed
-
- Simon F, Javelle E, Cabie A, Bouquillard E, Troisgros O, Gentile G, et al.. French guidelines for the management of chikungunya (acute and persistent presentations). November 2014. Médecine Mal Infect. 2015. Jul 1;45(7):243–63. - PubMed
MeSH terms
Grants and funding
LinkOut - more resources
Full Text Sources
Medical
