

Single-cell herpes simplex virus type 1 infection of neurons using drop-based microfluidics reveals heterogeneous replication kinetics
- PMID: 38416818
- PMCID: PMC10901367
- DOI: 10.1126/sciadv.adk9185
Single-cell herpes simplex virus type 1 infection of neurons using drop-based microfluidics reveals heterogeneous replication kinetics
Abstract
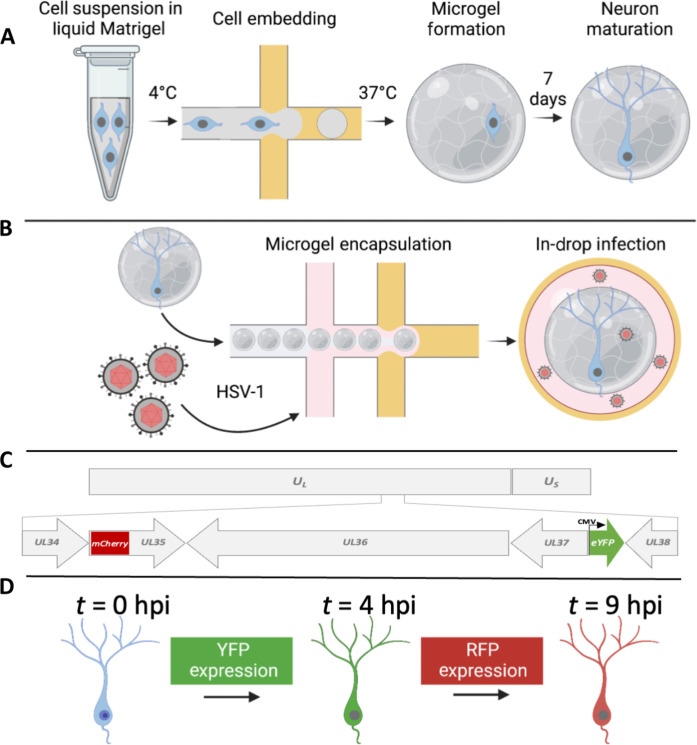
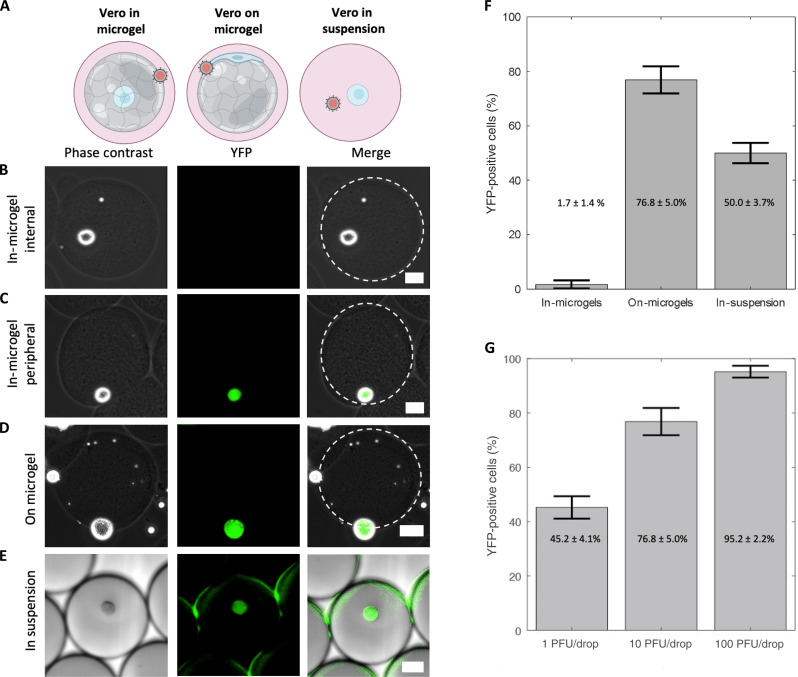
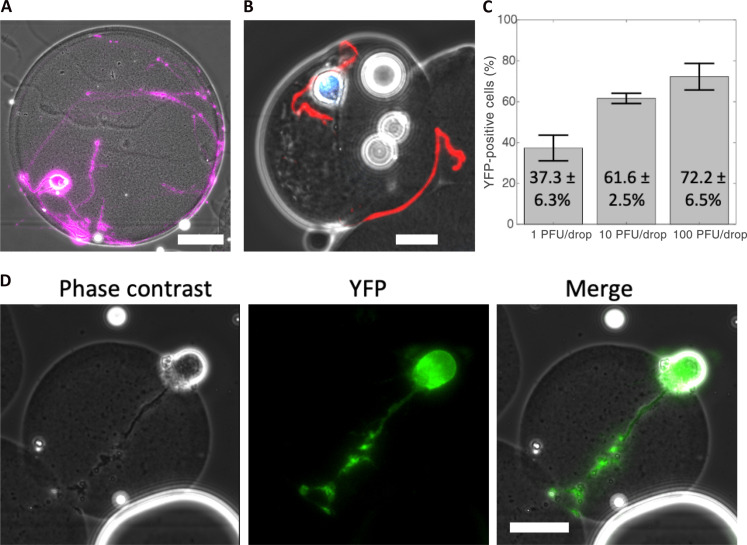
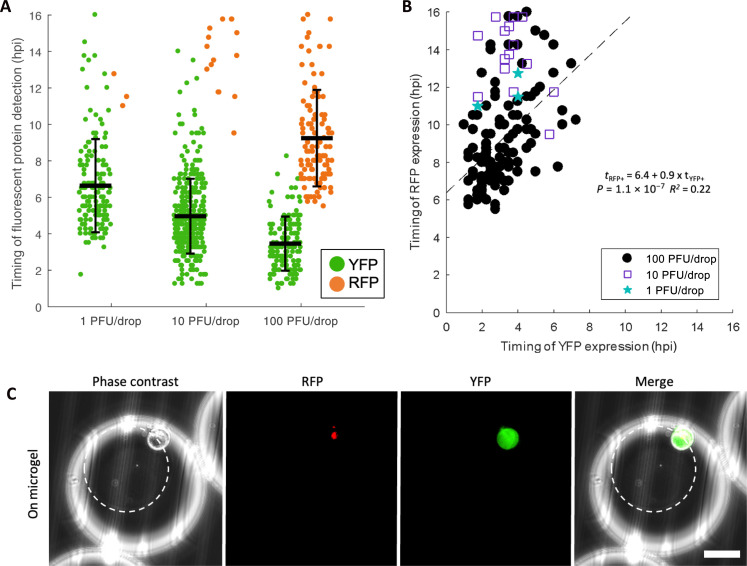
Single-cell analyses of viral infections reveal heterogeneity that is not detected by traditional population-level studies. This study applies drop-based microfluidics to investigate the dynamics of herpes simplex virus type 1 (HSV-1) infection of neurons at the single-cell level. We used micrometer-scale Matrigel beads, termed microgels, to culture individual murine superior cervical ganglia (SCG) neurons or epithelial cells. Microgel-cultured cells are encapsulated in individual media-in-oil droplets with a dual-fluorescent reporter HSV-1, enabling real-time observation of viral gene expression and replication. Infection within drops revealed that the kinetics of initial viral gene expression and replication were dependent on the inoculating dose. Notably, increasing inoculating doses led to earlier onset of viral gene expression and more frequent productive viral replication. These observations provide crucial insights into the complexity of HSV-1 infection in neurons and emphasize the importance of studying single-cell outcomes of viral infection. These techniques for cell culture and infection in drops provide a foundation for future virology and neurobiology investigations.
Figures

Update of
-
Single-cell Herpes Simplex Virus type-1 infection of neurons using drop-based microfluidics reveals heterogeneous replication kinetics.bioRxiv [Preprint]. 2023 Sep 18:2023.09.18.558333. doi: 10.1101/2023.09.18.558333. bioRxiv. 2023. Update in: Sci Adv. 2024 Mar;10(9):eadk9185. doi: 10.1126/sciadv.adk9185. PMID: 37790515 Free PMC article. Updated. Preprint.
Similar articles
-
A dual fluorescent herpes simplex virus type 1 recombinant reveals divergent outcomes of neuronal infection.J Virol. 2024 May 14;98(5):e0003224. doi: 10.1128/jvi.00032-24. Epub 2024 Apr 23. J Virol. 2024. PMID: 38651900 Free PMC article.
-
Single-cell Herpes Simplex Virus type-1 infection of neurons using drop-based microfluidics reveals heterogeneous replication kinetics.bioRxiv [Preprint]. 2023 Sep 18:2023.09.18.558333. doi: 10.1101/2023.09.18.558333. bioRxiv. 2023. Update in: Sci Adv. 2024 Mar;10(9):eadk9185. doi: 10.1126/sciadv.adk9185. PMID: 37790515 Free PMC article. Updated. Preprint.
-
Transcription of the herpes simplex virus 1 genome during productive and quiescent infection of neuronal and nonneuronal cells.J Virol. 2014 Jun;88(12):6847-61. doi: 10.1128/JVI.00516-14. Epub 2014 Apr 9. J Virol. 2014. PMID: 24719411 Free PMC article.
-
DLK-Dependent Biphasic Reactivation of Herpes Simplex Virus Latency Established in the Absence of Antivirals.J Virol. 2022 Jun 22;96(12):e0050822. doi: 10.1128/jvi.00508-22. Epub 2022 May 24. J Virol. 2022. PMID: 35608347 Free PMC article.
-
Infection and Transport of Herpes Simplex Virus Type 1 in Neurons: Role of the Cytoskeleton.Viruses. 2018 Feb 23;10(2):92. doi: 10.3390/v10020092. Viruses. 2018. PMID: 29473915 Free PMC article. Review.
Cited by
-
Development of a reporter feline herpesvirus-1 for antiviral screening assays.Vet Res. 2024 Dec 18;55(1):167. doi: 10.1186/s13567-024-01430-7. Vet Res. 2024. PMID: 39696698 Free PMC article.
-
An updated review of HSV-1 infection-associated diseases and treatment, vaccine development, and vector therapy application.Virulence. 2024 Dec;15(1):2425744. doi: 10.1080/21505594.2024.2425744. Epub 2024 Nov 13. Virulence. 2024. PMID: 39508503 Free PMC article. Review.
-
A dual fluorescent herpes simplex virus type 1 recombinant reveals divergent outcomes of neuronal infection.J Virol. 2024 May 14;98(5):e0003224. doi: 10.1128/jvi.00032-24. Epub 2024 Apr 23. J Virol. 2024. PMID: 38651900 Free PMC article.
-
All the single cells: if you like it then you should put some virus on it.J Virol. 2024 Jul 23;98(7):e0127323. doi: 10.1128/jvi.01273-23. Epub 2024 Jun 21. J Virol. 2024. PMID: 38904395 Free PMC article. Review.
References
-
- Simpson C., Lee S. S., Lee C.-S., Yamauchi Y., Microfluidics: An untapped resource in viral diagnostics and viral cell biology. Curr. Clin. Microbiol. Rep. 5, 245–251 (2018).
Publication types
MeSH terms
Grants and funding
LinkOut - more resources
Full Text Sources
Medical
