. 2024 Apr 1;221(4):e20221080.
doi: 10.1084/jem.20221080. Epub 2024 Feb 28.

Rare SH2B3 coding variants in lupus patients impair B cell tolerance and predispose to autoimmunity

Affiliations

Rare SH2B3 coding variants in lupus patients impair B cell tolerance and predispose to autoimmunity

Yaoyuan Zhang et al. J Exp Med. .

Abstract

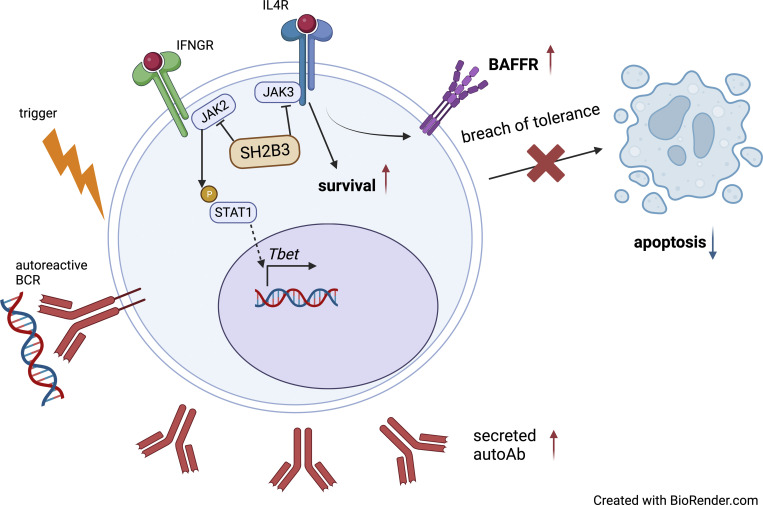
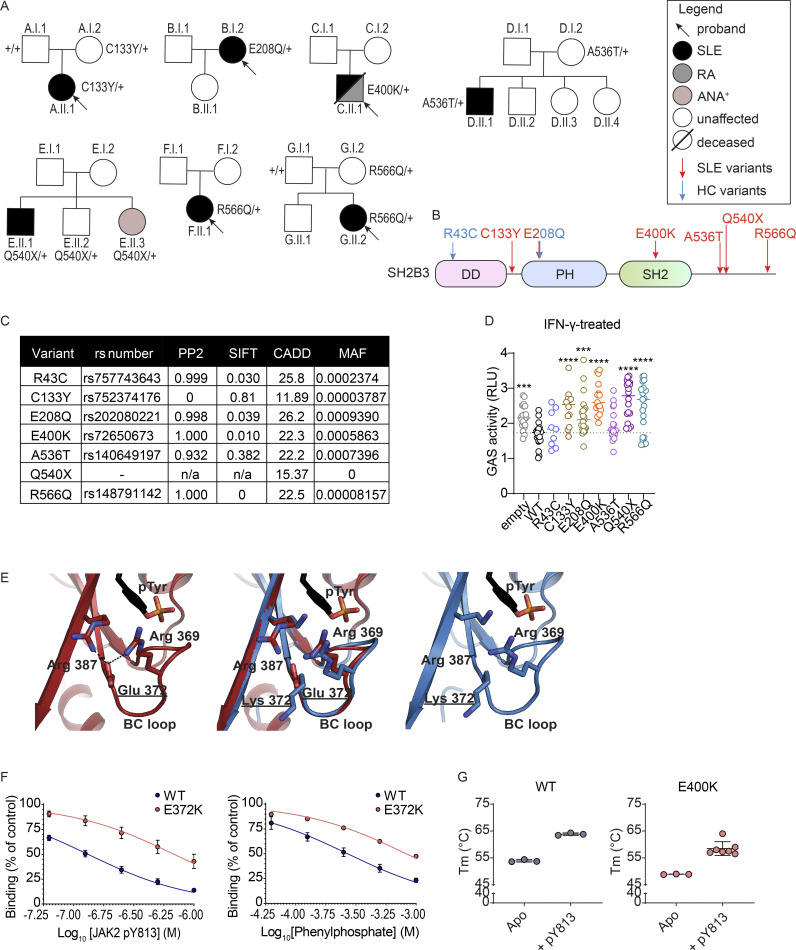
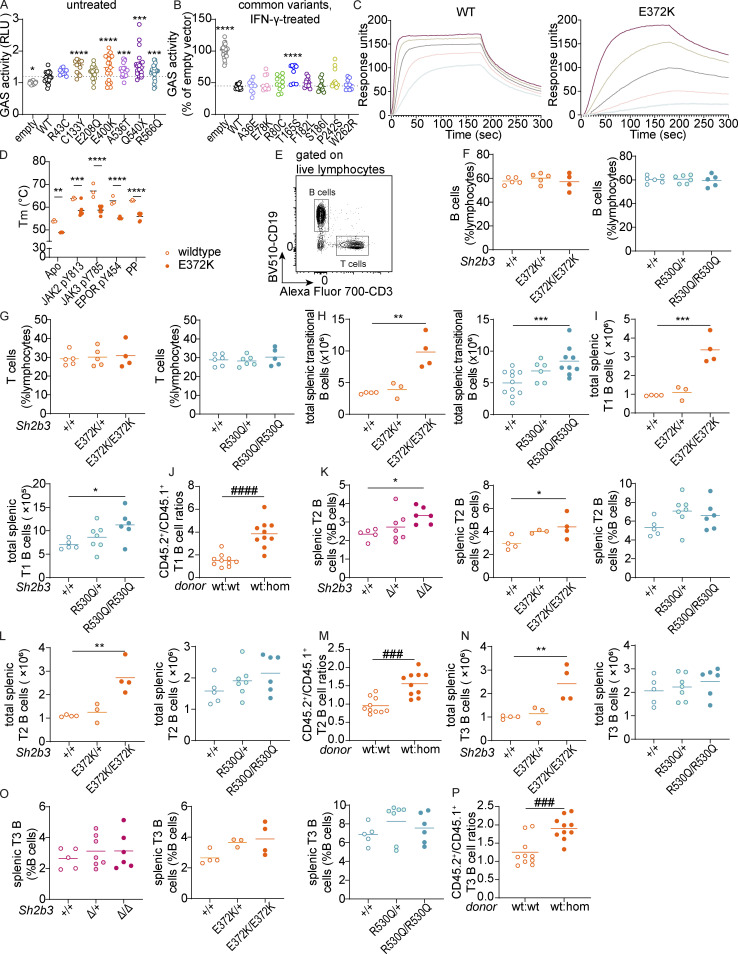
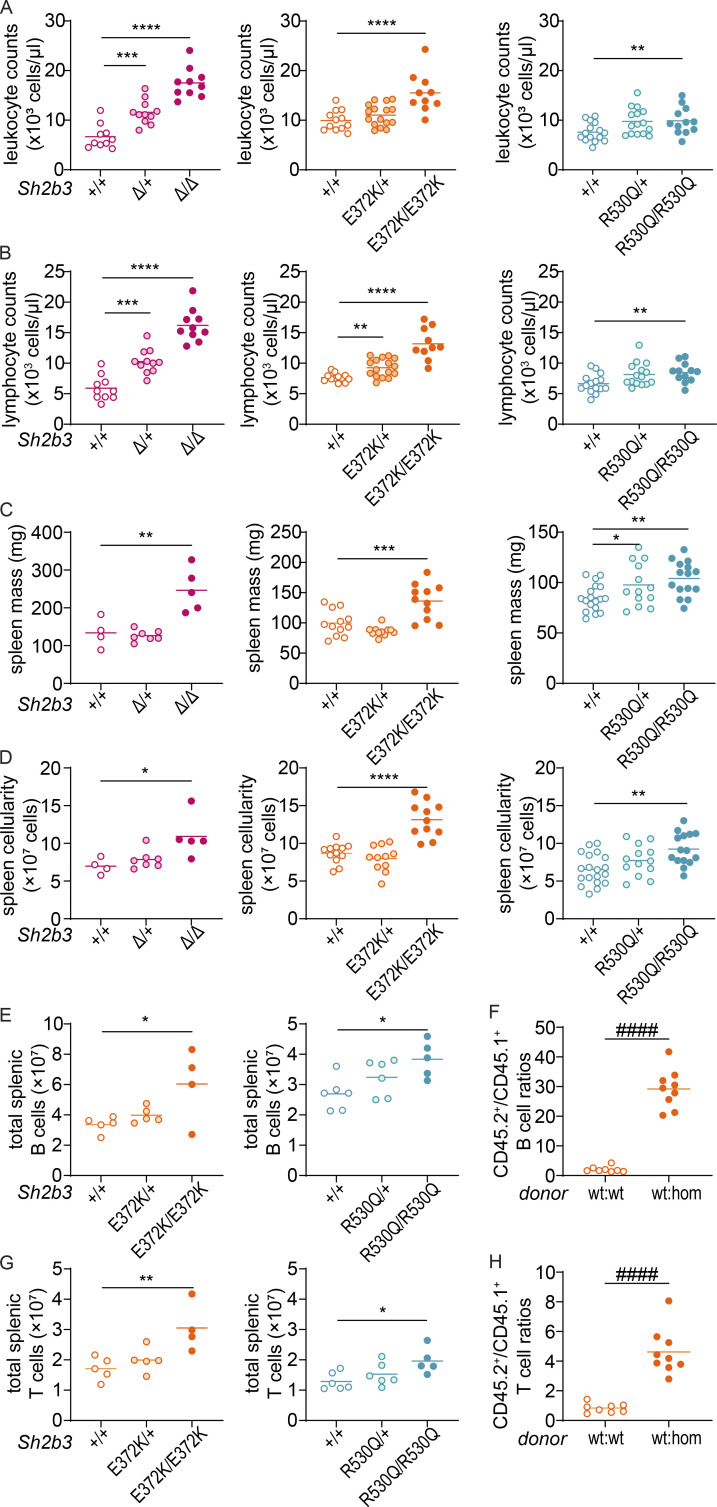
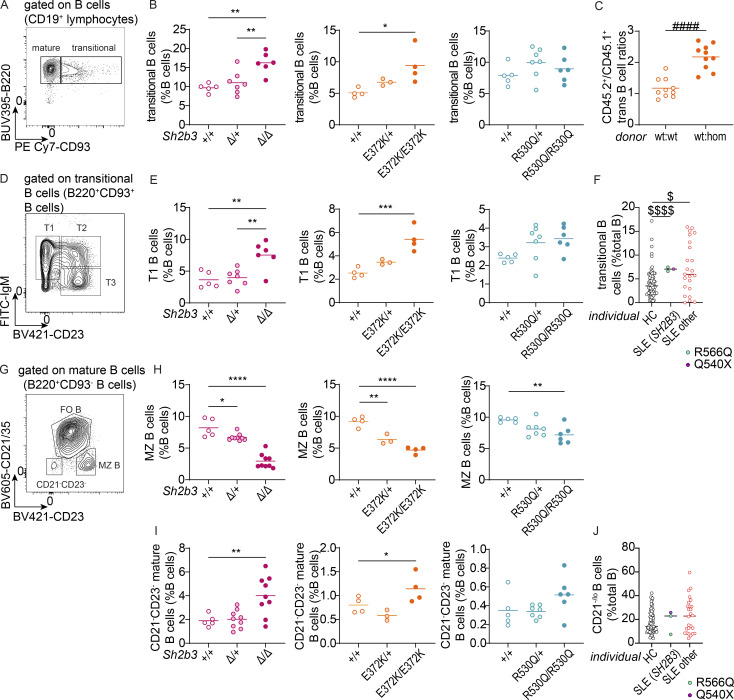
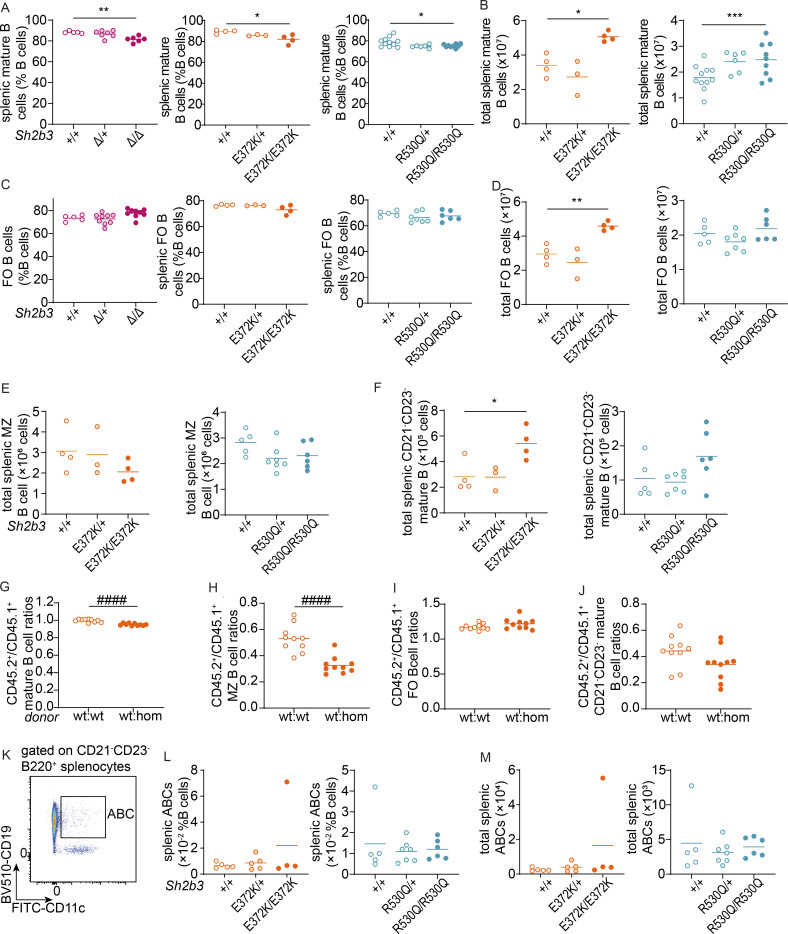
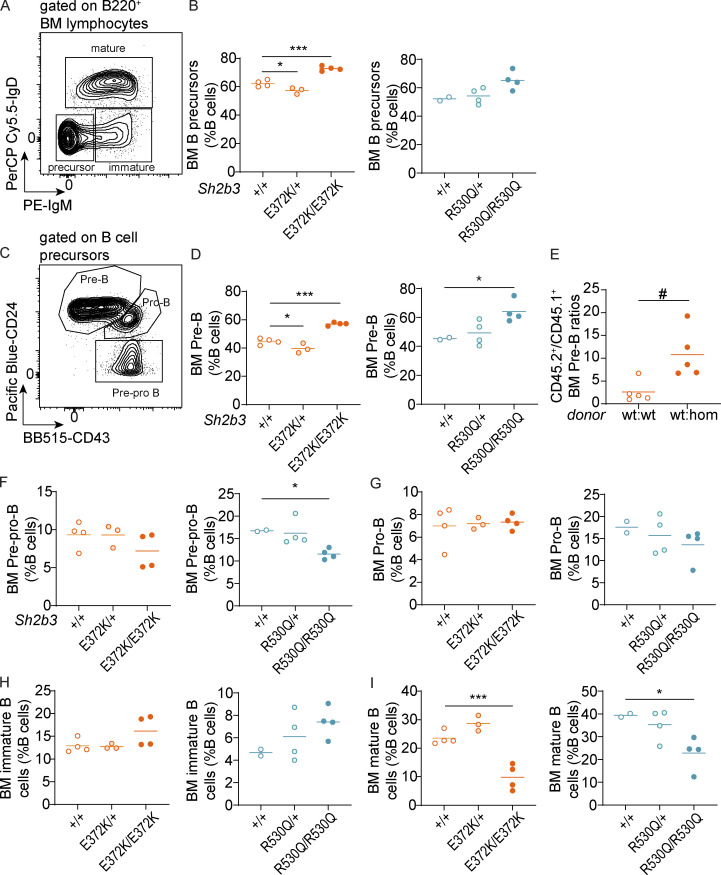
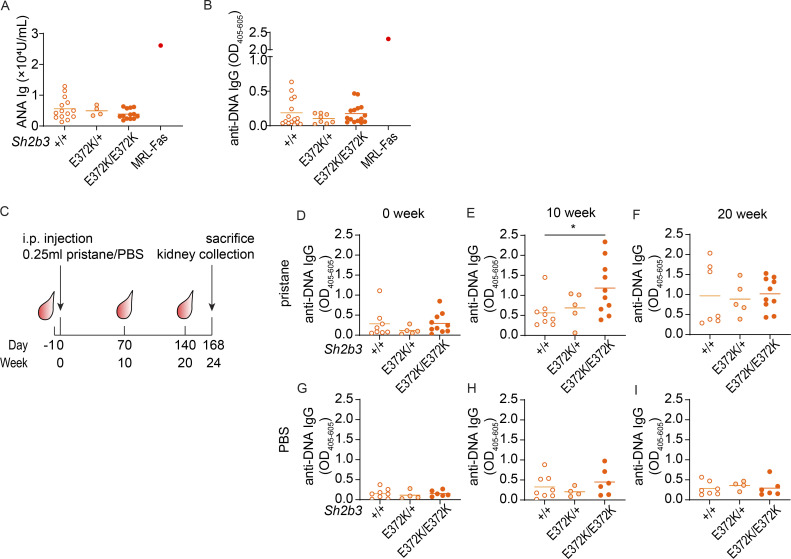
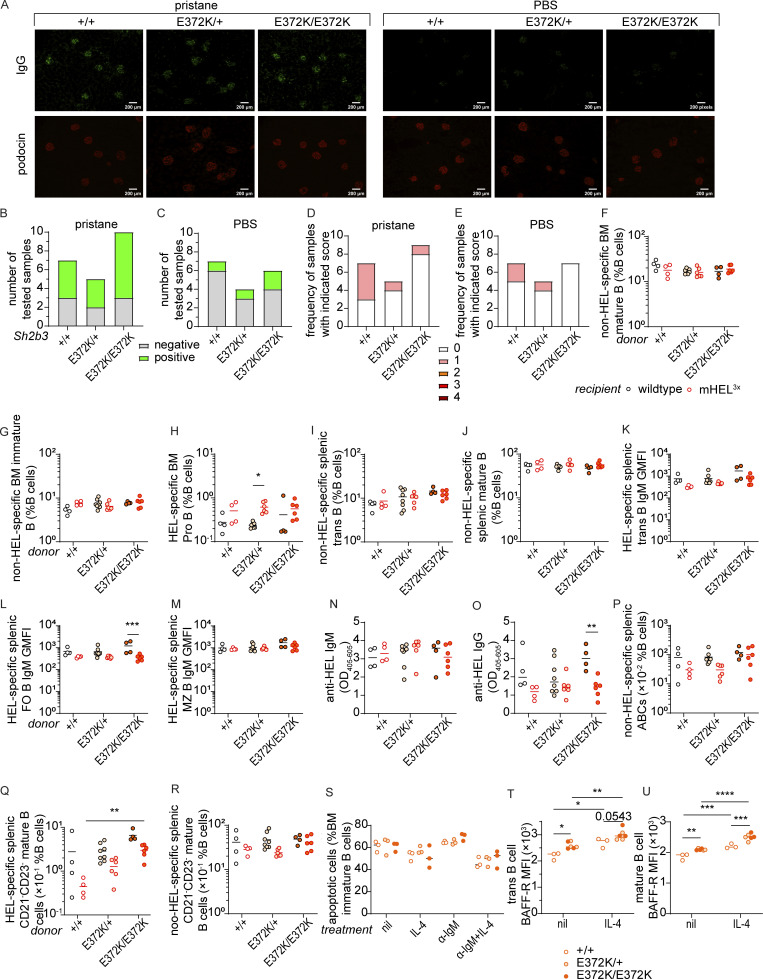
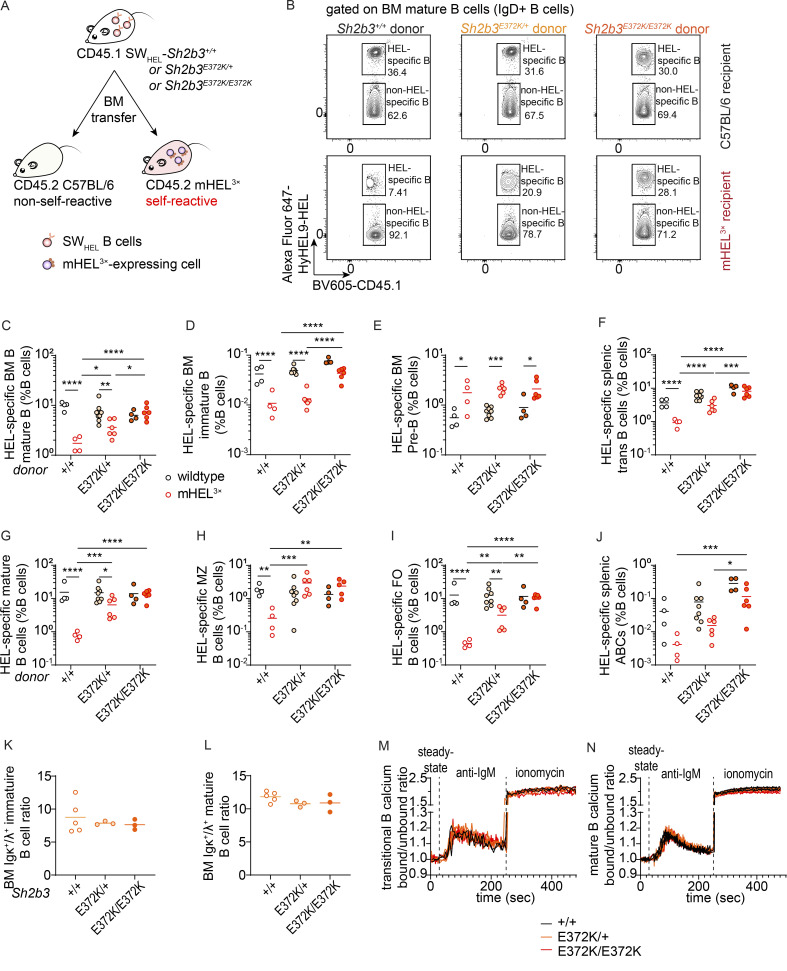
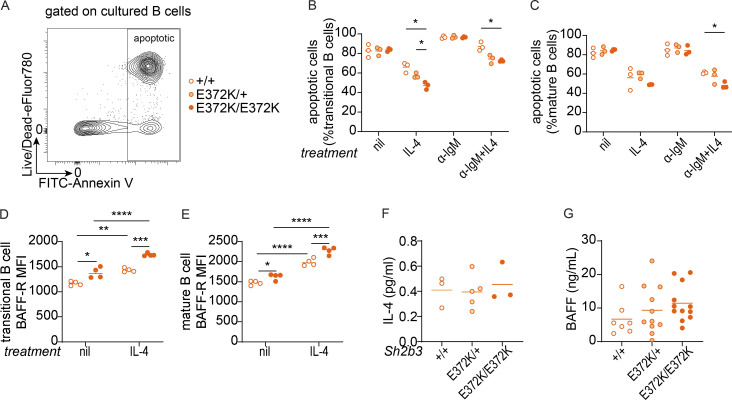
Systemic lupus erythematosus (SLE) is a heterogeneous autoimmune disease with a clear genetic component. While most SLE patients carry rare gene variants in lupus risk genes, little is known about their contribution to disease pathogenesis. Amongst them, SH2B3-a negative regulator of cytokine and growth factor receptor signaling-harbors rare coding variants in over 5% of SLE patients. Here, we show that unlike the variant found exclusively in healthy controls, SH2B3 rare variants found in lupus patients are predominantly hypomorphic alleles, failing to suppress IFNGR signaling via JAK2-STAT1. The generation of two mouse lines carrying patients' variants revealed that SH2B3 is important in limiting the number of immature and transitional B cells. Furthermore, hypomorphic SH2B3 was shown to impair the negative selection of immature/transitional self-reactive B cells and accelerate autoimmunity in sensitized mice, at least in part due to increased IL-4R signaling and BAFF-R expression. This work identifies a previously unappreciated role for SH2B3 in human B cell tolerance and lupus risk.


Conflict of interest statement

Disclosures: J.C. Lee reported grants from GSK and personal fees from PredictImmune, C4X Discovery, AGPLUS Diagnostics, and Abbvie outside the submitted work. S.L. Masters is a scientific advisor for Odyssey Therapeutics and NRG Therapeutics. No other disclosures were reported.

Figures

None
Graphical abstract
Figure 1.
Figure 1.
Rare SH2B3 variants were identified in SLE patients and HCs. (A) Pedigrees of families with rare single nucleotide variants (SNV) in SH2B3 associated with autoimmunity. Black arrows indicate the proband of each cohort. Individuals colored black are affected by SLE, and individuals colored gray are affected by RA. The amino acid changes in SH2B3 protein are shown next to sequenced individuals, with “+” sign indicating WT. (B) Location of patient-specific and HC SNVs in the schematic diagram of SH2B3 amino acid sequence. DD: dimerization domain, SH2: Src homology 2 domain, PH: Pleckstrin homology domain. (C) Summary of variant information, in silico deleteriousness prediction, and MAF of each SNV from HC and SLE patients. PP2: PolyPhen-2. (D) Relative activity of STAT1-GAS in HEK293 cells overexpressing empty vector, WT, or mutant human SH2B3 in the presence of IFN-γ (50 ng/ml) stimulation. Relative activity was calculated by normalizing all STAT1-GAS-Firefly/CMV-Renilla ratios to the average ratios in the unstimulated cells transfected with empty vectors. Results were pooled from seven independent experiments. Sample numbers for each condition are listed as follows: empty (n = 21), WT (n = 21), R43C (n = 9), C133Y (n = 12), E208Q (n = 21), E400K (n = 15), A536T (n = 18), Q540X (n = 18), and R566Q (n = 21). Means are shown as bars, and all conditions were compared with cells transfected with WT SH2B3. lmer with emmeans using the experiment as the blocking factor was used for the statistical analyses. ***: P < 0.001, ****: P < 0.0001. (E) Hydrogen bonding network between Arg369-Glu372-Arg387 (left) that helps position the BC loop relative to the central β-sheet and disrupted hydrogen bond formation (right) when Glu372 is replaced with Lys. (F) Percentage of binding of murine WT or E372K SH2B3 to IL6ST pY757 peptide chip after preincubation with varying concentrations of mutant JAK pY813 peptides (left; WT n = 8, E372K: n = 6) or phenylphosphate (right; WT: n = 4, E372K: n = 2). Data are shown as the mean ± SD of technical replicates from at least three independent experiments. (G) Melting temperatures of WT (left) and E400K (right) SH2B3 protein at apo state (unbound) or bound to pY813 JAK2. Data are displayed as the mean ± SD of technical replicates from at least three independent experiments. WT Apo, WT + pY813, and E400K Apo: n = 3; E400K pY813: n = 7.
Figure S1.
Figure S1.
Human and murine SH2B3 protein functionality and gross phenotypes of Sh2b3Δ, Sh2b3E372K, and Sh2b3R530Q mice and transitional B cell phenotypes in Sh2b3E372K and Sh2b3R530Q mice, and chimeras of Sh2b3E372K mice. (A) Relative GAS activity of unstimulated HEK293 cells overexpressing WT or SH2B3 variants identified in SLE and HC cohorts. Sample numbers for each condition are listed as follows: empty (n = 21), WT (n = 21), R43C (n = 9), C133Y (n = 12), E208Q (n = 21), E400K (n = 15), A536T (n = 18), Q540X (n = 18), and R566Q (n = 21). Means are shown as bars, and all conditions were compared to cells transfected with WT SH2B3. lmer with emmeans using the experiment as a blocking factor was used for the statistical analyses. *: P < 0.05, ***: P < 0.001, ****: P < 0.0001. (B) Relative GAS activity of HEK293T cells overexpressing WT or SH2B3 variants listed in gnomAD database at MAF > 0.001 in the presence of IFN-γ (50 ng/ml) stimulation. Results are pooled from four independent experiments and shown as the percentage of GAS activity compared to the EV control. Each dot is a biological replicate and the mean of three technical replicates. Sample numbers for each condition are listed as follows: empty (n = 30), WT (n = 11), W262R (n = 9), T165S (n = 9), F182L (n = 12), S186I (n = 12), P242S (n = 12), R80C (n = 12), A36E (n = 9), E78K (n = 9). lmer with emmeans using the experiment as the blocking factor was used for the statistical analyses. ****: P < 0.0001. (C) Representative direct binding curves for the WT and E372K SH2B3 SH2 domains to a JAK2 pY813 peptide. Results are representative of two independent experiments. (D) Melting temperatures for WT (unfilled) and E372K (filled) SH2B3 SH2 domains in their apo form and after the addition of the phosphomimetic phenyl phosphate (PP), JAK2 pY813, JAK3 pY785, and EPOR pY454 peptides. Results are pooled from at least three independent experiments. All WT: n = 3; E372K: apo n = 3, JAK2 n = 7, JAK3 n = 6, EPOR n = 4, PP n = 6. Means are shown as bars. Two-way ANOVA with Šídák’s adjustment was used for statistical analyses. *: P < 0.05, **: P < 0.01, ***: P < 0.001, ****: P < 0.0001. (E) Representative flow cytometric plot showing the gating strategy of B cells (CD19+CD3) and T cells (CD19CD3+). (F and G) Dot plots showing frequencies of B (F) and T cells (G) as percentages of total splenic lymphocytes in Sh2b3E372K (left panel) and Sh2b3R530Q (right panel) mice. (H and I) Total numbers of splenic transitional B cells (H) and T1 B cells (I) in Sh2b3E372K (left) and Sh2b3R530Q (right) mice. (J) CD45.2+/CD45.1+ T1 B cell ratios among splenic B cells in 50:50 BM chimeras of CD45.1-Sh2b3+/+ and CD45.2-Sh2b3+/+/Sh2b3E372K/E372K mice. (K) Frequencies of T2 B cells as percentages of splenic B cells in Sh2b3Δ (left), Sh2b3E372K (middle), and Sh2b3R530Q (right) mice. (L) Total numbers of splenic T2 B cells in Sh2b3E372K (left) and Sh2b3R530Q (right) mice. (M) CD45.2+/CD45.1+ T2 B cell ratios among splenic B cells in 50:50 BM chimeras of CD45.1-Sh2b3+/+ and CD45.2-Sh2b3+/+/Sh2b3E372K/E372K mice. (N) Total numbers of splenic T3 B cells in Sh2b3E372K (left), and Sh2b3R530Q (right) mice. (O) Frequencies of of splenic T3 B cells in Sh2b3Δ (left), Sh2b3E372K (middle), and Sh2b3R530Q (right) mice. (P) Frequencies of (P) CD45.2+/CD45.1+ T3 B cell ratios among splenic B cells in 50:50 BM chimeras of CD45.1-Sh2b3+/+ and CD45.2-Sh2b3+/+/Sh2b3E372K/E372K mice. Results in F–P are representative of two to three independent experiments. Each dot represents one mouse. Sample numbers for each group in F–I, K, L, N, and O are listed as follows: Sh2b3Δ panel: +/+ (n = 5), Δ/+ (n = 7), Δ/Δ (n = 6); Sh2b3E372K panel: +/+ (n = 5 in F and G, n = 4 in others), E372K/+ (n = 5 in F and G, n = 3 in others), E372K/E372K (n = 4); Sh2b3R530Q panels: +/+ (n = 6 in F and G, n = 5 in others), R530Q/+ (n = 6 in F–H, n = 7 in others), and R530Q/R530Q (n = 5–9). n = 10 in J and P. Means are indicated as bars. Student’s t tests were used for the statistical analysis in J, M, and P. One-way ANOVA was used for the statistical analyses in F–I, K, L, N, and O. Significance levels in lmer ANOVAs are indicated with asterisks, while those in multiple Student’s t tests are indicated with hashes. *: P < 0.05, **: P < 0.01, ***/###: P < 0.001, ****/####: P < 0.0001.
Figure 2.
Figure 2.
Gross phenotypes of Sh2b3Δ, Sh2b3E372K, and Sh2b3R530Q mice. (A and B) Peripheral blood leukocyte (A) and lymphocyte (B) counts determined by ADVIA hematological analyzer. Each dot represents one mouse. Sh2b3Δ panels: +/+ (n = 10), Δ/+ (n = 11), Δ/Δ (n = 10); Sh2b3E372K panels: +/+ (n = 12), E372K/+ (n = 16), E372K/E372K (n = 10); Sh2b3R530Q panels: +/+ (n = 15), R530Q/+ (n = 15), R530Q/R530Q (n = 12). (C and D) Spleen mass (C) and cellularity (D). Each dot represents one mouse. Sh2b3Δ panels: +/+ (n = 4), Δ/+ (n = 7), Δ/Δ (n = 5); Sh2b3E372K panels: +/+ (n = 12), E372K/+ (n = 11), E372K/E372K (n = 11); Sh2b3R530Q panels: +/+ (n = 19), R530Q/+ (n = 13), R530Q/R530Q (n = 15). Results in A–D were pooled from two to four independent experiments. Means are shown as bars. The statistical comparison was performed using lmer model ANOVA with multiple comparisons and Tukey’s correction. *: P < 0.05, **: P < 0.01, ***: P < 0.001, ****: P < 0.0001. (E and G) Total splenic B cells (E) and T cells (G) in Sh2b3E372K and Sh2b3R530Q mice. Each dot represents one mouse. Sh2b3E372K panels: +/+ (n = 5), E372K/+ (n = 5), E372K/E372K (n = 4); Sh2b3R530Q panels: +/+ (n = 6), R530Q/+ (n = 6), R530Q/R530Q (n = 5). Results are representative of two independent experiments. Means are shown as bars. Statistical comparison was performed using one-way ANOVA with multiple comparison and Dunnett’s correction. *: P < 0.05, **: P < 0.01. (F and H) Ratios of CD45.2+/CD45.1+ B cell percentages (F) and T cells (H) in the spleens of 50:50 BM chimeras from CD45.1-Sh2b3+/+ and CD45.2-Sh2b3+/+ (n = 8) or Sh2b3E372K/E372K (n = 9) mice. Each dot represents one mouse. Results are representative of two independent experiments. Statistical comparison performed using Student’s t test; ####: P < 0.0001.
Figure 3.
Figure 3.
B cell phenotypes in the spleens of Sh2b3Δ, Sh2b3E372K, and Sh2b3R530Q mice, and peripheral blood of SLE patients carrying SH2B3 variants R566Q and Q540X. (A) Representative flow cytometric plot showing the gating of mature (B220+CD93) and transitional (B220+CD93+) B cells. (B) Dot plots showing the percentages of splenic transitional B cells in Sh2b3Δ (left), Sh2b3E372K (middle), and Sh2b3R530Q (right) mice. (C) Ratios of CD45.2+/CD45.1+ transitional B cell percentages in the spleens of 50:50 BM chimeras from CD45.1-Sh2b3+/+ and CD45.2-Sh2b3+/+ (n = 10) or Sh2b3E372K/E372K (n = 10) mice. Student’s t test was used for statistical analysis. ####: P < 0.0001. Results are representative of two independent experiments. (D) Representative flow cytometric plot showing the gating of T1 (IgM+CD23), T2 (IgM+CD23+) and T3 (IgMCD23+) B cells. (E) Dot plots showing the percentages of splenic T1 B cells in Sh2b3Δ (left), Sh2b3E372K (middle), and Sh2b3R530Q (right) mice. (F) Percentages of human transitional B cells in the peripheral blood of HCs (n = 77), SLE patients carrying SH2B3 variants (R566Q in turquoise, n = 2, and Q540X in purple, n = 1) and other SLE patients (n = 23). (G) Representative flow cytometric plot showing the gating of CD21CD23 mature B cells and MZ B cells (CD21/35CD23+). (H) Dot plots showing the frequencies of MZ B cells as percentages of total splenic B cells in Sh2b3Δ (left), Sh2b3E372K (middle), and Sh2b3R530Q (right) mice. (I) Frequencies of CD21CD23 mature B cells as percentages of total splenic B cells in Sh2b3Δ (left), Sh2b3E372K (middle), and Sh2b3R530Q (right) mice. (J) Percentages of human CD21lo/− B cells in the peripheral blood of HCs (n = 77), SLE patients carrying SH2B3 variants (R566Q in turquoise, n = 2, and Q540X in purple, n = 1), and other SLE patients (n = 23). For panels B, E, H, and I, sample numbers are listed as follows: Sh2b3Δ panels: +/+ (n = 5), Δ/+ (n = 7 in B and E, n = 9 in H and I), Δ/Δ (n = 6 in B and E, n = 9 in H and I); Sh2b3E372K panels: +/+ (n = 4), E372K/+ (n = 3), E372K/E372K (n = 4); Sh2b3R530Q panels: +/+ (n = 5), R530Q/+ (n = 7), R530Q/R530Q (n = 6). Each dot represents one mouse, and means are shown as bars. Results are representative of three independent experiments. One-way ANOVA with multiple comparison and Dunnett’s correction was used for statistical analysis. Significance levels are indicated with asterisks. For panels F and J: Brown–Forsythe and Welch ANOVA tests were used for statistical analysis. Dollar signs are used to indicate significance levels. Significance level criteria are described as follows: */$: P < 0.05, **: P < 0.01, ***: P < 0.001, ****/####/$$$$: P < 0.0001.
Figure S2.
Figure S2.
Mature B cell phenotypes in Sh2b3Δ, Sh2b3E372K, and Sh2b3R530Q mice, and chimeras of Sh2b3E372K mice. (A) Frequencies of mature B cells as percentages of splenic B cells. (B) Total numbers of splenic mature B cells. (C) Frequencies of FO B cells as percentages of splenic B cells. (D) Total splenic FO B cells. (E and F) Total splenic MZ B cells (E) and CD21CD23 mature B cells (F). Each dot represents one mouse. Sample numbers for each group in A–F are listed as follows: Sh2b3Δ panels: +/+ (n = 5), Δ/+ (n = 7), Δ/Δ (n = 6); Sh2b3E372K panels: +/+ (n = 4), E372K/+ (n = 3), E372K/E372K (n = 4); Sh2b3R530Q panels: +/+ (n = 5–11), R530Q/+ (n = 6–7), R530Q/R530Q (n = 6–9). Means are shown as bars. One-way ANOVA was used for statistical analysis. (G–J) CD45.2+/CD45.1+ ratios of frequencies of splenic mature B cells (G), MZ B cells (H), FO B cells (I), and CD21/35CD23 mature B cells (J) in 50:50 BM chimeras of CD45.1-Sh2b3+/+ and CD45.2-Sh2b3+/+ (n = 10) or Sh2b3E372K/E372K (n = 10) mice. Statistical analysis was performed using Student’s t test. Results are representative of two independent experiments. (K) Representative flow cytometric plot of splenic ABCs (B220+CD21/35CD23CD11c+CD19+). (L and M) Frequencies (L) and total numbers (M) of splenic ABCs. Each dot represents one mouse. Sample numbers for each group in L and M are listed as follows: Sh2b3E372K panels: +/+ (n = 4), E372K/+ (n = 5), E372K/E372K (n = 4); Sh2b3R530Q panels: +/+ (n = 5–11), R530Q/+ (n = 7), R530Q/R530Q (n = 6). Results are representative of two to three independent experiments. Means are shown as bars. One-way ANOVA was used for statistical analysis of immunophenotyping data (A–F, L, and M), while Student’s t test was used for analyzing data from BM chimera experiments (G–J). Significance levels of one-way ANOVAs are indicated with asterisks, while those of Student’s t tests are indicated with hashes. Significance level criteria are indicated as follows: *: P < 0.05, **: P < 0.01, ***: P < 0.001, ####: P < 0.0001.
Figure S3.
Figure S3.
BM B cell phenotypes in Sh2b3E372K and Sh2b3R530Q mice. (A–I) BM B cell phenotypes. (A) Representative flow cytometric plot showing the gating of B cell precursors (IgMIgD), immature (IgM+IgD), and mature (IgD+) B cells. Cells were pregated on B220+ lymphocytes. (B) Frequencies of B cell precursors as percentages of BM B cells. (C) Representative flow cytometric plot showing the gating of pre-pro (CD24CD43+), pro- (CD24hiCD43+), and pre-B cells (CD24+CD43−/lo). Frequencies of pre-B cells as percentages of BM B cells in (D) Sh2b3E372K (left) and Sh2b3R530Q (right) mice and (E) 50:50 BM chimeras of CD45.1-Sh2b3+/+ and CD45.2-Sh2b3+/+/Sh2b3E372K/E372K mice (n = 5). Frequencies of (F) pre-pro and (G) pro-, (H) immature, and (I) mature cells as percentages of BM B cells. Lines in all dot plots show means, and results are representative of two independent experiments. Each dot represents one mouse, and sample numbers for each group in B, D, and F–M are listed as follows: Sh2b3E372K panels: +/+ (n = 4), E372K/+ (n = 3), E372K/E372K (n = 4); Sh2b3R530Q panels: +/+ (n = 2), R530Q/+ (n = 4), R530Q/R530Q (n = 4). One-way ANOVA was used for statistical analysis of immunophenotyping data (B, D, and F–M), and Student’s t test was used for analyzing data from BM chimera experiments (E). Significance levels of one-way ANOVAs are indicated with asterisks, while those of Student’s t tests are indicated with hashes. Significance level criteria are indicated as follows: */#: P < 0.05, ***: P < 0.001.
Figure S4.
Figure S4.
Peripheral blood and splenic T cell phenotypes in Sh2b3E372K and Sh2b3R530Q mice. (A) Representative flow cytometric plot showing the gating of double-negative (DN; CD4CD8), CD4+ (CD4+CD8), and CD8+ (CD4CD8+) T cells. (B and C) Dot plots showing the ratios of (B) blood and (C) splenic CD4/CD8 T cells in Sh2b3E372K mice and splenic CD4/CD8 T cells in Sh2b3R530Q mice. (D) Frequencies of DN T cells in the peripheral blood of Sh2b3E372K mice. (E) Representative flow cytometric plot showing the gating of CD4 naïve T (Tnaïve: CD44lo/−Foxp3), TEM (CD44hiFoxp3), and Treg (Foxp3+) cells. (F and G) Frequencies (F) and total numbers (G) of CD4 TEM cells in the spleens of Sh2b3E372K and Sh2b3R530Q mice. (H and I) Frequencies (H) and total numbers (I) of Treg cells in the spleen of Sh2b3E372K (left) and Sh2b3R530Q (right) mice. (J) Percentage suppression of effector T cells (Teff) by Treg cells in culture at various Teff/Treg ratios by using Treg cells sorted from the spleens of Sh2b3+/+ (n = 3), Sh2b3E372K/+ (n = 3), and Sh2b3E372K/E372K (n = 4) mice. (K) Representative flow cytometric plot showing the gating of CD8 Tnaïve (CD44lo/−CCR7lo) and TEM (CD44hiCCR7) cells. (L and M) Frequencies of (L) peripheral blood and (M) splenic CD8 TEM cells in Sh2b3E372K and Sh2b3R530Q mice. (N) Total numbers of splenic CD8 TEM in Sh2b3E372K, and Sh2b3R530Q mice. (O–T) Ratios of CD45.2+/CD45.1 (O) splenic and (P) peripheral blood CD4/CD8 T ratios, (Q) peripheral blood DN T cells, (R) splenic TEM cells, (S) Treg cells, and (T) peripheral blood CD8 TEM cells in 50:50 BM chimeras of CD45.1-Sh2b3+/+ and CD45.2-Sh2b3+/+/Sh2b3E372K/E372K mice (n = 8). Results in B–D, F–J, L–N, and S are representative of two independent experiments. Results in O–R and T are from a single experiment. Each dot represents one mouse, and sample numbers for each group in B–D, F–J, and L–N are listed as follows: Sh2b3E372K panels: +/+ (spleen: n = 5, blood: n = 7), E372K/+ (spleen: n = 5, blood: n = 11), E372K/E372K (spleen: n = 4, blood: n = 9); Sh2b3R530Q panels: +/+ (spleen: n = 6, blood: n = 12), R530Q/+ (spleen: n = 6, blood: n = 8), R530Q/R530Q (spleen: n = 5, blood: n = 9). One-way ANOVA was used for statistical analysis of immunophenotyping data (B–D, F–I, and L-N), while Student’s t test was used for analyzing data from BM chimera experiments (O–T). Significance levels of one-way ANOVAs are indicated with asterisks as follows: *: P < 0.05, **: P < 0.01, ***: P < 0.001, ****: P < 0.0001.
Figure 4.
Figure 4.
Autoimmune triggers induced exacerbated autoimmunity in Sh2b3E372K mice. (A and B) Serum ANAs (A; +/+: n = 14, E372K/+: n = 4, E372K/E372K: n = 13) and anti-DNA IgG (B; +/+: n = 15, E372K/+: n = 8, E372K/E372K: n = 15) determined by ELISA. One-way ANOVA was used for statistical analyses. Results are pooled from two to four separate mouse cohorts and representative to two independent experiments. (C) Experimental plan of pristane-induced lupus-like autoimmune model in Sh2b3E372K mice. 14-wk-old female Sh2b3E372K mice were bled 1 day before the IP injection of 0.25-ml pristane or PBS (control) and later 2-, 10-, and 20-wk after injection and sacrificed 24-wk after injection for spleen and kidney analysis. (D–I) Levels of serum anti-DNA IgG in pristane-treated mice at 0 (D), 10 (E), and 20 (F) weeks after treatment, and PBS-treated mice at 0 (G), 10 (H), and 20 (I) weeks after treatment. Means are shown as bars in all dot plots. Data were pooled from two independent experiments, +/+: n = 8, E372K: n = 5, E372K/E372K: n = 11. Statistical analyses performed using lmer ANOVA; *: P < 0.05.
Figure S5.
Figure S5.
Spontaneous autoimmunity and B cell tolerance in Sh2b3E372K mice. (A–C) IgG immune-complex deposits in mice treated with PBS or pristane. (A) Representative IF images showing IgG (green) and podocin (red) staining in the kidney sections of pristane/PBS-treated Sh2b3E372K mice 20 wk following treatment with pristane and PBS. (B and C) Numbers of kidney sections that are positive and negative for IgG ICs in the glomeruli of Sh2b3E372K mice treated with (B) pristane (+/+: n = 7, E372K/+: n = 5, E372K/E372K: n = 10) and (C) PBS (+/+: n = 7, E372K/+: n = 4, E372K/E372K: n = 6). (D and E) Numbers of kidney sections with indicated glomerular score 20 wk following treatment with (D) pristane (+/+: n = 7, E372K/+: n = 5, E372K/E372K: n = 9) and (E) PBS (+/+: n = 7, E372K/+: n = 5, E372K/E372K: n = 7). (F–R) Cellular and serological phenotypes of SWHEL-mHEL chimeric mice. Mouse numbers for each group are listed as follows: +/+ WT (n = 4), +/+ mHEL (n = 4), E372K/+ WT (n = 8), E273K/+ mHEL (n = 6), E372K/E372K WT (n = 4), and E372K/E372K mHEL3× (n = 6). Frequencies of non-HEL-specific BM (F) mature and (G) immature B cells, (H) HEL-specific pro-B cells, non-HEL-specific splenic (I) transitional and (J) mature B cells, relative surface IgM expression on HEL-specific splenic (K) transitional, (L) FO, and (M) MZ B cells in WT (black circles) or mHEL (red circles) recipients receiving BM from SWHEL-Sh2b3+/+ (unfilled), SWHEL-Sh2b3E372K/+ (yellow filling), or SWHEL-Sh2b3E372K/E372K (orange filling) donors. Levels of anti-HEL (N) IgM and (O) IgG in WT and mHEL mice receiving BM from SWHEL-Sh2b3+/+, -Sh2b3E372K/+ and, -Sh2b3E372K/E372K donors measured as OD405–605 by ELISA. Frequencies of (P) non-HEL-specific ABCs, (Q) HEL-specific and (R) non-HEL-specific CD21CD23 mature B cells as percentages of splenic lymphocytes. (S) Percentages of apoptotic BM immature B cells in untreated, 20 ng/ml IL-4 only, 5 μg/ml anti-IgM (α-IgM) only, and 5 μg/ml α-IgM + 20 ng/ml IL-4 conditions (n = 3). (T and U) BAFF-R surface expression on (T) transitional and (U) mature B cells measured by flow cytometry as median fluorescence intensity (MFI) (n = 3). Data in A–E is pooled from two independent experiments. Results in F–U are representative of two to three independent experiments. Fisher’s exact test was used for the statistical analyses in B–E. Means in F–U are shown as bars, and two-way ANOVA was used for statistical analysis in F–U. Significance levels for two-way ANOVAs are indicated with asterisks. *: P < 0.05, **: P < 0.01, ***: P < 0.001, ****: P < 0.0001.
Figure 5.
Figure 5.
B cell tolerance breach in Sh2b3E372K mice. (A) Design of SWHEL-mHEL BM chimera experiment for assessing B cell tolerance in Sh2b3+/+, Sh2b3E372K/+, and Sh2b3E372K/E372K mice. (B) Representative flow cytometric plots showing the gating of HEL-specific (self-reactive) and non-HEL-specific (non-self-reactive) BM mature B cells in WT or mHEL mice receiving BM from SWHEL-Sh2b3+/+, SWHEL-Sh2b3E372K/+, or SWHEL-Sh2b3E372K/E372K donors. (C–J) Dot plot demonstrating the frequencies of HEL-specific (C) BM mature B cells (D) BM immature B cells, (E) BM pre-B cells, (F) splenic transitional B cells, (G) splenic mature B cells, and (H) splenic MZ B cells, (I) splenic FO B cells, and (J) splenic ABCs as percentages of total lymphocytes in WT or mHEL recipient mice receiving BM from SWHEL-Sh2b3+/+, SWHEL-Sh2b3E372K/+, or SWHEL-Sh2b3E372K/E372K mice. +/+ WT (n = 4), +/+ mHEL (n = 4), E372K/+ WT (n = 8), E372K/+ mHEL (n = 6), E372K/E372K WT (n = 4), E372K/E372K mHEL (n = 6). Means are shown as bars. Results are representative of two independent experiments. Two-way ANOVA was performed on log10-transformed data to meet the variance homoscedasticity; *: P < 0.05, **: P < 0.01, ***: P < 0.001, ****: P < 0.0001. (K–L) Ratios of BM Igκ+/Igλ+ (K) immature and (L) mature B cells in Sh2b3E372K mice (+/+: n = 5, E372K/+: n = 3, E372K/E372K: n = 3). Means are shown as bars in C–L. One-way ANOVA was used for statistical analysis. Results are representative of two independent experiments. (M and N) Calcium influx into the cytoplasm of peripheral blood (M) transitional and (N) mature B cells of Sh2b3E372K mice (+/+: n = 2, E372K/+: n = 3, E372K/E372K: n = 3) at steady state, following treatment with anti-IgM antibody and treatment with ionomycin measured by the ratios of bound/unbound indo-1 AM ester to Ca2+. Results are representative of two independent experiments.
Figure 6.
Figure 6.
IL-4R and BAFF-R signaling in the survival in IgM-crosslinked splenic B cells of Sh2b3+/+, Sh2b3E372K/+, and Sh2b3E372K/E372K mice. (A) Representative flow cytometry plot showing the gating strategy of apoptotic (Annexin+7-AAD−/+) cultured, sorted splenic B cells. (B and C) Frequencies of apoptotic transitional (B) and mature B cells (C) in untreated, 20 ng/ml IL-4 only, 5 μg/ml anti-IgM (α-IgM) only, and 5 μg/ml α-IgM + 20 ng/ml IL-4 conditions (n = 3 in each group). Two-way ANOVA with Šídák’s adjustment was used for statistical analyses; *: P < 0.05. (D and E) BAFF-R expression was measured by GMFI in transitional (D) and mature (E) B cells in untreated or 20 ng/ml IL-4 conditions (n = 4 in each group). Two-way ANOVA with Šídák’s adjustment was used for statistical analyses. *: P < 0.05, **: P < 0.01, ***: P < 0.001, ****: P < 0.0001. Results are representative of three independent experiments. (F) Plasma IL-4 measured by Meso Scale Discovery assay (+/+: n = 3, E372K/+: n = 5, E372K/E372K: n = 3). One-way ANOVA was used for statistical analyses. Results are from a single experiment. (G) Serum BAFF measured by bead-based immunoassay (+/+: n = 7, E372/+: n = 11, E372K/E372K: n = 12). Results are pooled from two independent experiments. One-way ANOVA was used for statistical analyses.

References

    1. Ackman, R.G. 1971. Pristane and other hydrocarbons in some freshwater and marine fish oils. Lipids. 6:520–522. 10.1007/BF02531239 - DOI - PubMed
    1. Adachi, M., Suematsu S., Suda T., Watanabe D., Fukuyama H., Ogasawara J., Tanaka T., Yoshida N., and Nagata S.. 1996. Enhanced and accelerated lymphoproliferation in Fas-null mice. Proc. Natl. Acad. Sci. USA. 93:2131–2136. 10.1073/pnas.93.5.2131 - DOI - PMC - PubMed
    1. Alcina, A., Vandenbroeck K., Otaegui D., Saiz A., Gonzalez J.R., Fernandez O., Cavanillas M.L., Cénit M.C., Arroyo R., Alloza I., et al. 2010. The autoimmune disease-associated KIF5A, CD226, and SH2B3 gene variants confer susceptibility for multiple sclerosis. Genes Immun. 11:439–445. 10.1038/gene.2010.30 - DOI - PubMed
    1. Almeida, A.R.M., Neto J.L., Cachucho A., Euzébio M., Meng X., Kim R., Fernandes M.B., Raposo B., Oliveira M.L., Ribeiro D., et al. 2021. Interleukin-7 receptor α mutational activation can initiate precursor B-cell acute lymphoblastic leukemia. Nat. Commun. 12:7268. 10.1038/s41467-021-27197-5 - DOI - PMC - PubMed
    1. Armitage, R.J., Macduff B.M., Eisenman J., Paxton R., and Grabstein K.H.. 1995. IL-15 has stimulatory activity for the induction of B cell proliferation and differentiation. J. Immunol. 154:483–490. 10.4049/jimmunol.154.2.483 - DOI - PubMed

Substances