. 2024 Apr 1;221(4):e20232104.
doi: 10.1084/jem.20232104. Epub 2024 Feb 28.

Anti-PD-1 therapy triggers Tfh cell-dependent IL-4 release to boost CD8 T cell responses in tumor-draining lymph nodes

Affiliations

Anti-PD-1 therapy triggers Tfh cell-dependent IL-4 release to boost CD8 T cell responses in tumor-draining lymph nodes

Mathilde Ruggiu et al. J Exp Med. .

Abstract

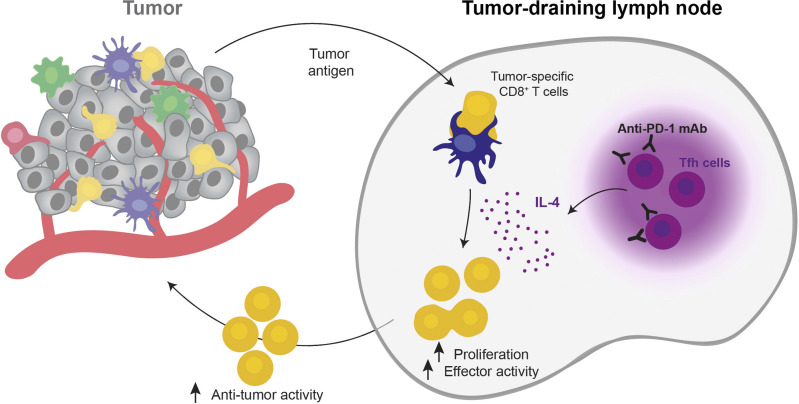
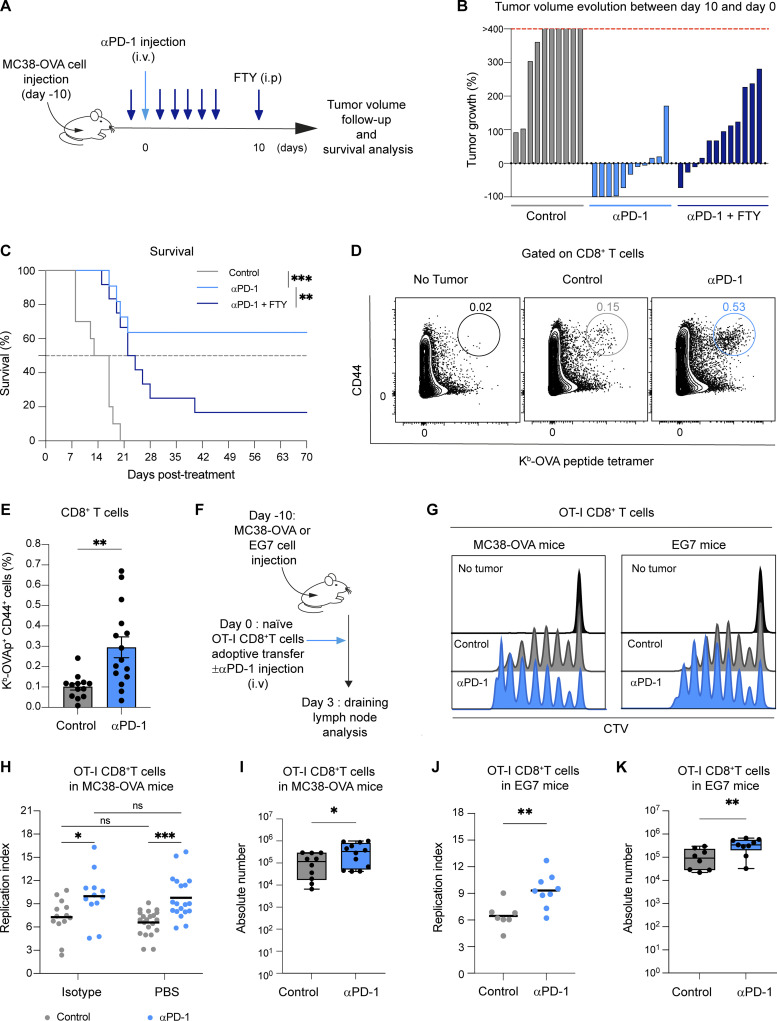
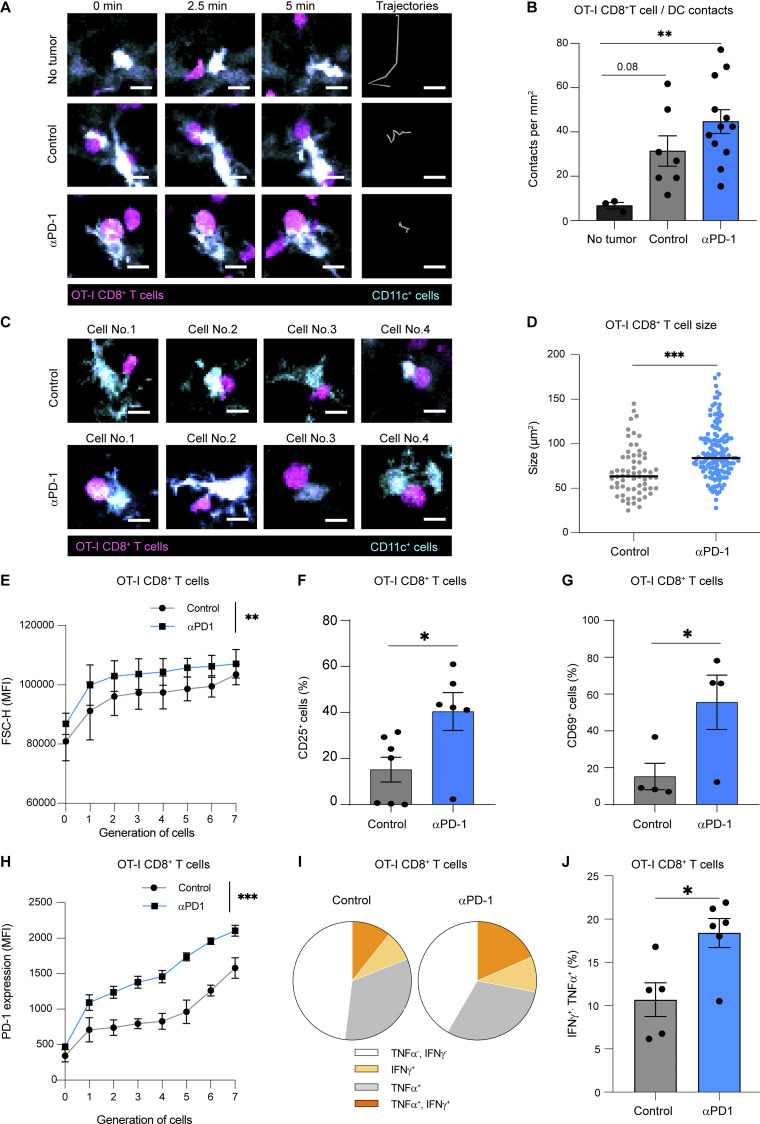
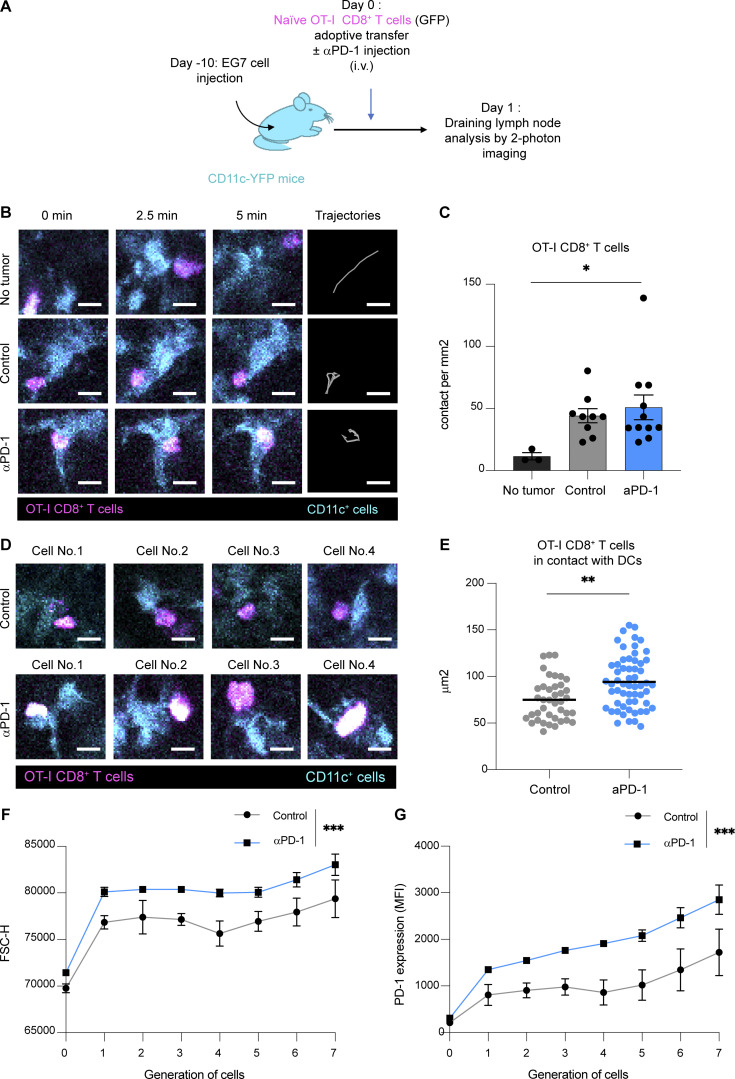
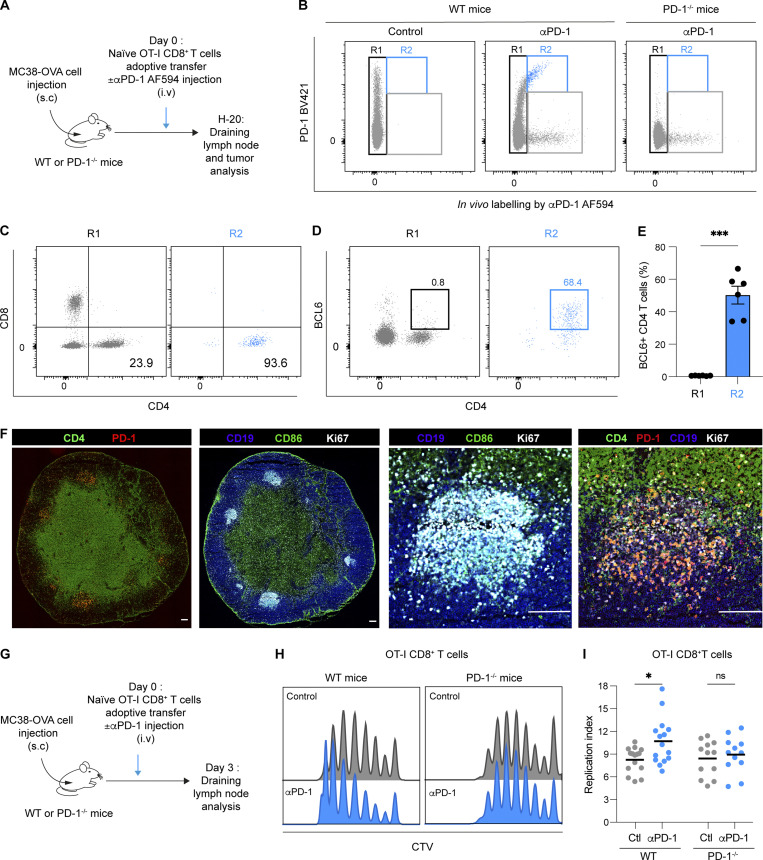
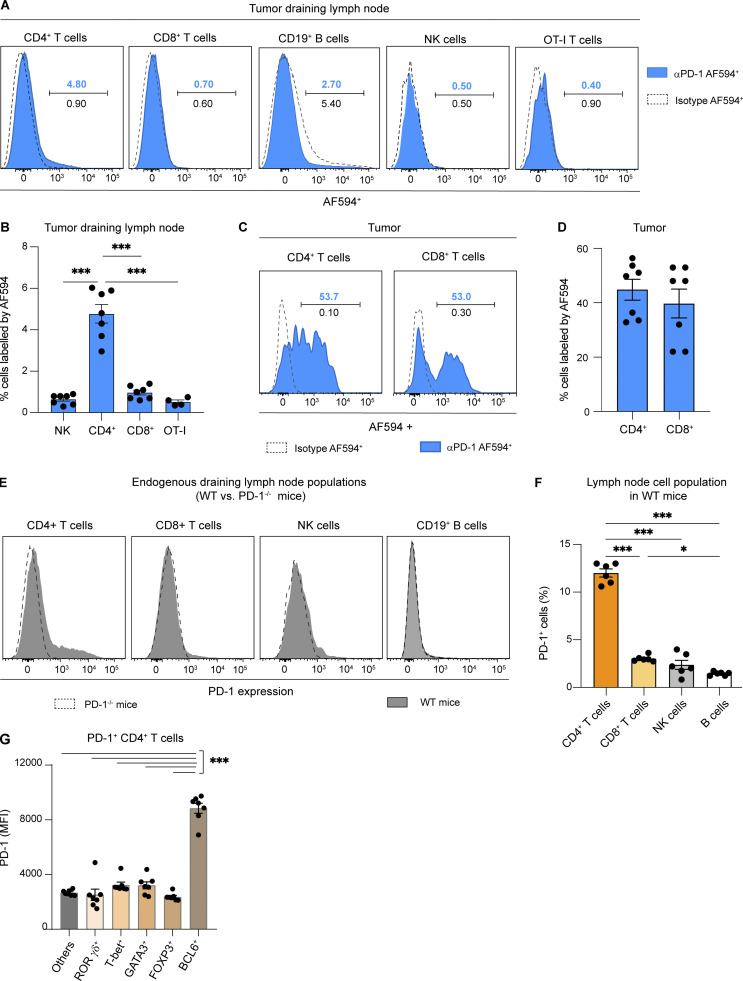
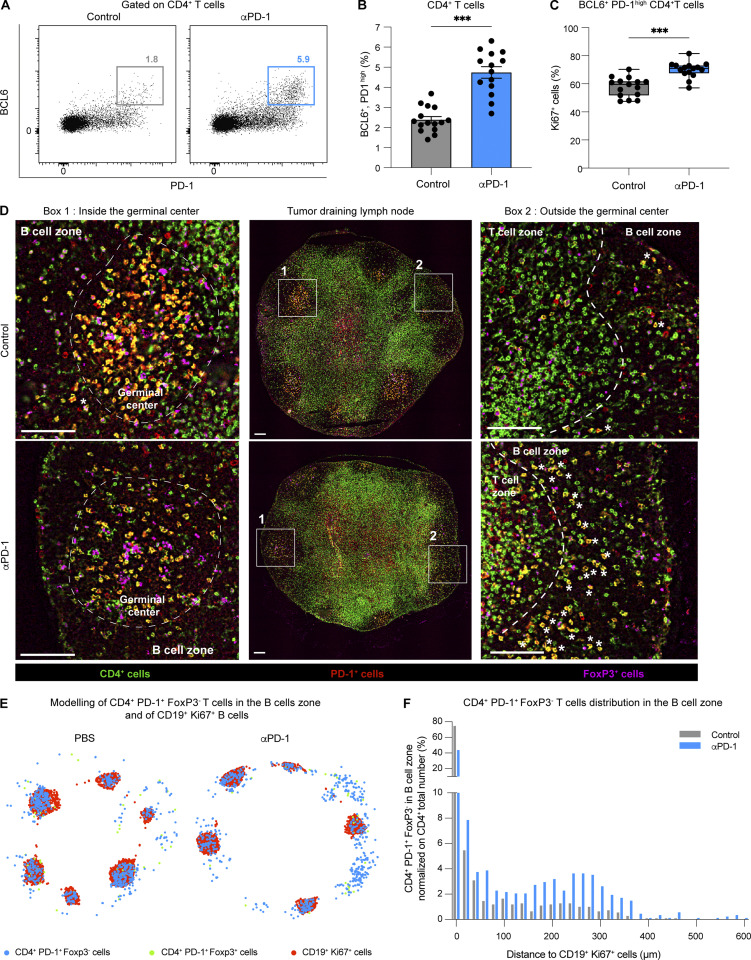
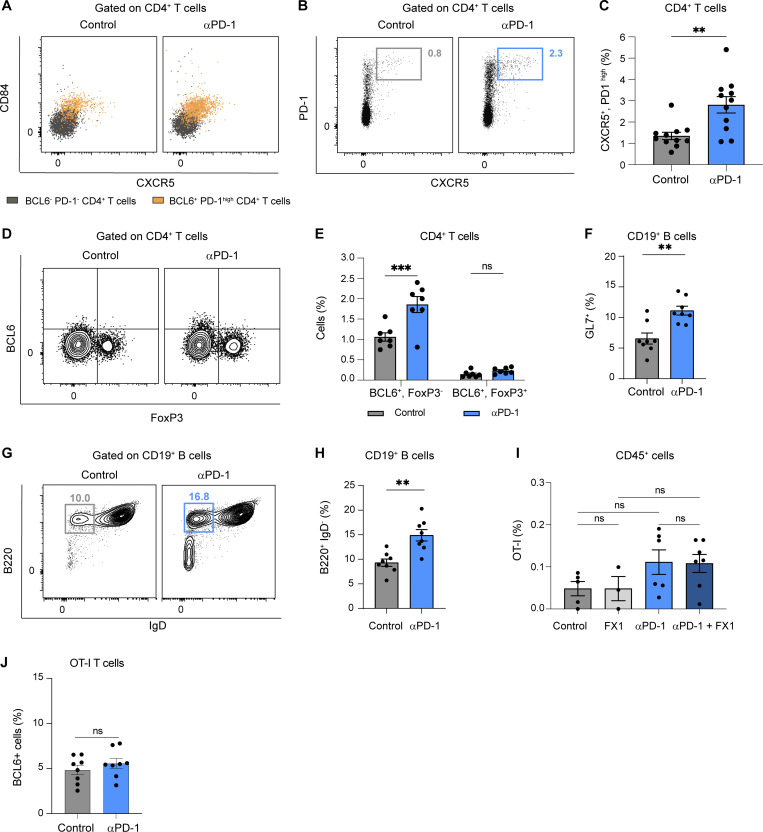
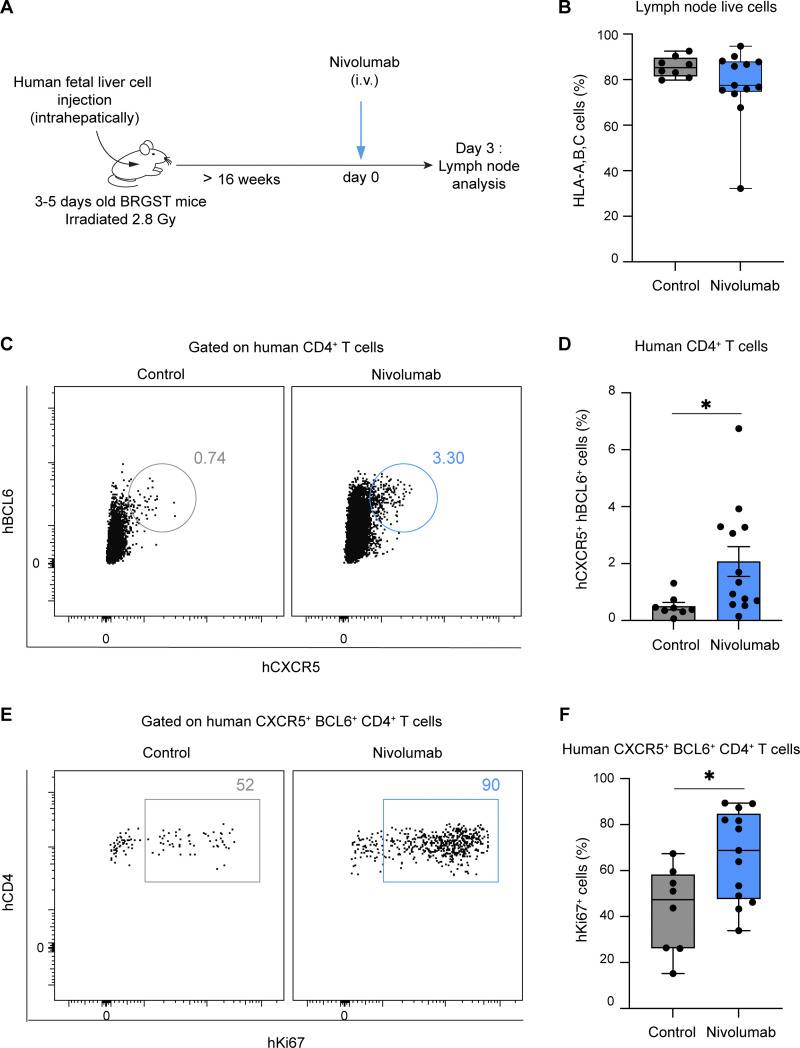
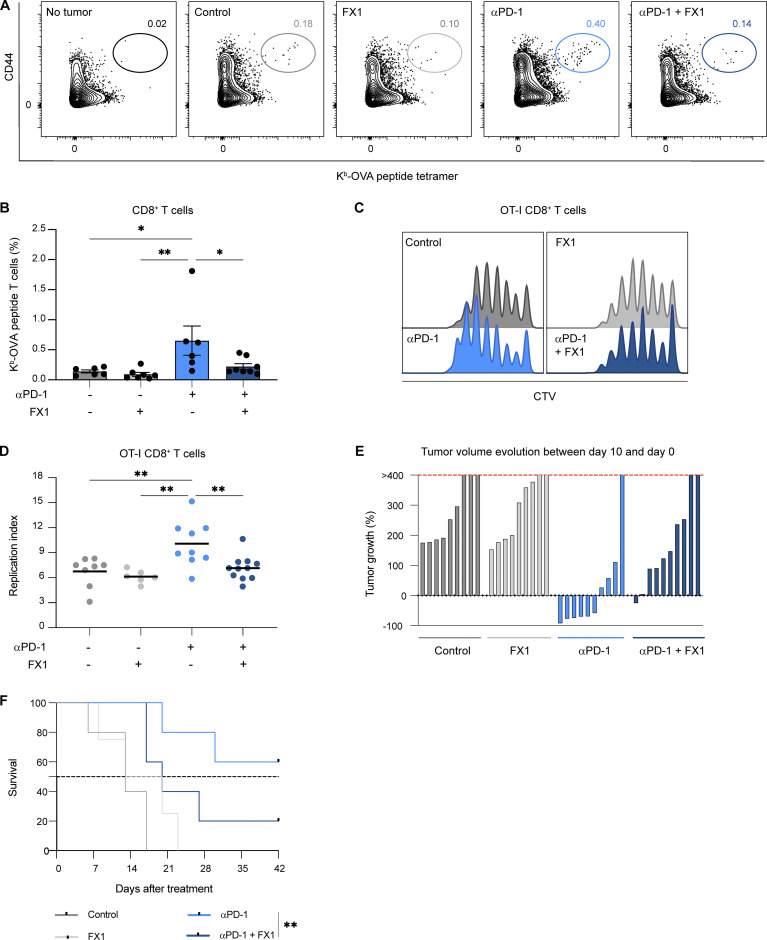
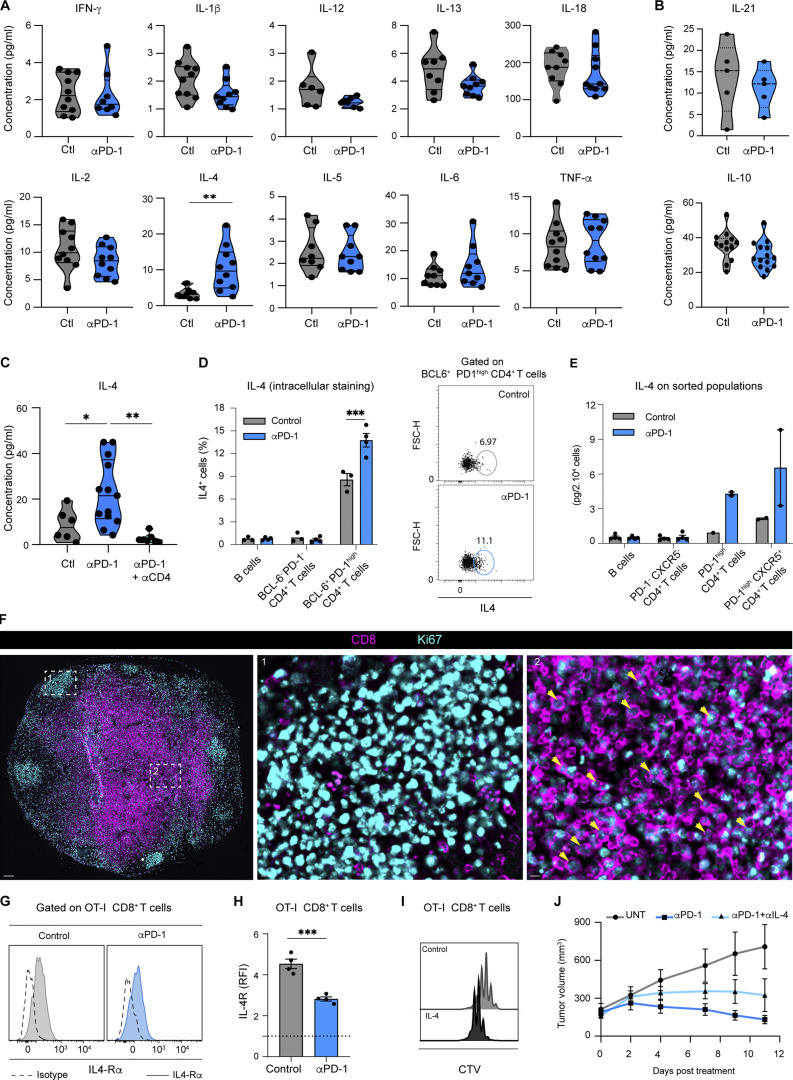
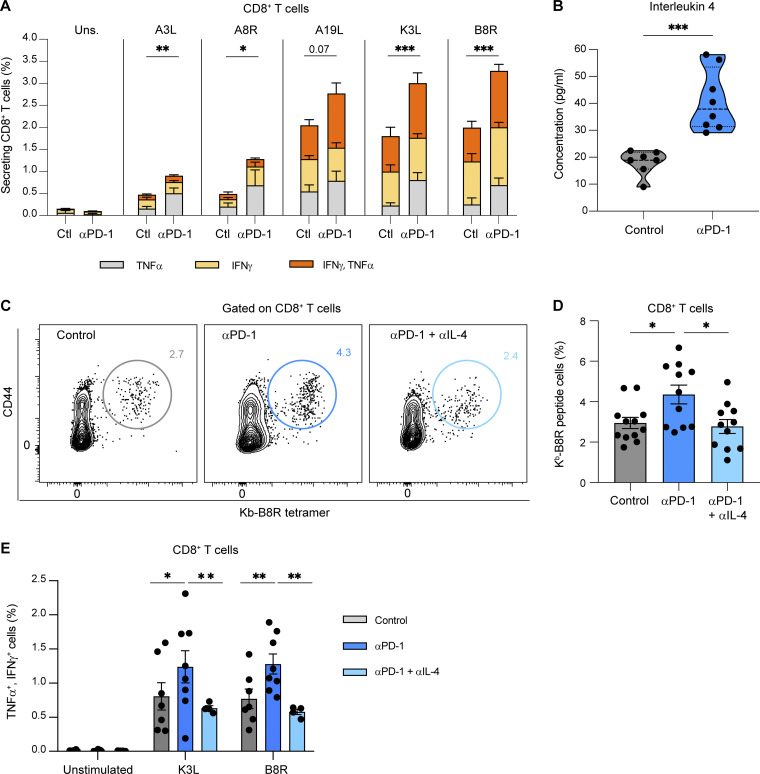
Anti-PD-1 therapy targets intratumoral CD8+ T cells to promote clinical responses in cancer patients. Recent evidence suggests an additional activity in the periphery, but the underlying mechanism is unclear. Here, we show that anti-PD-1 mAb enhances CD8+ T cell responses in tumor-draining lymph nodes by stimulating cytokine production in follicular helper T cells (Tfh). In two different models, anti-PD-1 mAb increased the activation and proliferation of tumor-specific T cells in lymph nodes. Surprisingly, anti-PD-1 mAb did not primarily target CD8+ T cells but instead stimulated IL-4 production by Tfh cells, the major population bound by anti-PD-1 mAb. Blocking IL-4 or inhibiting the Tfh master transcription factor BCL6 abrogated anti-PD-1 mAb activity in lymph nodes while injection of IL-4 complexes was sufficient to recapitulate anti-PD-1 mAb activity. A similar mechanism was observed in a vaccine model. Finally, nivolumab also boosted human Tfh cells in humanized mice. We propose that Tfh cells and IL-4 play a key role in the peripheral activity of anti-PD-1 mAb.


Conflict of interest statement

Disclosures: The authors declare no competing interests exist.

Figures

None
Graphical abstract
Figure 1.
Figure 1.
Anti-PD-1 mAb promotes tumor-specific CD8+ T cell proliferation in draining lymph nodes. (A–C) C57BL/6 mice were injected s.c. with MC38-OVA tumor cells (0.5 × 10⁶ cells). After 10 days, mice were treated or not with anti-PD-1 (250 µg, i.v.) either alone or anti-PD-1 in combination with FTY720 (20 µg for each injection). (A) Experimental setup. (B) Evolution of tumor volume between day 0 and day 10. (C) Mice survival. Statistical analysis was performed using a log-rank test. Compiled from two independent experiments with 10–12 mice per group. (D and E) Representative FACS contour plots and quantification of H2-Kb-OVAp tetramers+ among CD8+ T cells 5 days after treatment. Tumor-free mice were included as a control. Compiled from five independent experiments with 13–15 mice per group. (F–I) C57BL/6 mice were injected s.c. with MC38-OVA or EG7 tumor cells. After 10 days, mice were adoptively transferred with naïve CTV-labeled OT-I CD8+ T cells and treated, or not, with anti-PD-1 mAb (250 µg, i.v.). (F) Experimental setup. (G–I) OT-I CD8+ T cell proliferation was assessed on day 3 in the draining lymph node. (G) Representative histograms showing CTV dilution in OT-I CD8+ T cells. (H) Quantification of OT-I CD8+ T cell replication index in lymph nodes from mice bearing MC38-OVA. Anti-PD-1 mAb-treated mice were compared with PBS- or isotype-injected mice with similar results. Compiled from five independent experiments with 12–19 mice per group. (I) Absolute numbers of OT-I CD8+ T cells in tumor-draining lymph nodes were assessed 3 days later. Compiled from four independent experiments with a total of 10–12 mice per group. (J and K) Quantification of OT-I CD8+ T cell (J) replication index and (K) absolute numbers in tumor-draining lymph nodes from mice bearing EG7. Compiled from three independent experiments with a total of seven to nine mice per group. Statistical analyses were performed using t tests (E, I, J and K) or two-way ANOVA (H). *, P < 0.05; **, P < 0.01; ***, P < 0.001.
Figure 2.
Figure 2.
Anti-PD-1 mAb enhances CD8+ T cell responses in draining lymph nodes. (A–D) CD11c-eYFP mice were injected s.c. with MC38-OVA tumor cells. After 10 days, mice were adoptively transferred with naïve GFP-expressing OT-I CD8+ T cells and treated or not with anti-PD-1 (250 µg, i.v.). Two-photon imaging of tumor-draining lymph nodes was performed on day 2. (A) Representative two-photon time-lapse images showing contacts between OT-I CD8+ T cells (pseudocolored in magenta) and CD11c reporter positive cells (pseudocolored in cyan) and OT-I CD8+ T cell tracks (during 10 min). Scale bar, 10 µm. (B) Quantification of the density of stable T cell–DC contacts (lasting >5 min). (C) Representative two-photon image of stable T cell–DC contact, illustrating the blastic phenotype seen in anti-PD-1 mAb–treated mice. Scale bar, 10 µm. (D) Quantification of the size of OT-I CD8+ T cell stably interacting with DCs in the indicated groups. Results (B–D) are compiled from 7 to 12 movies performed in two independent experiments with three mice per group. (E–H) C57BL/6 mice were injected s.c. with MC38-OVA. After 10 days, mice were adoptively transferred with CTV-labeled OT-I CD8+ T cells and treated or not with anti-PD-1 (250 µg, i.v.). (E) OT-I CD8+ T cell size was estimated by flow cytometry on day 3 using the FSC-H (forward scatter height) parameter in each cell generation identified by CTV dilution. Representative of four independent experiments with three to four mice per group in each experiment. (F) Percentage of CD25+ cells among OT-I CD8+ T cells on day 1. Compiled from two independent experiments with a total of six mice per group. (G) Percentage of CD69+ cells among OT-I CD8+ T cells on day 1. Representative of two independent experiments with three to four mice per group in each experiment. (H) MFI (mean fluorescence intensity) of PD-1 expression on OT-I CD8+ T cells was quantified on day 3 for each cell generation. Representative of four independent experiments with three to four mice per group in each experiment. (I and J) The production of TNF-α and IFN-γ by OT-I CD8+ T cells was measured by intracellular staining after ex vivo restimulation with OVA peptide. (I) Pie chart showing cytokine production by OT-I CD8+ T cells. (J) Quantification of TNF-α+IFN-γ+ OT-I CD8+ T cells. Compiled from two independent experiments with a total of five to six mice per group. Statistical analyses were performed using t test (D, F, G, and J) or two-way ANOVA (B, E, and H). *, P < 0.05; **, P < 0.01; ***, P < 0.001.
Figure S1.
Figure S1.
Anti-PD-1 mAb activity promotes CD8+ T cell responses in the draining lymph node of EG7 tumorbearing mice. (A–E) CD11c-eYFP mice were injected s.c. with EG7 tumor cells. After 10 days, mice were adoptively transferred with GFP-expressing OT-I CD8+ T cells and treated or not with anti-PD-1 mAb (250 µg, i.v.). Two-photon imaging of tumor-draining lymph nodes was performed on day 1. (A) Experimental setup. (B) Representative two-photon time-lapse images showing contacts between OT-I CD8+ T cells (pseudocolored in magenta) and CD11c reporter positive cells (pseudocolored in cyan) and OT-I CD8+ T cell tracks (during 10 min). Scale bar, 10 µm. (C) Quantification of the density of stable T cell–DC contacts (lasting >5 min). (D) Representative two-photon images of stable T cell–DC contacts, illustrating the blastic phenotype seen in anti-PD-1 mAb–treated mice. Scale bar, 10 µm. (E) Quantification of the size of OT-I CD8+ T cell stably interacting with DCs in the indicated groups. Results are compiled from 9–11 movies from two independent experiments. (F and G) C57BL/6 mice were injected s.c. with EG7 tumor cells. After 10 days, mice were adoptively transferred with CTV-labeled OT-I CD8+ T cells and treated or not with anti-PD-1 mAb (250 µg, i.v.). (F) OT-I CD8+ T cell size was estimated by flow cytometry on day 3 using the FSC-H parameter in each cell generation identified by CTV dilution. Representative of three independent experiments with two to three mice per group in each experiment. (G) MFI of PD-1 expression on OT-I CD8+ T cells was quantified on day 3 for each cell generation. Representative of three independent experiments with two to three mice per group in each experiment. Statistical analyses were performed using t test (E) or two-way ANOVA (C, F, and G). *, P < 0.05; **, P < 0.01; ***, P < 0.001.
Figure S2.
Figure S2.
Anti-PD-1 treatment has little impact on DC phenotype in the tumor-draining lymph node. (A and B) C57BL/6 mice were injected s.c. with MC38-OVA tumor cells (0.5.106 cells). After 10 days, mice were treated with anti-PD-1 or an isotype control (250 µg, i.v.). On day 1 and day 3, lymph node DC phenotype was assessed by flow cytometry. Frequency (A) and phenotype (B) of migratory DCs (mDC, CD11cint, MHC class IIhigh) and conventional DC (cDC, CD11chigh, MHC class IIint). Representative of two independent experiments. Statistical analyses were performed using two-way ANOVA. *, P < 0.05; **, P < 0.01.
Figure 3.
Figure 3.
Anti-PD-1 mAb binds to follicular helper T cells in tumor-draining lymph nodes. (A–E) C57BL/6 mice were injected s.c. with MC38-OVA tumor cells. After 10 days, tumor-bearing mice were adoptively transferred with naïve GFP-expressing OT-I CD8+ T cells and treated with AF594-labeled anti-PD-1 mAb (250 µg, i.v.) or with PBS as a control. PD1−/− mice were used as a control. Flow cytometric analysis of draining lymph nodes was performed 20 h later. (A) Experimental setup. (B) Representative FACS dot plot showing in vivo labeling by AF594-labeled anti-PD-1 mAb (clone RMP1-14) and ex vivo staining by anti-PD-1 (clone 29F.1A12). Region R1 corresponds to cells that did not exhibit in vivo Ab staining, while R2 corresponds to cells binding the Ab injected in vivo and expressing PD-1 as detected by ex vivo staining. (C and D) Expression of CD4 and CD8 markers (C) or CD4 and BCL6 (D) within R1 and R2. (E) Quantification of BCL6+CD4+ T cells within R1 and R2 regions. Representative of two independent experiments with six mice per group in each experiment. (F) Immunofluorescence of lymph node sections showing expression of PD-1, CD4, CD19, CD86, and Ki67. Germinal centers (right) are identified using CD19, CD86, and Ki67 markers. Scale bar, 10 µm. Representative of two independent experiments with a total of three mice per group. (G–I) C57BL/6 or PD-1−/− mice were injected s.c. with MC38-OVA tumor cells. After 10 days, tumor-bearing mice were adoptively transferred with CTV-labeled OT-I CD8+ T cells and treated or not with anti-PD-1 (250 µg, i.v.). Flow cytometric analysis of draining lymph nodes was performed 3 days later. (G) Experimental setup. (H) Representative histograms showing CTV dilution in OT-I CD8+ T cells in WT and PD-1−/− tumor-bearing mice. (I) Quantification of OT-I CD8+ T cell replication index in lymph nodes of WT and PD-1−/− mice. Compiled from four independent experiments with a total of 12–15 mice per group. Statistical analyses were performed using t test (E) or two-way ANOVA (I). ns non-significant; *, P < 0.05; ***, P < 0.001.
Figure S3.
Figure S3.
Anti-PD-1 mAb primarily binds to a subset of CD4+ T cells in tumor-draining lymph nodes. (A–D) C57BL/6 mice were injected s.c. with MC38-OVA tumor cells. After 10 days, tumor-bearing mice were adoptively transferred with GFP-expressing OT-I CD8+ T cells and treated with AF594-labeled anti-PD-Ab or treated with an AF594-labeled IgG2a isotype. Draining lymph node and tumor were analyzed by flow cytometry 20 h later. (A) Representative histograms showing in vivo labeling by AF594-labeled anti-PD-1 (percentage shown in blue) or AF594-labeled control isotype (percentage shown in black) on different immune cell subsets in tumor-draining lymph nodes. Note only CD4+ T cells specifically bound anti-PD-1 mAb and that a small level (2–5%) of unspecific binding (isotype and anti-PD-1 mAb) is detected on B cells. NK, natural killer. (B) Quantification of cell labeling by the AF594-conjugated anti-PD-1 Ab in the indicated subset. (C) Representative histograms showing in vivo labeling of tumor-resident CD4+ and CD8+ T cells by AF594-conjugated anti-PD-1 Ab. (D) Quantification of AF594+ labeled anti-PD-1 cells in each cell subset. One experiment with five to seven mice per group. (E–G) C57BL/6 WT or PD-1−/− mice were injected s.c. with MC38-OVA tumor cells. (E and F) PD-1 expression on CD4+ or CD8+ T cells, CD19+ B cells, and NK-1.1+ cells was quantified on day 13. Representative histograms (E) and quantification (F) of PD-1+–expressing cells in WT mice. Compiled from two independent experiments with a total of six mice per group. (G) MFI of PD-1 expressed at the cell surface on different PD-1+ CD4+ T cell populations, defined by the transcription factors RORγτ, T-bet, GATA3, FoxP3, and BCL6. One experiment with seven mice per group. Statistical analyses were performed using two-way ANOVA, *, P < 0.05; ***, P < 0.001.
Figure 4.
Figure 4.
Tfh cells respond to anti-PD-1 mAb treatment in tumor-draining lymph nodes. C57BL/6 mice were injected s.c. with MC38-OVA tumor cells. After 10 days, tumor-bearing mice were treated or not with anti-PD-1 mAb (250 µg, i.v.). Draining lymph nodes were analyzed 3 days later by flow cytometry or immunofluorescence. (A and B) Representative FACS dot plot (A) and quantification (B) of BCL6+ PD-1high cells among CD4+ T cells. Compiled from three independent experiments with a total of 15 mice per group. (C) Quantification of Ki67+ cells among BCL6+ PD-1high CD4+ T cells. Compiled from three independent experiments with a total of 15 mice per group. (D) Lymph node immunofluorescence showing PD-1, CD4, and FoxP3 expression. CD19 and Ki67 staining was included to locate the B cell zone and germinal centers. Region 1 (left) shows a germinal center and region 2 (right) shows an area of the B cell zone without the germinal center. White stars (*) highlight CD4+ PD-1+ FoxP3 T cells located in the B cell zone but outside germinal centers. Scale bar, 100 µm. Representative of two independent experiments with a total of three mice per group. (E) Schematic representation showing CD4+ PD-1+ FoxP3 T cells in the B cell zone and CD19+ Ki67+ B cells (to identify germinal centers). (F) Distance between individual CD4+ PD1+ FoxP3 T cells present in the B cell zone and the closest CD19+ Ki67+ B cells was performed to estimate T cell localization. Representative of two independent experiments with a total of three mice per group. Statistical analyses were performed using t test, ***, P < 0.001.
Figure S4.
Figure S4.
Impact of anti-PD-1 mAb on lymph node Tfh cells, Tfr cells, B cells, and CD8+ T cells. C57BL/6 mice were injected s.c. with MC38-OVA tumor cells. After 10 days, tumor-bearing mice were treated or not with anti-PD-1 mAb (250 µg, i.v.). Draining lymph node flow cytometry analysis was performed 3 days later. (A) Representative dot plots showing CXCR5 and CD84 expression in CD4+ BCL6+ PD-1high T cells compared with CD4+ BCL6 PD-1 T cells. (B and C) (B) Representative FACS dot plots and (C) quantification of CXCR5+, PD-1high cells among CD4+ T cells. Compiled from three independent experiments with a total of 11 mice per group. (D and E) (D) Representative FACS dot plots and (E) quantification of BCL6+Foxp3 and BCL6+FoxP3+ among CD4+ T cells (n = 7 mice per group). (F–H) (F) Quantification of GL7+ CD19+ B cells. Representative dot plot (G) and quantification (H) of B220+ IgD cells among CD19+ B cells. Compiled from two independent experiments with a total of eight mice per group. (I and J) C57BL/6 mice were injected s.c. with MC38-OVA tumor cells. After 10 days, mice were adoptively transferred by GFP-expressing OT-I CD8+ T cells and treated or not with anti-PD-1 mAb (250 µg, i.v.). (I) Tumor-bearing mice received either two doses of the BCL6 inhibitor FX1 or a vehicle as a control. On day 3, OT-I T cells were quantified at the tumor site. (J) The small fraction of BCL-6 expressing specific CD8+ T cells in the lymph node do not preferentially expand upon anti-PD-1 treatment. Statistical analyses were performed using t test (C, F, H, and J), one-way ANOVA (I), or two-way ANOVA (E). ns, non significant; **, P < 0.01, ***, P < 0.001.
Figure 5.
Figure 5.
Human Tfh cells proliferate in response to nivolumab in mice with a humanized immune system. (A–F) BRGST HIS mice were treated i.v. with 250 µg nivolumab or with PBS and analyzed 3 days later. (A) Experimental setup. (B) Lymph node reconstitution with human cells was confirmed by HLA-A, B, C staining of live cells. (C and D) Representative FACS dot plots (C) and quantification (D) of CD4+ BCL6+ CXCR5+ human T cells in mice treated with nivolumab or PBS. (E and F) Representative FACS dot plots (E) and quantification (F) of Ki67+ cells among CD4+ BCL6+ CXCR5+ human T cells. Compiled from three independent experiments with a total of 7–13 mice per group and generated from six different human donors. Statistical analyses were performed using t test (B, D, and F). *, P < 0.05.
Figure 6.
Figure 6.
Anti-PD-1 mAb activity in the draining lymph node is BCL6 dependent. (A and B) C57BL/6 mice were injected s.c. with MC38-OVA. After 10 days, mice were treated or not with anti-PD-1 mAb (250 µg, i.v.) and received either three doses of the BCL6 inhibitor FX1 or a vehicle as a control. Representative FACS dot plots (A) and quantification (B) of H2-Kb-OVAp tetramers+ CD8+ T cells 5 days after treatment. Compiled from two independent experiments with five to eight mice per group. (C and D) C57BL/6 mice were injected s.c. with MC38-OVA. After 10 days, mice were adoptively transferred by CTV-labeled OT-I CD8+ T cells and treated or not with anti-PD-1 mAb (250 µg, i.v.) and received either two doses of the BCL6 inhibitor FX1 or a vehicle as a control. OT-I CD8+ T cell proliferation was assessed 3 days later. (C) Representative histograms showing CTV dilution in OT-I CD8+ T cells. (D) Quantification of OT-I CD8+ T cell replication index in lymph nodes. Compiled from two independent experiments with 6–11 mice per group. (E and F) C57BL/6 mice were injected s.c. with MC38-OVA. After 10 days, mice were treated or not with anti-PD-1 mAb (250 µg, i.v.). Some mice were injected every 2 days with FX1 or vehicle until day 10. (E) Evolution of tumor volume between day 0 and day 10. (F) Survival curves for the indicated groups. The dashed line corresponds to 50% survival. Compiled from two independent experiments with a total of 9–10 mice per group. Statistical analyses were performed using two-way ANOVA (B and D) or a log-rank test (F). *, P < 0.05; **, P < 0.01.
Figure 7.
Figure 7.
IL-4 is essential for anti-PD-1–mediated enhancement of tumor-specific CD8+ T cell responses. (A) C57BL/6 mice were injected s.c. with MC38-OVA tumor cells. After 10 days, mice were treated or not with anti-PD-1 mAb (250 µg, i.v.). Heat map showing the cytokine landscape (as detected by multiplex protein assay) of the draining lymph nodes, 3 days after anti-PD-1 mAb treatment. Each value was normalized to the mean value of control samples (untreated). Compiled from three independent experiments with a total of 10 mice per group. (B) Tumor-bearing mice were treated or not with anti-PD-1 mAb (250 µg, i.v.) and received either two doses of the BCL6 inhibitor FX1 or a vehicle as a control. IL-4 concentration was measured in the draining lymph node 3 days after treatment. Compiled from two independent experiments with a total of at least five mice per group. (C and D) Tumor-bearing mice were transferred with CTV-labeled OT-I CD8+ T cells and treated with anti-PD-1 Ab or left untreated and received either two doses of anti-IL-4 Ab or an isotype control. (C) Representative histograms showing CTV dilution in OT-I CD8+ T cells in the indicated group. (D) Quantification of OT-I CD8+ T cell replication index. Compiled from three independent experiments with a total of 9–10 mice per group. (E–G) Tumor-bearing mice were transferred with CTV-labeled OT-I CD8+ T cells and mice were treated (or not) with anti-PD-1 mAb (250 µg, i.v.) or received one dose of IL-4 complexes. (E) Representative histograms showing CTV dilution in OT-I CD8+ T cells. (F) Quantification of OT-I CD8+ T cell replication index. Compiled from four independent experiments with a total of 10–12 mice per group. (G) Pie charts and quantification showing TNF-α and IFN-γ production in OT-I CD8+ T cells. Compiled from two independent experiments with a total of five to six mice per group. (H and I) C57BL/6 mice were injected s.c. with MC38-OVA tumor cells. After 10 days mice were treated with anti-PD-1 mAb with or without anti-IL4 mAb. Control mice received the appropriate isotype controls (250 µg, i.v.). Detection of p-STAT6 in OT-I CD8+ T cells 2 days after treatment. RFI, ratio of fluorescence intensity. (H) Representative dot plots showing p-STAT6 staining in each cell generation identified by CTV dilution. (I) MFI of p-STAT6 staining on OT-I CD8+ T cells normalized to that measured with an isotype control. Representative of two independent experiments with four to five mice per group in each experiment. (J–L) OT-I CD8+ T cells were labeled by CTV and in vitro activated with OVA peptide. IL-4 was added on day 1 and 2 and CTV dilution was assessed on day 3. (J) Quantification of OT-I CD8+ T cell replication index in the presence or absence of IL-4. (K) Absolute number of OT-I CD8+ T cells in the presence or absence of IL-4. (L) The average size of divided OT-I CD8+ T cells was estimated by flow cytometry. Results from four independent experiments are shown. Each dot represents the mean of at least three replicates measured in each experiment. Statistical analyses were performed using two-way ANOVA (B, D, F, and I) and paired t test (J–L). *, P < 0.05; **, P < 0.01.
Figure S5.
Figure S5.
Role of IL-4 during response to anti-PD-1 mAb. (A and B) Cytokine landscape of tumor-draining lymph nodes 3 days after anti-PD-1 mAb treatment. Tested cytokines included (A) IFN-γ, IL-1β, IL-12, IL-13, IL-18, IL-2, IL-4, IL-5, IL-6, TNF-α, and (B) IL-21 and IL-10. The calculated concentrations correspond to 1 × 10⁶ lysed lymph node cells resuspended in 50 μl of lysis buffer. Compiled from three independent experiments with 10 mice per group. (C) C57BL/6 mice were injected s.c. with MC38-OVA. After 10 days, mice were treated or not with anti-PD-1 mAb (250 µg, i.v.) and received i.p. either three doses of an anti-CD4 (200 µg) or PBS as a control. IL-4 production in tumor-draining lymph node was assessed 3 days after treatment. Compiled from two independent experiments with 7–13 mice per group. (D) Quantification of IL-4+ cells by intracellular staining in different CD4+ T cells subset or in CD19+ B cells 3 days after anti-PD-1 mAb treatment. (E) The indicated cell populations were sorted from tumor-draining lymph node 3 days after anti-PD-1 mAb treatment. IL-4 concentrations shown correspond to 2 × 10⁴ sorted cells resuspended in 50 μl. Each dot represents one sorted population. (F) Lymph node immunofluorescence of tumor-bearing mice treated with anti-PD-1 mAb showing CD8 and Ki67 expression. Region 1 (middle image) shows a germinal center and region 2 (right image) shows an area of the T cell zone. Yellow arrows highlight CD8+ Ki67+ T cells. Scale bar, 100 µm. (G and H) (G) Representative histograms and (H) quantification of IL4-Rα expression on OT-I CD8+ T cells normalized to that measured with an isotype control. (I) Representative histograms showing CTV dilution in OT-I CD8+ T cells stimulated using OVA peptide in the presence or absence of IL-4 in vitro. (J) Tumor-bearing mice were adoptively transferred with OT-I CD8+ T cells, treated or not with anti-PD-1 mAb either alone or combined with anti-IL-4 mAb (given every 2 days). Tumor volume was monitored for 10 days. Statistical analyses were performed using t test (A, B, D, and H) or one-way ANOVA (C). *, P < 0.05; **, P < 0.01; ***, P < 0.001.
Figure 8.
Figure 8.
IL-4 is essential for anti-PD-1–mediated enhancement of vaccine-specific CD8+ T cell responses. (A and B) C57BL/6 mice were injected into the footpad with 2 × 10⁶ p.f.u. of MVA-HIV-B. After 3 days, mice were treated i.v. with anti-PD-1 or a control isotype. The draining lymph nodes were analyzed on day 6. (A) Production of TNF-α and IFN-γ by CD8+ T cells after ex vivo stimulation by A3L, A8R, A19L, K3L, or B8R peptides, five known H-2b–restricted MVA epitopes. Compiled from two independent experiments with seven to eight mice per group. Uns., unstimulated. (B) IL-4 production measured in the lysate of the lymph node draining the site of MVA injection. Compiled from two independent experiments with seven to eight mice per group. (C–E) C57BL/6 mice were injected into the footpad with 2 × 10⁶ p.f.u. of MVA-HIV-B. After 3 days, mice were either untreated or treated i.v. with anti-PD-1 Ab combined with two injections of anti-IL-4 mAb or with anti-PD-1 with two injections of an isotype control. Representative FACS contour plots (C) and quantification (D) of H2-Kb-B8R tetramers+ CD8+ T cells. Compiled from three independent experiments with 11–12 mice per group. (E) Quantification of TNFα+ and IFNγ+ double-producing CD8+ T cells after ex vivo stimulation by K3L or B8R peptides (n = 4–9 mice per group). Statistical analyses were performed using two-way ANOVA (A, D, and E) and t test (B). *, P < 0.05; **, P < 0.01; ***, P < 0.001.

Similar articles

Cited by

References

    1. Arlauckas, S.P., Garris C.S., Kohler R.H., Kitaoka M., Cuccarese M.F., Yang K.S., Miller M.A., Carlson J.C., Freeman G.J., Anthony R.M., et al. . 2017. In vivo imaging reveals a tumor-associated macrophage-mediated resistance pathway in anti-PD-1 therapy. Sci. Transl. Med. 9:eaal3604. 10.1126/scitranslmed.aal3604 - DOI - PMC - PubMed
    1. Armand, P., Shipp M.A., Ribrag V., Michot J.M., Zinzani P.L., Kuruvilla J., Snyder E.S., Ricart A.D., Balakumaran A., Rose S., and Moskowitz C.H.. 2016. Programmed death-1 blockade with pembrolizumab in patients with classical Hodgkin lymphoma after brentuximab vedotin failure. J. Clin. Oncol. 34:3733–3739. 10.1200/JCO.2016.67.3467 - DOI - PMC - PubMed
    1. Bankhead, P., Loughrey M.B., Fernández J.A., Dombrowski Y., McArt D.G., Dunne P.D., McQuaid S., Gray R.T., Murray L.J., Coleman H.G., et al. . 2017. QuPath: Open source software for digital pathology image analysis. Sci. Rep. 7:16878. 10.1038/s41598-017-17204-5 - DOI - PMC - PubMed
    1. Beuneu, H., Lemaître F., Deguine J., Moreau H.D., Bouvier I., Garcia Z., Albert M.L., and Bousso P.. 2010. Visualizing the functional diversification of CD8+ T cell responses in lymph nodes. Immunity. 33:412–423. 10.1016/j.immuni.2010.08.016 - DOI - PubMed
    1. Boutsikou, E., Domvri K., Hardavella G., Tsiouda D., Zarogoulidis K., and Kontakiotis T.. 2018. Tumour necrosis factor, interferon-gamma and interleukins as predictive markers of antiprogrammed cell-death protein-1 treatment in advanced non-small cell lung cancer: A pragmatic approach in clinical practice. Ther. Adv. Med. Oncol. 10:1758835918768238. 10.1177/1758835918768238 - DOI - PMC - PubMed