. 2024 Apr;11(16):e2304940.
doi: 10.1002/advs.202304940. Epub 2024 Feb 28.

Beta-Cell Tipe1 Orchestrates Insulin Secretion and Cell Proliferation by Promoting Gαs/cAMP Signaling via USP5

Affiliations

Beta-Cell Tipe1 Orchestrates Insulin Secretion and Cell Proliferation by Promoting Gαs/cAMP Signaling via USP5

Lu Ding et al. Adv Sci (Weinh). 2024 Apr.

Abstract

Inadequate β-cell mass and insulin secretion are essential for the development of type 2 diabetes (T2D). TNF-α-induced protein 8-like 1 (Tipe1) plays a crucial role in multiple diseases, however, a specific role in T2D pathogenesis remains largely unexplored. Herein, Tipe1 as a key regulator in T2D, contributing to the maintenance of β cell homeostasis is identified. The results show that the β-cell-specific knockout of Tipe1 (termed Ins2-Tipe1BKO) aggravated diabetic phenotypes in db/db mice or in mice with high-fat diet-induced diabetes. Notably, Tipe1 improves β cell mass and function, a process that depends on Gαs, the α subunit of the G-stimulating protein. Mechanistically, Tipe1 inhibited the K48-linked ubiquitination degradation of Gαs by recruiting the deubiquitinase USP5. Consequently, Gαs or cAMP agonists almost completely restored the dysfunction of β cells observed in Ins2-Tipe1BKO mice. The findings characterize Tipe1 as a regulator of β cell function through the Gαs/cAMP pathway, suggesting that Tipe1 may emerge as a novel target for T2D intervention.

Keywords: Gαs ubiquitination; Tipe1; deubiquitinase USP5; diabetes; islet β cell.


Conflict of interest statement

The authors declare no conflict of interest.

Figures

Figure 1
Figure 1
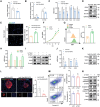
Tipe1 knockdown in β cells causes severe diabetic phenotypes in db/db mice. A) Strategy of islet β cell‐specific Tipe1‐knockout db/db mice. B) Growth curves of male Ins2‐Tipe1BKO‐db/db mice and Ins2‐Cre‐db/db mice. (n = 6 mice/group). C) Photograph of 14‐week‐old Ins2‐Tipe1BKO‐db/db mice and Ins2‐Cre‐db/db mice. D,E) Random blood and FBG levels were detected in 12‐week‐old male Ins2‐Tipe1BKO‐db/db mice and Ins2‐Cre‐db/db mice. (n = 7 mice/group). F) Fasting insulin levels were detected in 12‐week‐old male Ins2‐Tipe1BKO‐db/db mice and Ins2‐Cre‐db/db mice. (n = 7 mice/group). G) Plasma glucose levels during the glucose tolerance test for 12 weeks mice. (n = 7 mice/group). H) Plasma glucose levels during the ITT‐test for 12 weeks mice. (n = 3 mice/group). I) Blood insulin levels during GSIS‐test for 12 weeks mice. (n = 7 mice/group). J,K) Daily food and drink intake of Ins2‐Cre‐db/db and Ins2‐Tipe1BKO‐db/db mice. Mice were put in individually into metabolic cages. The food and drink intake were measured by a built‐in detector. (n = 7 mice/group). L,M) The RER and heat production of Ins2‐Cre‐db/db and Ins2‐Tipe1BKO‐db/db mice. Mice were put in individually into the ametabolic cage. The VO2, VCO2, and oxygen consumed were measured by a built‐in detector. The RER was calculated by dividing VCO2/VO2. (n = 7 mice/group). N‐P) H&E staining was performed in pancreatic tissues of Ins2‐Cre‐db/db and Ins2‐Tipe1BKO‐db/db mice, followed by measurements of the islet area/pancreatic area ratio and islet area. (n = 8 mice/group). Q,R) IHC staining was used to detect the protein level of insulin in pancreatic sections, followed by measurements of β‐cell mass. (n = 8 mice/group). Data are presented as the mean ± SEM. Data were statistically analyzed by Student's t‐test. *p < 0.05, **p < 0.01, ***p < 0.001, ns indicates no significant difference.
Figure 2
Figure 2
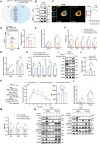
Tipe1 promotes β cell proliferation and insulin secretion in a cell‐autonomous manner. A) Pancreatic islets from 8‐week‐old Ins2‐Cre and Ins2‐Tipe1BKO mice were used to detect intracellular insulin levels. (n = 4 mice/group). B) Pancreatic islets were treated with 2.8 or 16.7 mM glucose in an in vitro setting, and the insulin levels in the culture supernatants were determined by ELISA. (n = 5 mice/group). C,D) Expression of the indicated genes in islets of Ins2‐Cre and Ins2‐Tipe1BKO mice was measured by qRT‐PCR or Western blotting. mRNA levels were normalized to β‐actin mRNA. (n = 3 mice/group). E) MIN6 cells were infected with Tet‐On‐Tipe1 (‐DOX) or Tet‐On‐Tipe1 (+DOX) lentiviruses and subjected to EdU incorporation assays. The new generation cells were detected via EdU (green). DAPI stained nuclei blue. Merged view of EdU (green) and DAPI (blue) showing the overlap. Scale bar, 50 µm. (n = 3). F) MIN6 cells were overexpressed with Tipe1 and cell viability was measured using the Cell Counting Kit‐8. (n = 4). G) MIN6 cell proliferation was measured by flow cytometry. Flow cytometry histograms showing the level of Ki67 in MIN6 cell lines infected with vector or Tipe1‐overexpressed lentiviruses. (n = 5). H) MIN6 cells were infected with Pultra‐NC or Pultra‐Tipe1 lentiviruses to overexpress Tipe1. Expression of the indicated genes in Min6 cells was measured by qRT‐PCR. mRNA levels were normalized to β‐actin mRNA. (n = 3). I) MIN6 cells were silenced for Tipe1 expression or overexpressed with Tipe1 for 72 h. Expression of the PCNA in MIN6 cells was measured by Western blotting. J) Expression of the indicated genes in islets of Ins2‐Cre and Ins2‐Tipe1BKO mice was measured by qRT‐PCR. mRNA levels were normalized to β‐actin mRNA. (n = 4 mice/group). K) Expression of PCNA in the islets of Ins2‐Cre and Ins2‐Tipe1BKO mice was measured by Western blotting. L) IF staining of Ki67. Ki67‐positive cells in islets were normalized to total insulin‐positive cells in the same area. Scale bar, 50 µm. (n = 4 mice/group). M) Assessment of apoptosis in Tipe1 silenced MIN6 cells analyzed by Annexin‐V and 7‐AAD by flow cytometry. (n = 3). N) Expression of the apoptosis‐related genes in Tipe1 silenced MIN6 cells was measured by Western blotting. Data are presented as the mean ± SEM. *p < 0.05, **p < 0.01, ***p < 0.001, ns (no significant difference) by Student's t‐test.
Figure 3
Figure 3
Tipe1 maintains β cell function via Gαs/cAMP pathway. A) Tipe1 interaction proteins in MIN6 cells and differentially expressed genes in human IGT and T2D (Hba1c > 6%, 0.2 < logFC <−0.2). B) Intracellular interaction between Tipe1 and Gαs. Endogenous TIPE1 was immunoprecipitated from MIN6 cell lysates and immunoblotted with antibodies against Gαs. C) MIN6 cells were subjected to IF staining with antibodies against TIPE1 (red), Gαs (green). Nuclei were stained with DAPI (blue). Scale bar, 10 µm. D) MIN6 cells silenced Tipe1 for 24 h, then infected with either Ad‐Con or Ad‐Gnas for 48 h, were subjected to EdU incorporation assays by flow cytometry. Flow cytometry histograms showing the level of EdU in MIN6 cell lines. (n = 4 for each group). E) Pancreatic islets from 8‐week‐old Ins2‐Cre and Ins2‐Tipe1BKO mice were treated with either Ad‐Con or Ad‐Gnas for 48 h, subsequently treated with 2.8 or 16.7 mM glucose in an in vitro setting. Insulin levels in the culture supernatants were determined by ELISA. (n = 4 mice/group). F) Islets were treated as in E, and qRT‐PCR was performed to detect the indicated gene expression. mRNA levels were normalized to β‐actin mRNA (n = 4 mice/group). G) Pancreatic islets from 12‐week‐old Ins2‐Cre‐db/db and Ins2‐Tipe1BKO‐db/db mice were treated with either Ad‐Con or Ad‐Gnas for 48 h, subsequently treated with 2.8 or 16.7 mM glucose in an in vitro setting. Insulin levels in the culture supernatants were determined by ELISA. H) Islets were treated as in G, and qRT‐PCR was performed to detect the indicated gene expression. mRNA levels were normalized to β‐actin mRNA. (n = 4 mice/group). I) MIN6 cells were treated as in D, and protein levels of these genes were measured by Western blotting. J) MIN6 cells infected with either Pultra‐NC or Pultra‐Tipe1 lentiviruses for 24 h, then silenced Gnas for 48 h, and the intracellular cAMP level was detected by ELISA kit. K) 8‐week‐old male Ins2‐Cre or Ins‐Tipe1BKO mice were treated with intraperitoneal injection of cAMP agonist (Colforsin, 2 mg k−1g/day) or control (DMSO) for 1 week. GTT‐test in Ins2‐Cre and or Ins2‐Tipe1BKO mice. (n = 5 mice/group). L) Pancreatic islets from 8‐week‐old Ins2‐Cre and Ins2‐Tipe1BKO mice were treated with cAMP agonist (Colforsin, 10 µM) for 48 h, subsequently treated with 2.8 or 16.7 mM glucose in an in vitro setting. Insulin levels in the culture supernatants were determined by ELISA. (n = 4 mice/group). M) Islets were treated as in L, and qRT‐PCR was performed to detect the indicated gene expression. mRNA levels were normalized to β‐actin mRNA. (n = 4 mice/group). N) MIN6 cells infected with either Pultra‐NC or Pultra‐Tipe1 lentiviruses and siRNA targeting Gnas for 48 h, and then treated with cAMP agonist (Colforsin, 10 µM) for 48 h. The protein levels of indicated genes were detected by Western blotting. Data are presented as the mean ± SEM. *p < 0.05, **p < 0.01, ***p < 0.001, ns (no significant difference) by Student's t‐test.
Figure 4
Figure 4
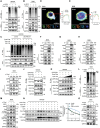
Tipe1 stabilizes Gαs by inhibiting K48‐linked ubiquitination. A,B) Gnas expression in islets of Ins2‐Cre and Ins2‐Tipe1BKO mice was measured by qRT‐PCR and Western blotting. mRNA levels were normalized to β‐actin mRNA. (n/Ins2‐Cre = 5; n/Ins2‐Tipe1BKO = 4). C) MIN6 cells were silenced Tipe1 or infected with Pultra‐NC (vector) or Pultra‐Tipe1 lentiviruses, and the expression of Gαs was detected by Western blotting. D) Isolated islets from Ins2‐Cre and Ins2‐Tipe1BKO mice were subjected to IF staining with antibodies against Insulin (red), Gαs (green). Nuclei were stained with DAPI (blue). A confocal assay was performed. Scale bar, 30 µm. E) HEK293T cells were transfected with human Tipe1‐HA and human‐Gnas‐Flag overexpression plasmid for 48 h. Membrane and cytoplasm fractions were isolated, and Gαs‐Flag levels of whole cell lysates (WCL), membrane (Mem), and cytoplasm (Cyto) were examined using Western blotting analysis. F) Cycloheximide (CHX) chase assay. HEK293T cells transfected with si‐Tipe1 were treated with CHX (500 µg/ml) for the indicated time points. G) Western blotting analysis of HEK293T cells transfected with Tipe1 siRNA and treated with Chloroquine (CQ, 10 µM) for 12 h or MG132 (20 µM) for 6 h. H) Proteins were identified as molecular interactors when using IP by Flag‐tagged Tipe1 and mass spectrometry (by GO function determination), and the top 20 GO clusters are displayed. I) Immunoblotting analysis of MIN6 cells transfected with mouse Tipe1 plasmid, followed by IP with anti‐Gαs, probed with anti‐Ub. J) MIN6 cells were overexpressed Tipe1, followed by IP with anti‐Gαs, and probed with anti‐K48‐Ub or K63‐Ub. K) MIN6 cells were silenced Tipe1, followed by IP with anti‐Gαs, and probed with anti‐K48‐Ub or K63‐Ub. L) HEK293T cells were transfected with human Tipe1‐HA, human‐Gnas‐Flag, Ub‐HA, or Ub‐K48R‐HA overexpression plasmid for 48 h, followed by IP with anti‐Flag, probed with anti‐HA. Data are presented as the mean ± SEM. ns (no significant difference) by Student's t‐test.
Figure 5
Figure 5
Tipe1 inhibits Gαs K48‐linked ubiquitination by USP5. A) Immunoblotting analysis of lysates from HEK293 cells silenced for USP5 but overexpressing Tipe1, followed by IP with anti‐Gαs, probed with anti‐Ub. B) MIN6 cells infected with Pultra‐NC or Pultra‐Tipe1 lentiviruses and silenced USP5 for 48 h, followed by Co‐IP with anti‐Gαs, and probed with anti‐K48‐Ub. C) HEK293T cells were transfected with HA‐tagged Tipe1, Flag‐tagged Gnas, HA‐tagged Ub, or HA‐tagged K48‐linked ubiquitin (K48‐Ub) for 48 h, then treated with USP5 inhibitor (WP1130, 10 µM) for 6 h, followed by IP with anti‐Flag, and probed with anti‐HA. D) HeLa cells were transfected with Flag‐tagged Gnas, GFP‐tagged Tipe1, and Myc‐tagged USP5 for 48 h, then subjected to IF staining with antibodies against Gαs‐Flag (azure) and USP5‐Myc (orange), Nuclei were stained with DAPI (blue). A confocal assay was performed. Scale bar, 10 µm. E) MIN6 cells were subjected to IF staining with antibodies against TIPE1 (green), Gαs (azure), and USP5 (orange), Nuclei were stained with DAPI (blue). A confocal assay was performed. Scale bar, 10 µm. F‐H) Co‐IP with anti‐IgG, anti‐Tipe1, anti‐Gαs, or anti‐USP5, probed with anti‐Gαs, USP5 and Tipe1 in MIN6 cells. I) MIN6 cells transfected with Tipe1 si‐RNA, followed by IP with anti‐IgG, anti‐Gαs, proved with anti‐USP5 and anti‐Gαs. J,K) HEK293 cells overexpressing Tipe1‐HA, Gnas‐Flag, and USP5‐Myc, followed by IP with anti‐Flag, proved with anti‐Flag and anti‐Myc. L) MIN6 cells were silenced Tipe1 for 24 h, then infected with either pLVX‐Con or pLVX‐USP5 for 48 h, followed by IP with anti‐Gαs, probed with anti‐Ub. M) MIN6 cells were silenced Tipe1 for 24 h, then infected with pLVX‐Con or pLVX‐USP5 for 48 h, and the protein levels of indicated genes were detected by Western blotting. N) HEK293 cells silenced for USP5 expression and transfected with Tipe1‐HA, Gnas‐Flag for 48 h, then treated with CHX (500 µg ml−1) for the indicated time points. O) MIN6 cells silenced USP5 for 24 h, then infected with Ad‐Con or Ad‐Tipe1 for 48 h, the protein levels of indicated genes were detected by Western blotting.
Figure 6
Figure 6
Negative correlation of blood glucose level with Tipe1 and Gαs expression in human islet β cells. A) Representative images for multiplexed immunofluorescence staining (TIPE1, green; Insulin, orange; USP5, red; Gαs, purple) in pancreatic paracancerous tissues from pancreatic cancer patients with and without T2D. B) The MFI for the expression of Tipe1 in human islet β cells of paracancerous tissues from pancreatic cancer patients with and without T2D. (n/ND = 6, n/T2D = 7). C) The frequency for Gαs positive cells in Tipe1 negative or positive islet β cells in human islet β cells of paracancerous tissues from pancreatic cancer patients. (n/Islet = 36). D) The frequency for Gαs and Tipe1 double‐positive cells in human islet β cells of pancreatic tissue of paracancerous from pancreatic cancer patients with and without diabetes. (n/ND = 6, n/T2D = 7). E) The frequency for Gαs and USP5 double‐positive cells in Tipe1 negative or positive islet β cells of pancreatic paracancerous tissues from pancreatic cancer patients. (n/Islet = 36). F) Correlation of fasting blood glucose with the MFI of Tipe1 expression in islet β cells of pancreatic paracancerous tissues from pancreatic cancer patients with and without T2D. (n/Islet = 36). G) Correlation of fasting blood glucose with the frequency of Gαs and Tipe1 double‐positive cells in islet β cells of pancreatic paracancerous tissues from pancreatic cancer patients with and without T2D. (n/Islet = 36). H) A schematic illustration showing a plausible mechanism underlying Tipe1 orchestrating islet β cell insulin secretion and proliferation by promoting Gαs/cAMP signaling via USP5. Data are presented as the mean ± SEM. **p < 0.01, ***p < 0.001 by Student's t‐test.

Similar articles

Cited by

References

    1. Campbell J. E., Newgard C. B., Nat. Rev. Mol. Cell Biol. 2021, 22, 142. - PMC - PubMed
    1. Nishimura W., Iwasa H., Tumurkhuu M., Int. J. Mol. Sci. 2022, 23, 4478. - PMC - PubMed
    1. Eizirik D. L., Pasquali L., Cnop M., Nat. Rev. Endocrinol. 2020, 16, 349. - PubMed
    1. Aguayo‐Mazzucato C., Bonner‐Weir S., Cell Metab. 2018, 27, 57. - PMC - PubMed
    1. Weir G. C., Gaglia J., Bonner‐Weir S., Lancet Diabetes Endocrinol. 2020, 8, 249. - PMC - PubMed

Publication types

MeSH terms